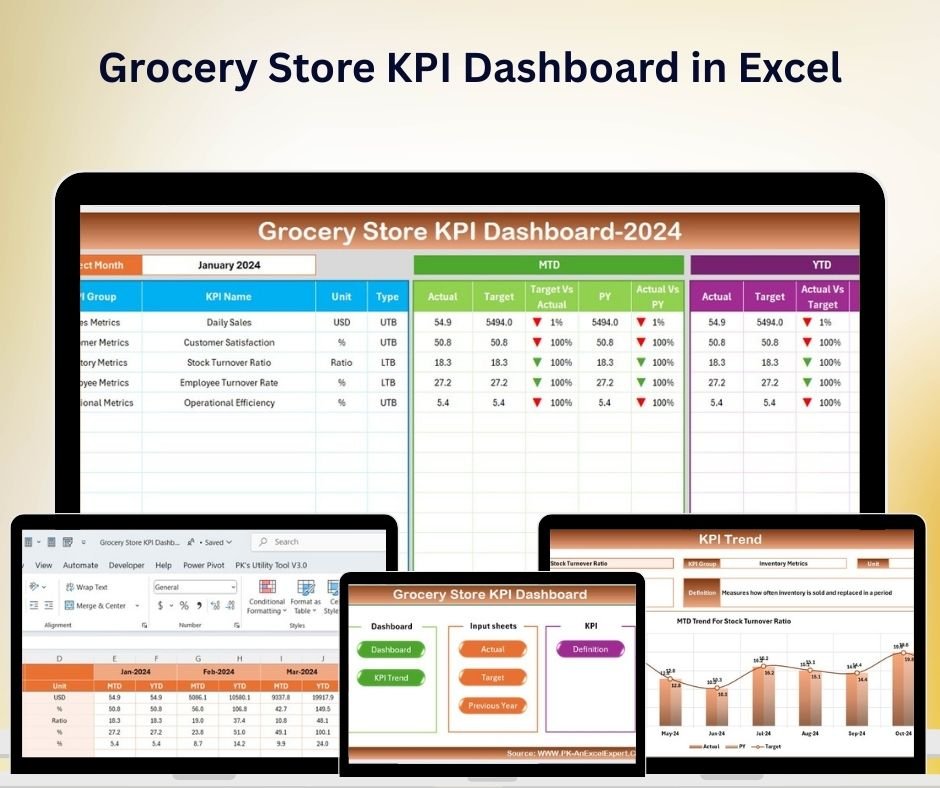
The Grocery Store KPI Dashboard in Excel is an essential tool for grocery store owners, managers, and analysts looking to track key performance indicators (KPIs) that are critical to running a successful grocery business. This Excel-based dashboard allows you to efficiently monitor sales performance, inventory levels, customer satisfaction, and operational efficiency, providing actionable insights that help optimize store operations and increase profitability.
With its user-friendly interface and real-time data tracking, this dashboard makes it easier to stay on top of store performance and make informed decisions that drive growth. Whether you’re managing a small local grocery store or a large supermarket chain, this dashboard can be customized to meet your unique business needs.

Key Features of the Grocery Store KPI Dashboard in Excel
📊 Sales Performance Monitoring
Track daily, weekly, monthly, and yearly sales data to evaluate the overall performance of the grocery store. Monitor sales trends and identify peak shopping times, helping you adjust your inventory and staffing levels accordingly.
📦 Inventory Management
Monitor inventory levels in real time to ensure that popular items are always in stock and to prevent overstocking of slow-moving products. Track stock turnover and identify the best-selling items to optimize product placement and pricing.
🛒 Customer Satisfaction Metrics
Assess customer satisfaction through metrics such as Net Promoter Score (NPS), customer feedback, and shopping experience surveys. Use this data to enhance customer service, increase retention, and improve the in-store experience.
💵 Profit Margin Tracking
Track profit margins for different product categories and sales channels. Identify high-margin products and adjust pricing strategies to increase profitability while remaining competitive.
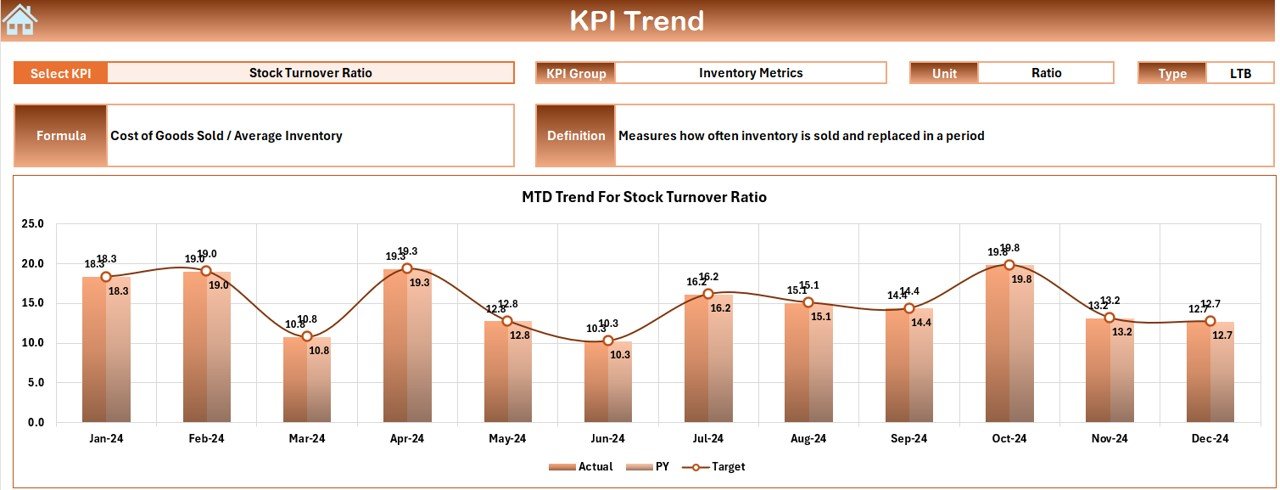
📈 Time-Based Sales Analysis
Track sales data over different time periods to identify trends, track seasonal peaks, and plan promotional events. Use this information to make strategic decisions about product offerings, discounts, and marketing efforts.
⚙️ Customizable Dashboard
Customize the dashboard to fit the specific needs of your grocery store. Adjust KPIs, metrics, and data visualizations to align with your business goals, whether you’re a single-location store or a multi-location grocery chain.
Why You’ll Love the Grocery Store KPI Dashboard in Excel
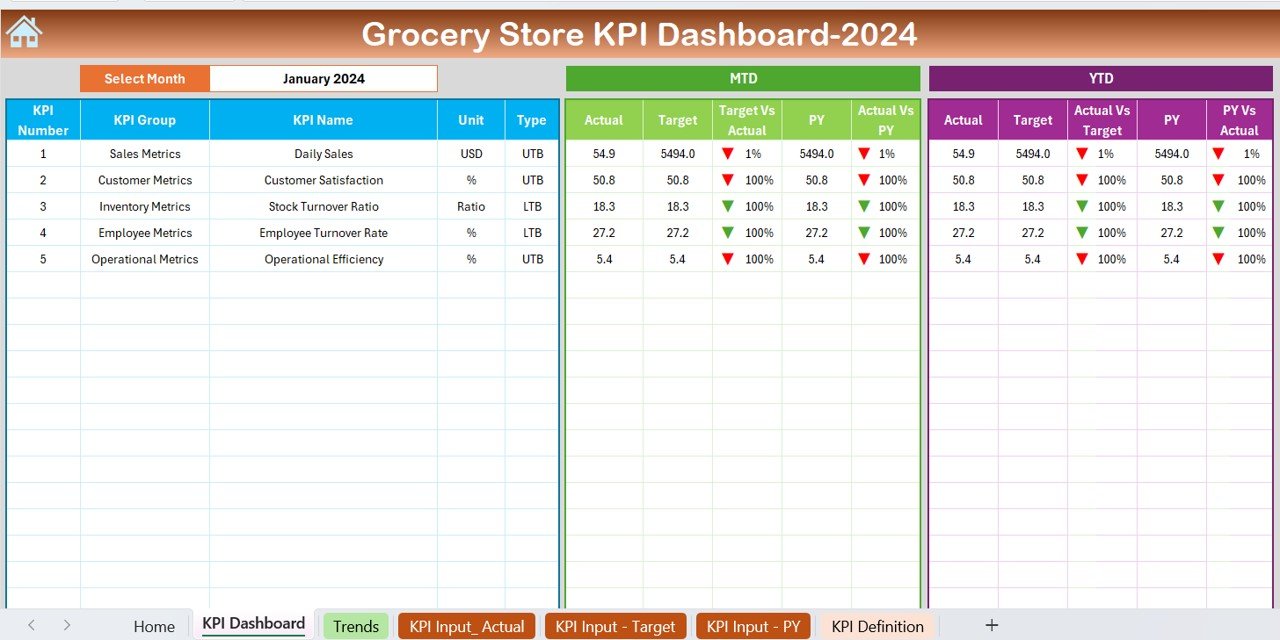
✅ Comprehensive Sales & Performance Tracking
Monitor sales, inventory, and customer satisfaction in one place. This holistic view enables you to make data-driven decisions that optimize store performance.
✅ Improve Operational Efficiency
Track inventory turnover and ensure you have the right stock at the right time, reducing stockouts and overstocking issues that can hurt profitability.
✅ Boost Customer Retention & Service
By tracking customer satisfaction metrics, you can enhance the shopping experience, improve service, and increase repeat business from loyal customers.
✅ Data-Driven Profit Optimization
Analyze profit margins and adjust product pricing to maximize profitability without compromising customer satisfaction.
✅ Scalable & Customizable
The dashboard is scalable, making it perfect for small grocery stores as well as large chains. Tailor it to suit your specific business needs and track the most relevant KPIs for your store.
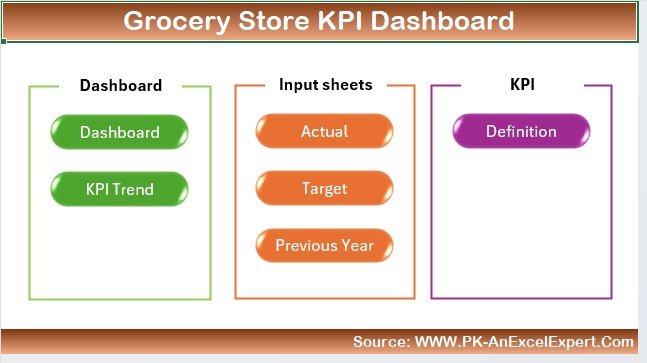
What’s Inside the Grocery Store KPI Dashboard in Excel?
-
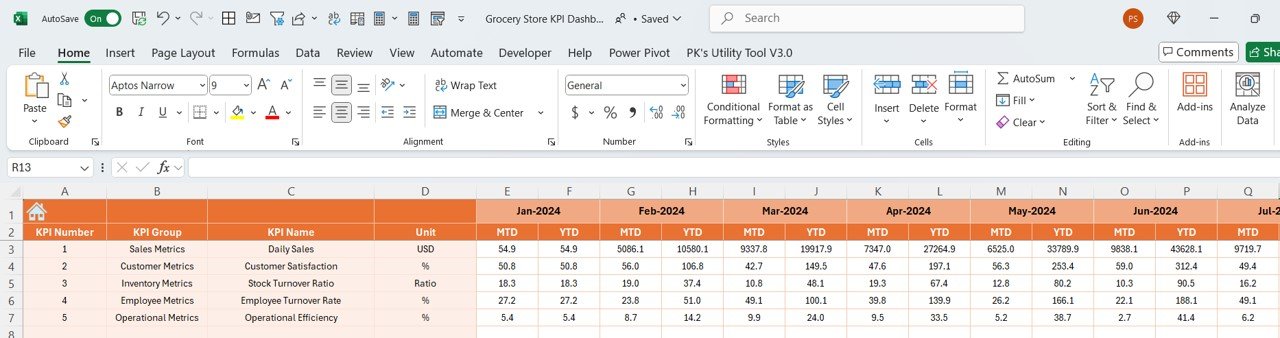
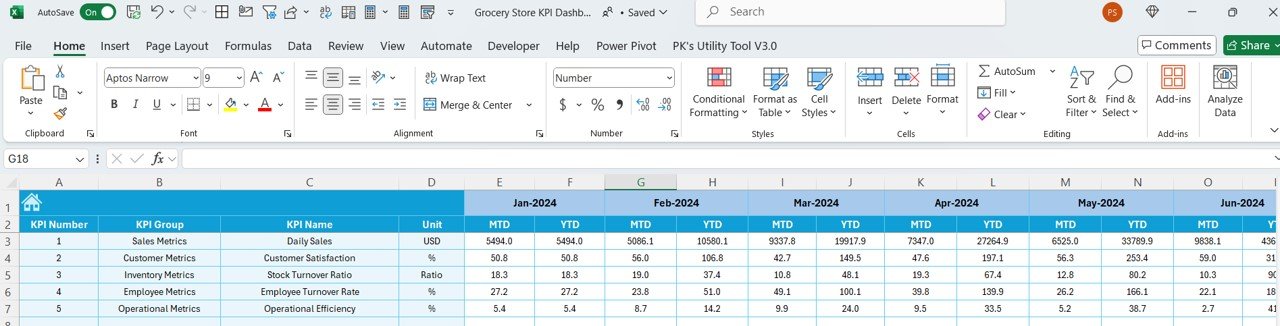
Sales Performance Monitoring: Track daily, weekly, and monthly sales data.
-
Inventory Management: Monitor stock levels, turnover, and stock-outs.
-
Customer Satisfaction Metrics: Assess NPS and customer feedback.
-
Profit Margin Tracking: Track profit margins for products and categories.
-
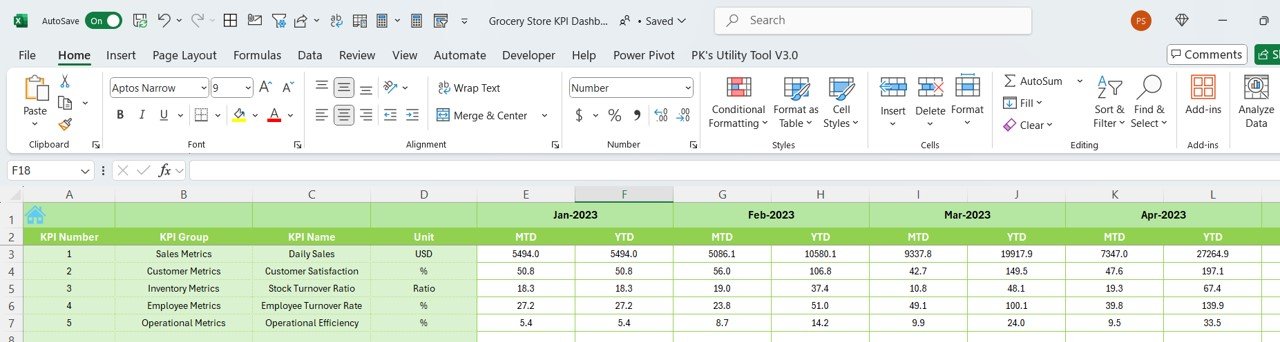
Time-Based Sales Analysis: Analyze sales trends over different time periods.
-
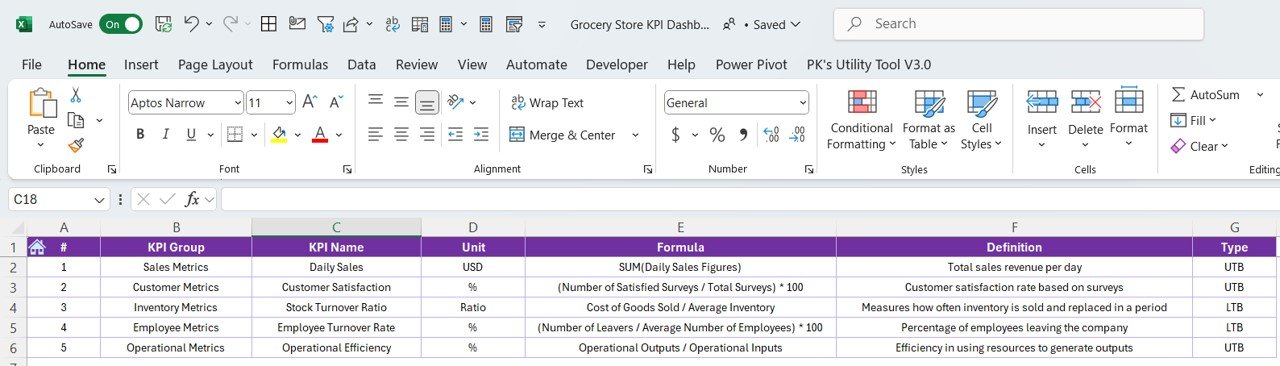
Customizable KPIs: Tailor the dashboard to your specific business needs.
How to Use the Grocery Store KPI Dashboard in Excel
1️⃣ Download the Template: Instantly access the Grocery Store KPI Dashboard in Excel.
2️⃣ Input Your Sales & Inventory Data: Add daily sales, inventory data, and customer feedback into the dashboard.
3️⃣ Monitor KPIs & Performance: Track key metrics such as sales performance, inventory levels, and profit margins.
4️⃣ Analyze Trends & Data: Use time-based analysis to identify sales trends and plan for seasonal peaks.
5️⃣ Optimize Operations: Use insights to adjust inventory levels, pricing strategies, and customer service practices.
Who Can Benefit from the Grocery Store KPI Dashboard in Excel?
🔹 Grocery Store Owners & Managers
🔹 Retail Analysts & Business Analysts
🔹 Supply Chain & Inventory Managers
🔹 Marketing & Customer Service Teams
🔹 Small & Medium Grocery Stores
🔹 Large Supermarket Chains
Ensure that your grocery store is performing at its best with the Grocery Store KPI Dashboard in Excel. Monitor sales, inventory, and customer satisfaction to improve operational efficiency and increase profitability.
Click here to read the Detailed blog post
Visit our YouTube channel to learn step-by-step video tutorials
Youtube.com/@PKAnExcelExpert


Reviews
There are no reviews yet.