


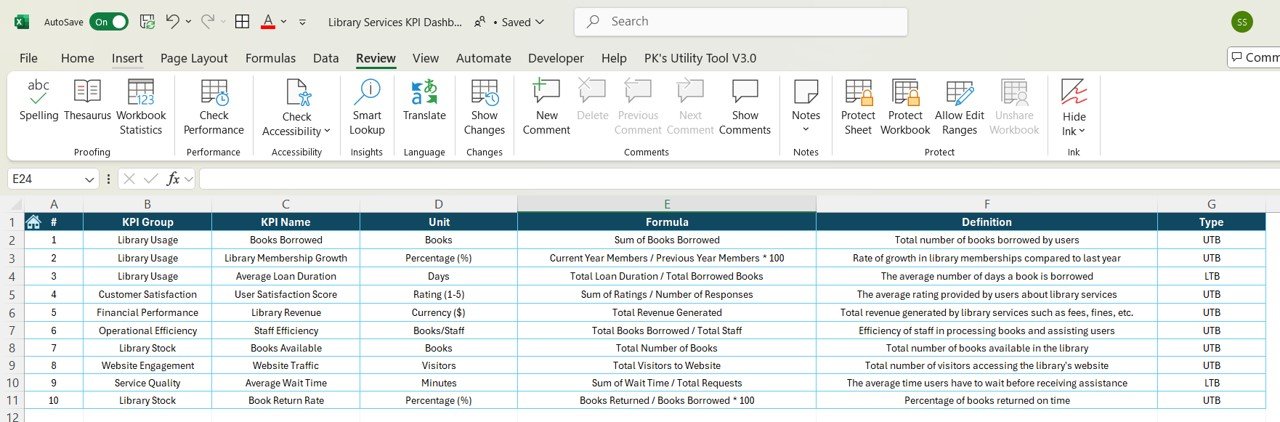
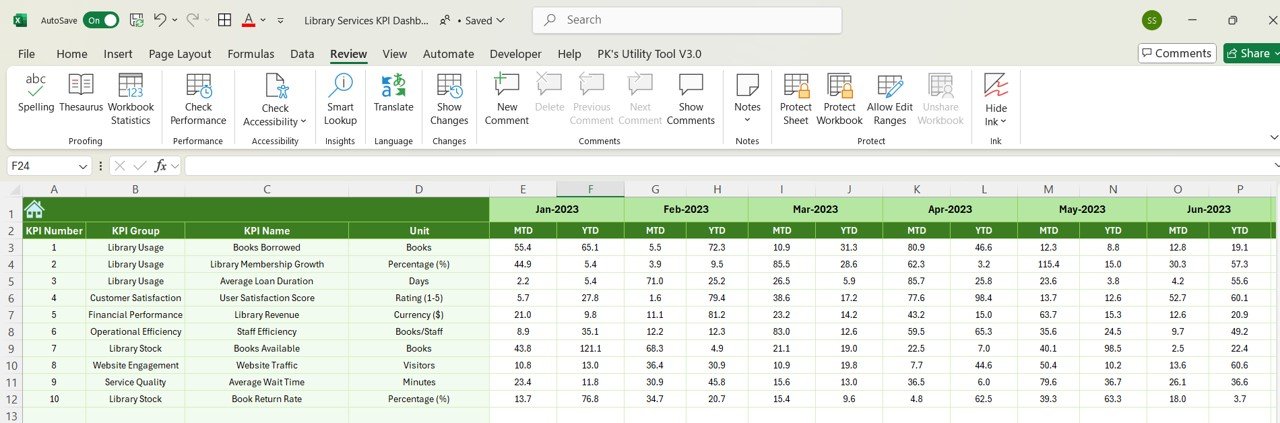

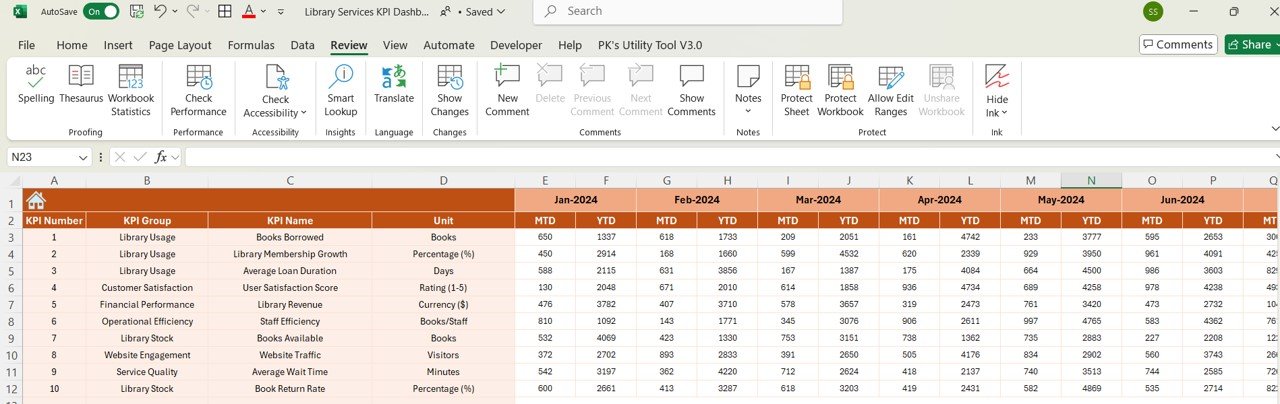
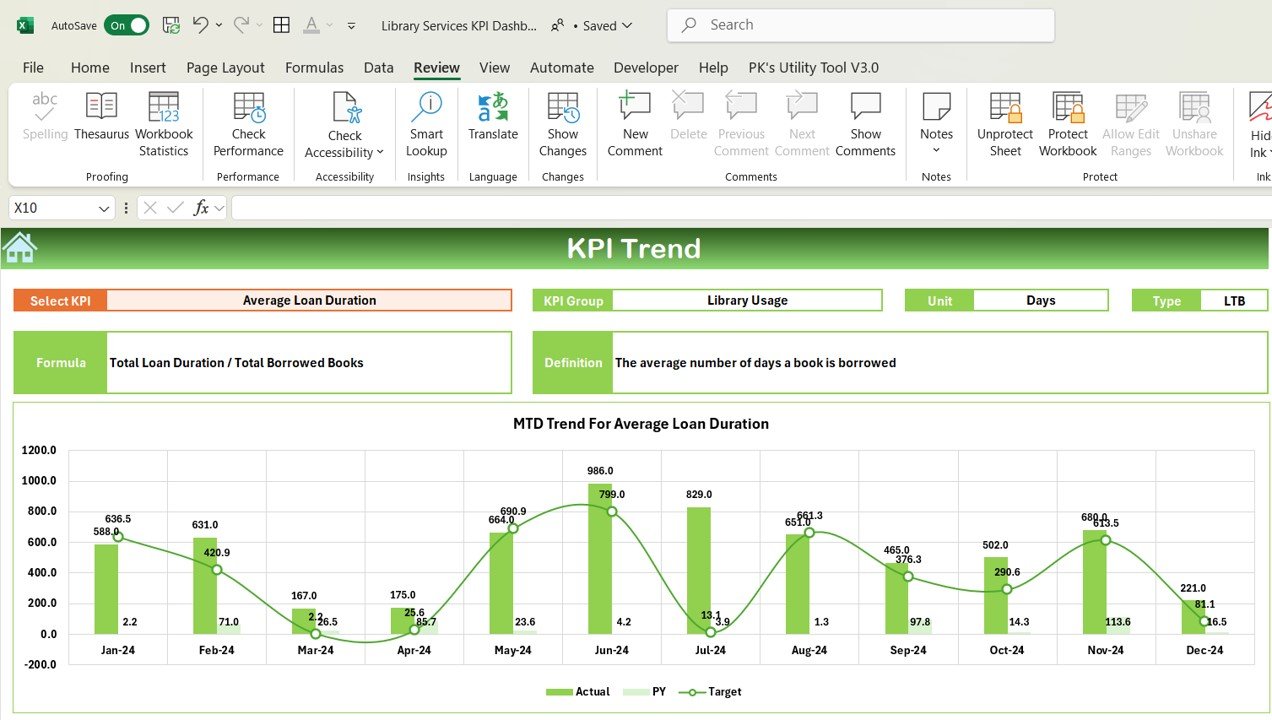


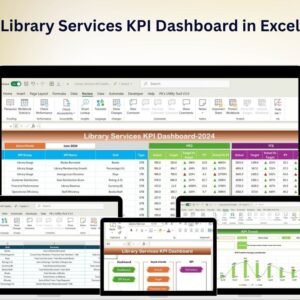
The Library Services KPI Dashboard in Excel is a comprehensive tool designed for library managers, staff, and analysts to track key performance indicators (KPIs) essential for managing and optimizing library services. This Excel-based dashboard provides insights into library performance, including circulation, patron engagement, collection management, and staff efficiency. It allows you to monitor key metrics in real-time, enabling data-driven decisions to enhance library operations and improve service delivery.
With its user-friendly design and customizable features, this dashboard helps you monitor library operations, track usage trends, and ensure optimal resource management, making it easier to serve your patrons and enhance library service quality.

Key Features of the Library Services KPI Dashboard in Excel:
📚 Library Circulation Tracking
Monitor the number of books, e-books, and other materials checked out by patrons, and track trends in circulation across various categories.
📊 Patron Engagement
Track patron visits, program attendance, and customer satisfaction to evaluate engagement levels and enhance community outreach programs.
📈 Collection Management
Monitor the library’s collection usage, acquisitions, and retention rates to ensure that the collection is relevant and up-to-date.
💼 Staff Efficiency and Productivity
Track key staff performance metrics, such as the number of patrons assisted, tasks completed, and overall staff productivity.
💰 Budget and Financial Tracking
Monitor library budget allocation, expenditures, and financial efficiency to ensure that resources are allocated effectively to support operations.
🚀 Why You’ll Love the Library Services KPI Dashboard in Excel:
✅ Track Library Circulation – Easily monitor the number of items checked out and identify trends in circulation to optimize inventory management.
✅ Measure Patron Engagement – Track patron visits, program participation, and satisfaction to ensure you’re meeting the needs of your community.
✅ Optimize Collection Management – Monitor the effectiveness of your library collection, track new acquisitions, and manage retention rates.
✅ Monitor Staff Productivity – Track staff performance metrics to ensure your team is effectively serving patrons and completing tasks.
✅ Maintain Financial Efficiency – Track budget allocations, expenditures, and other financial metrics to ensure resources are being used effectively.
✅ Customizable and Interactive – Tailor the dashboard to fit your library’s specific needs with interactive, real-time data visualizations and reports.
What’s Inside the Library Services KPI Dashboard in Excel:
Library Circulation Tracking: Track the number of items checked out, including books, magazines, and e-books, and analyze trends over time.
Patron Engagement: Monitor patron visits, program participation, and feedback to assess customer satisfaction and improve services.
Collection Usage and Management: Analyze the circulation of materials, acquisitions, and retention to manage your library collection efficiently.
Staff Productivity: Measure staff productivity by tracking tasks completed, patrons assisted, and the overall effectiveness of your team.
Financial Monitoring: Track budget allocations, expenditures, and financial performance to ensure effective use of library funds.
Custom Reports: Generate customized reports on circulation, patron engagement, collection management, and staff performance to support decision-making.
How to Use the Library Services KPI Dashboard in Excel:
1️⃣ Download the Template – Instantly access your Excel file upon purchase.
2️⃣ Input Data – Add your library data, including circulation, patron engagement, staff performance, and budget information to start tracking KPIs.
3️⃣ Monitor Circulation Trends – Use the dashboard to track the number of items checked out by patrons and identify patterns in material usage.
4️⃣ Track Patron Engagement – Monitor patron visits, program attendance, and customer satisfaction to evaluate and improve your outreach efforts.
5️⃣ Evaluate Collection Usage – Track how materials are being used, and make data-driven decisions regarding acquisitions and de-selection.
6️⃣ Track Financial Metrics – Monitor your budget and expenses to ensure that your library is operating efficiently within its financial limits.
7️⃣ Generate Custom Reports – Create detailed reports on circulation, patron engagement, collection management, and staff performance for comprehensive analysis.
Who Can Benefit from the Library Services KPI Dashboard in Excel:
Library Managers and Administrators
Staff in Public Libraries
Academic Library Directors
Collection Management Teams
Library Financial Analysts
Operations and Facilities Managers in Libraries
Library Program Coordinators
Library Consultants
Patrons Services Managers
Education and Community Outreach Teams
The Library Services KPI Dashboard in Excel is an indispensable tool for improving library management and performance. With real-time tracking of key metrics such as circulation, patron engagement, staff efficiency, and financial performance, this dashboard ensures that your library operates smoothly and meets the needs of your community.
Click here to read the Detailed blog post
https://www.pk-anexcelexpert.com/library-services-kpi-dashboard-in-excel/
Visit our YouTube channel to learn step-by-step video tutorials
Youtube.com/@PKAnExcelExpert
Compatibility and Requirements
- Works in Microsoft Excel desktop (Excel 2016 or later, or Microsoft 365).
- New to Excel? Microsoft has a free guide: Excel for Windows training.
Frequently Asked Questions
What does the Library Services KPI Dashboard track?
It tracks circulation of books, e-books and other materials, patron visits and program attendance, collection usage, staff productivity and budget spending.
Can I see circulation trends?
Yes. It shows how many items are checked out and how circulation changes over time across categories.
Does it cover the library budget?
Yes. You can track budget allocations, expenditures and financial efficiency.
Can I change the KPIs?
Yes. You can tailor the dashboard to your library’s needs.
Is there a Google Sheets or Power BI version?
Yes. See the Library Services KPI Dashboard in Google Sheets and the Library Services KPI Dashboard in Power BI.
Related Library Templates
- Library Services KPI Dashboard in Google Sheets: the same KPIs in Google Sheets
- Library Services KPI Dashboard in Power BI: the Power BI edition
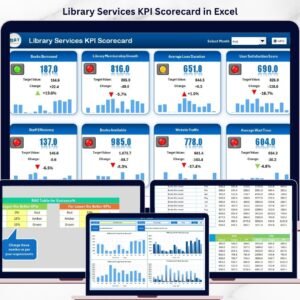
- Library Services KPI Scorecard in Excel: a scorecard view of library KPIs
- Library Book Due Calendar in Excel: track book due dates
- Library Book Issue Data Entry System in Excel: record book issues and returns
Browse all Excel KPI dashboards or the Excel education templates.






























Reviews
There are no reviews yet.