


The Water Sales KPI Dashboard in Excel is a powerful tool designed to help water utilities, sales managers, and analysts monitor and analyze key performance indicators (KPIs) related to water sales. This intuitive and user-friendly dashboard provides real-time insights into sales performance, enabling organizations to optimize their strategies, track progress, and make informed decisions to drive growth and operational efficiency.
By consolidating critical sales data in one centralized location, the dashboard allows users to effectively track both sales achievements and challenges. With visual aids such as charts and conditional formatting, users can easily identify performance gaps and areas for improvement, ensuring that water sales operations are aligned with organizational goals.

Key Features of the Water Sales KPI Dashboard:
📊 Centralized Dashboard:
-
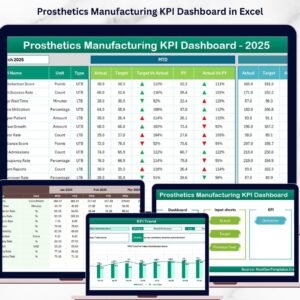
The Dashboard Sheet Tab displays key KPIs such as Month-to-Date (MTD) and Year-to-Date (YTD) comparisons of actual versus target sales figures. The dashboard includes visual indicators, like up and down arrows, to quickly highlight performance trends and discrepancies.
📅 Historical and Trend Analysis:
-
The KPI Trend Sheet Tab allows users to select any KPI and view its historical trends, providing insights into long-term performance. This page includes KPI definitions, units of measurement, and formulas for clear and consistent tracking.
📈 Customizable Data Input:
-
The Actual Number Sheet Tab lets users input MTD and YTD sales figures, allowing for adjustments based on the starting month. This flexibility ensures that the dashboard can be customized to fit your organization’s sales cycle and reporting needs.
🎯 Target and Benchmarking:
-
The Target Sheet Tab enables users to set and track monthly and yearly sales targets for each KPI. This feature helps establish clear benchmarks for sales performance and makes it easy to compare actual performance against goals.
📅 Year-over-Year Comparison:
-
The Previous Year Number Sheet Tab stores historical data, enabling year-over-year comparisons. This feature allows organizations to track progress, identify growth areas, and plan for the future based on past performance.
📚 Clear KPI Definitions:
-
The KPI Definition Sheet Tab provides detailed explanations for each KPI, including units, formulas, and classifications, ensuring that all users have a consistent understanding of the metrics being tracked.
Benefits of Using the Water Sales KPI Dashboard:
-
Improved Performance Monitoring:
By centralizing sales data and providing visual performance indicators, the dashboard enables quick identification of underperforming areas, helping sales teams take corrective actions when needed. -
Data-Driven Decision Making:
With accurate, up-to-date data at your fingertips, you can make informed decisions about resource allocation, sales strategies, and operational improvements. -
Enhanced Strategic Planning:
By analyzing historical data and trends, organizations can forecast future sales, set realistic targets, and create strategies that support long-term growth and sustainability. -
User-Friendly Interface:
Designed for users of all skill levels, this dashboard allows easy navigation and data entry, making it accessible to everyone from sales managers to analysts.
How to Use the Water Sales KPI Dashboard:
-
Download the Template:
Start by downloading the Excel file. It’s designed for compatibility with various versions of Microsoft Excel. -
Input Sales Data:
Enter your organization’s sales data into the Actual Number Sheet Tab. Update your sales figures regularly to keep the dashboard current. -
Set and Track Targets:
Use the Target Sheet Tab to define monthly and yearly sales goals for each KPI. Compare these targets with actual sales to measure performance. -
Monitor Performance Trends:
The KPI Trend Sheet Tab allows you to track long-term performance. Visualize how your KPIs have evolved over time and use that data to adjust your strategies. -
Review and Analyze KPIs:
Utilize the KPI Definition Sheet Tab to gain clarity on each metric and ensure everyone is on the same page when it comes to performance tracking.
Who Can Benefit from This Water Sales KPI Dashboard?
-
Sales Managers:
Oversee daily sales activities, ensuring that targets are met and strategies are aligned with business goals. -
Data Analysts:
Analyze sales trends and performance metrics to provide insights that guide sales strategies and operational improvements. -
Strategic Planners:
Use historical data to forecast sales and plan for future growth, ensuring alignment with business objectives. -
Regulatory Compliance Officers:
Monitor sales data to ensure compliance with industry regulations and standards.
The Water Sales KPI Dashboard in Excel is an indispensable tool for water utilities, sales teams, and organizations striving for operational excellence and continuous improvement in their water sales performance. By providing a clear, data-driven view of performance, this dashboard empowers users to make better decisions and drive sales growth.
Click here to read detailed blog post
Visit our YouTube channel to learn step-by-step video tutorials


Reviews
There are no reviews yet.