Sustainability is no longer a branding strategy — it’s a business responsibility. Rising energy costs, increasing water consumption, and growing ESG reporting requirements demand structured monitoring. Yet many organizations still rely on disconnected reports.
Stop guessing. Start measuring.
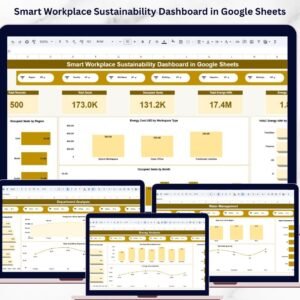
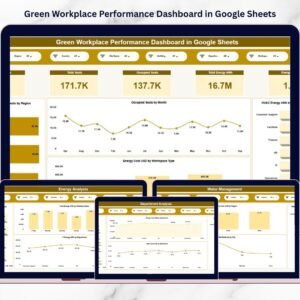
The Green Workplace Performance Dashboard in Google Sheets is a ready-to-use, cloud-based sustainability analytics solution designed to centralize environmental metrics in one powerful system.
Track energy, water, waste, occupancy, and departmental performance — all inside one interactive Google Sheets dashboard.
No complex software. No installation. Just instant, collaborative insights.
🚀 Key Feature of Green Workplace Performance Dashboard in Google Sheets
🌍 Cloud-Based & Collaborative – Access from anywhere, anytime.
📊 Executive KPI Cards – Monitor Seats, Energy kWh, Water m³, and Waste kg instantly.
⚡ Energy Efficiency Analysis – Track Grid, Renewable & HVAC energy by region and department.
💧 Water & Waste Monitoring – Control water cost and waste generation effectively.
🏢 Department-Level Accountability – Identify high-consumption teams quickly.
📅 Month & Weekday Trend Insights – Detect peak usage patterns.
🔎 Real-Time Filtering – Analyze by Region, Department, Building Type & Workspace Type.
📦 What’s Inside the Green Workplace Performance Dashboard in Google Sheets
This sustainability analytics solution includes multiple structured pages:
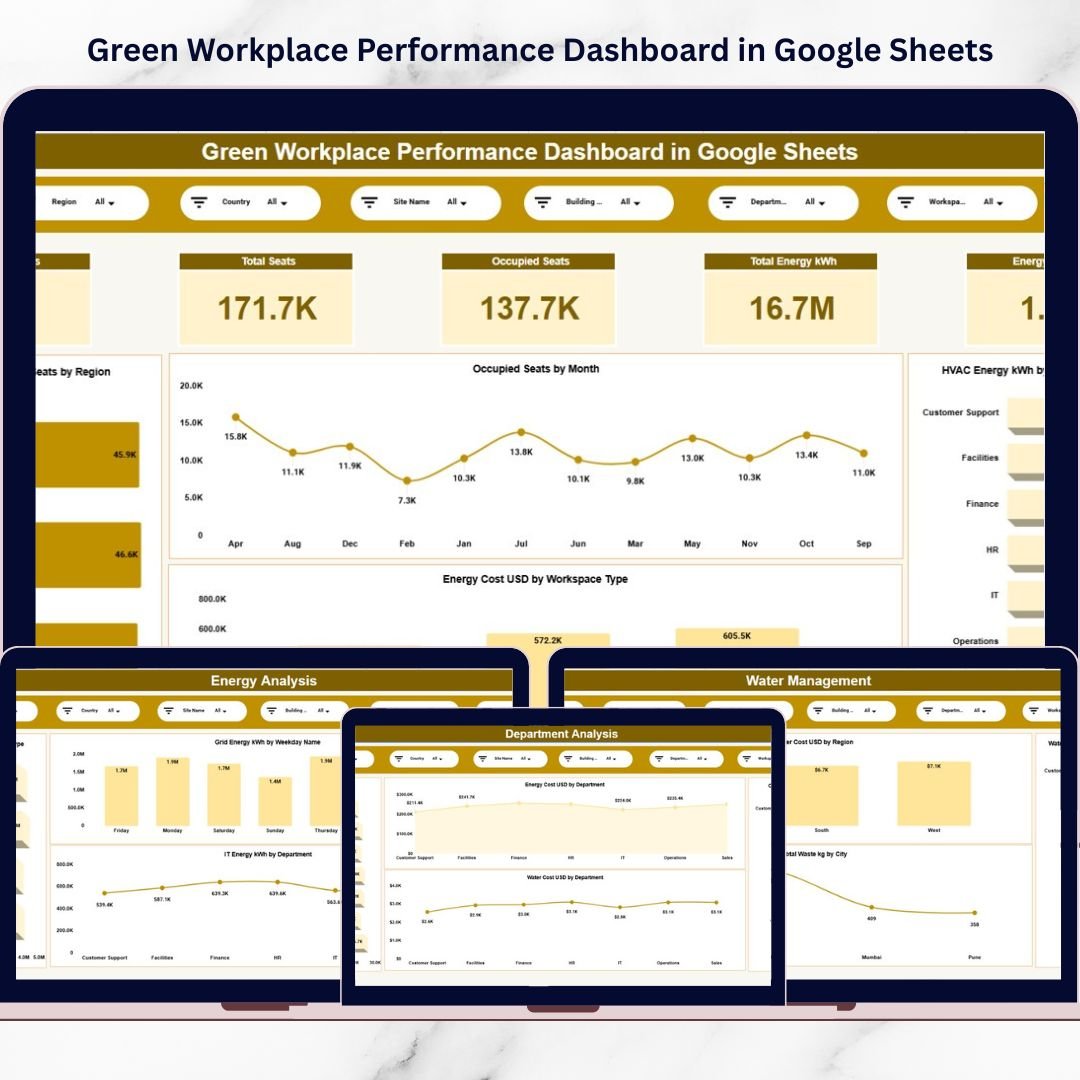
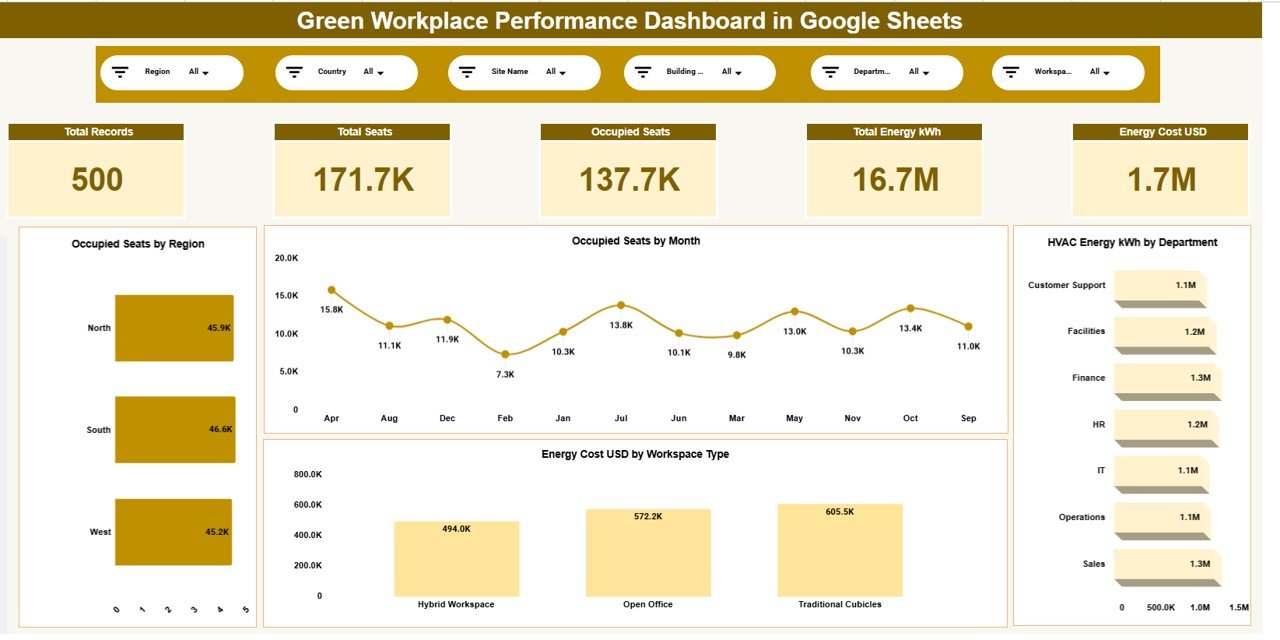
1️⃣ Overview Page – Executive Sustainability Snapshot
Your command center for environmental performance.
KPI Cards Display:
-
Total Records
-
Total Seats
-
Occupied Seats
-
Total Energy (kWh)
-
Energy Cost (USD)
Visual Reports Include:
-
Occupied Seats by Region
-
Occupied Seats by Month
-
Energy Cost by Workspace Type
-
HVAC Energy kWh by Department
Instant clarity for leadership teams.
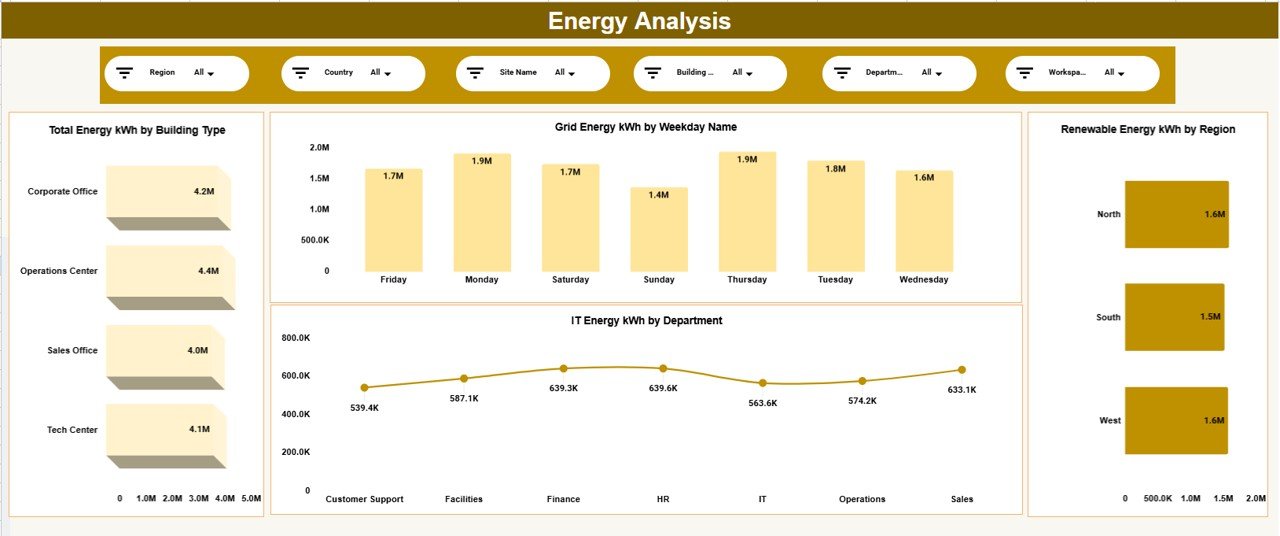
2️⃣ Energy Analysis Page – Monitor Energy Efficiency
Energy drives operational cost and carbon footprint.
Track:
-
Total Energy kWh by Building Type
-
Grid Energy kWh by Weekday
-
Renewable Energy kWh by Region
-
IT Energy kWh by Department
Identify peak consumption days. Improve renewable energy adoption. Reduce unnecessary usage.
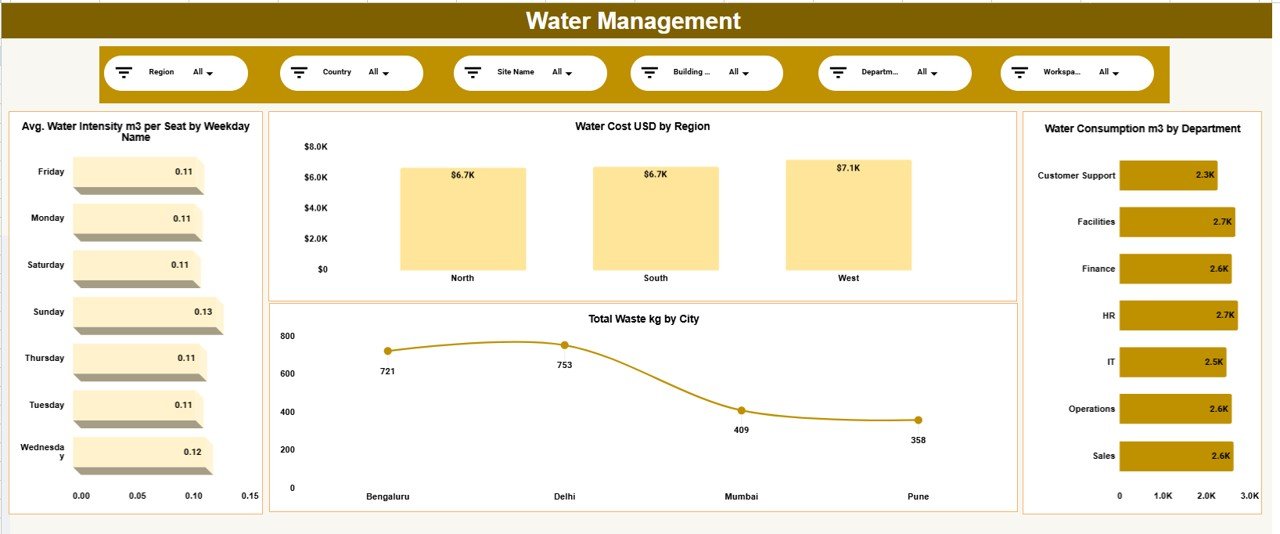
3️⃣ Water Management Page – Control Water & Waste
Support ESG goals through water and waste optimization.
Key Metrics:
-
Average Water Intensity per Seat
-
Water Cost USD by Region
-
Water Consumption m³ by Department
-
Total Waste kg by City
Take action on high-cost regions and high-waste locations immediately.
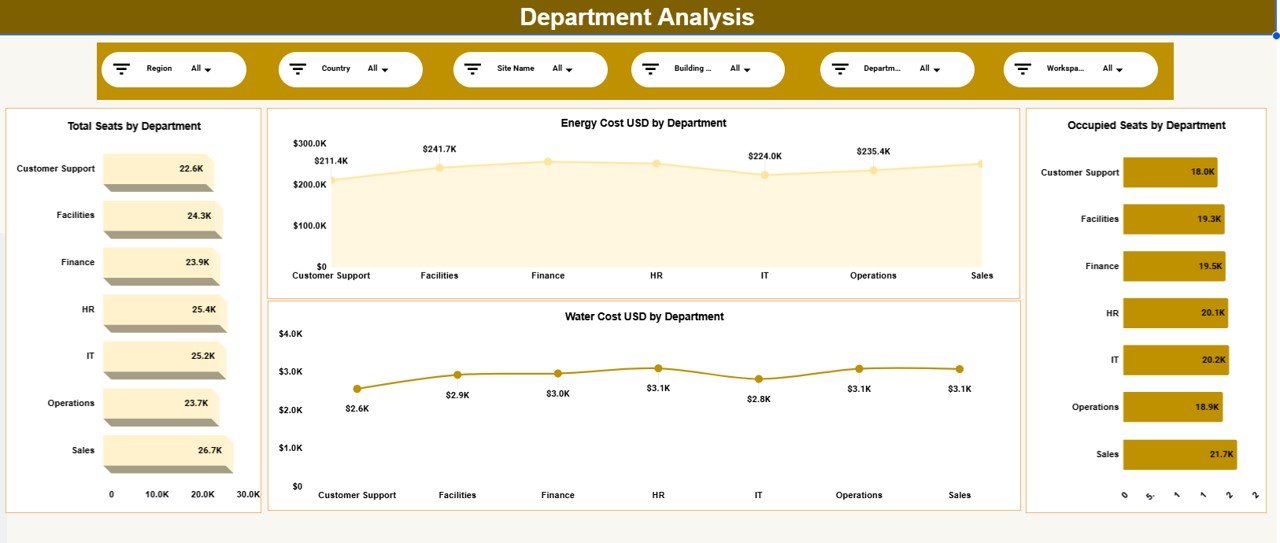
4️⃣ Department Analysis Page – Improve Accountability
Break down sustainability performance department-wise.
Monitor:
-
Total & Occupied Seats by Department
-
Energy Cost by Department
-
Water Cost by Department
Encourage sustainable practices across teams with measurable metrics.
🛠 How to Use the Green Workplace Performance Dashboard in Google Sheets
1️⃣ Enter monthly sustainability data.
2️⃣ Update energy, water, and occupancy records.
3️⃣ Use filters to analyze by region or department.
4️⃣ Review KPI cards for quick performance status.
5️⃣ Present sustainability reports to leadership.
Because it is built in Google Sheets, teams collaborate seamlessly in real time.
👥 Who Can Benefit from This Dashboard
✔ Corporate Sustainability Teams
✔ ESG Reporting Managers
✔ Facility & Operations Heads
✔ Energy Managers
✔ Multi-Location Enterprises
✔ Business Campuses & IT Parks
If your organization tracks environmental metrics, this dashboard becomes your centralized control system.
🌎 Why Choose Google Sheets for Sustainability Analytics?
✔ Cloud-based access
✔ Real-time collaboration
✔ No installation required
✔ Automatic saving
✔ Easy sharing with leadership
✔ Cost-effective solution
Perfect for both small organizations and enterprise-level operations.
📈 Why This Dashboard Is a Game-Changer
Instead of scattered spreadsheets:
You centralize energy, water, and waste data.
Instead of manual ESG calculations:
You generate structured sustainability reports instantly.
Instead of reacting to rising costs:
You detect inefficiencies early.
From occupancy optimization to renewable energy tracking, every metric becomes visible and actionable.
If your goal is stronger ESG compliance, cost control, and environmental accountability, this dashboard delivers measurable impact.
Click here to read the Detailed blog post
Watch the step-by-step video tutorial:
Visit our YouTube channel to learn step-by-step video tutorials
👉 YouTube Channel – NeotechNavigators