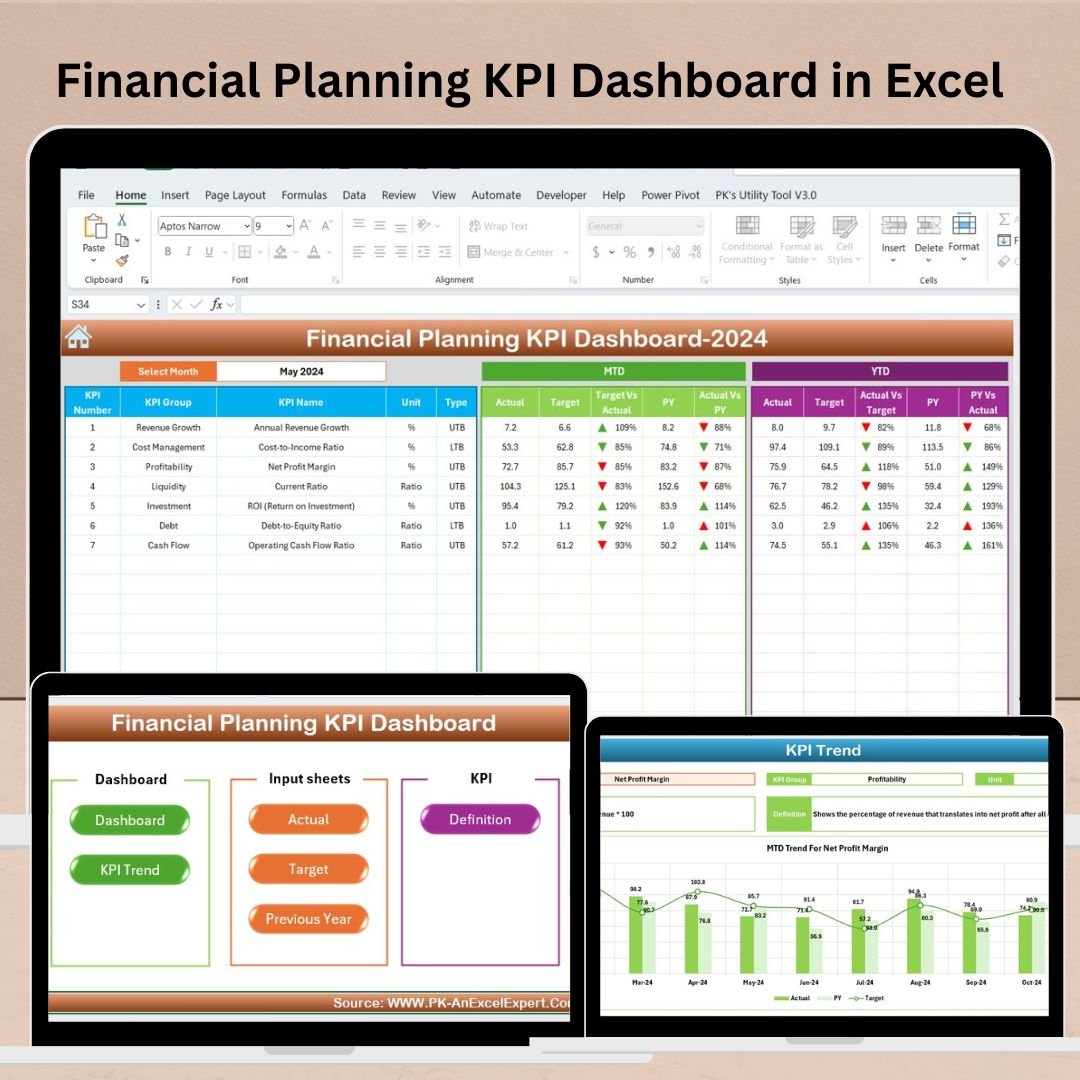
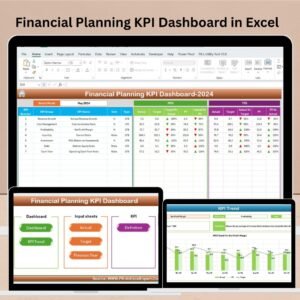
The Financial Planning KPI Dashboard in Excel is a comprehensive and intuitive tool designed to help individuals, financial planners, and businesses track and manage key financial metrics. Whether you’re planning your personal finances or managing the financial health of an organization, this Excel-based dashboard provides you with a clear view of essential KPIs such as income, expenses, savings, investment performance, and budgeting.
This easy-to-use dashboard allows users to monitor financial goals, assess spending patterns, and make informed decisions to enhance financial stability and growth. With real-time updates and visual analytics, the dashboard offers powerful insights that make financial planning a breeze.
Key Features of the Financial Planning KPI Dashboard in Excel
📊 Income & Expense Tracking
Monitor income sources, track monthly expenses, and calculate your savings potential. The dashboard helps you stay on top of your cash flow, ensuring that you’re aware of your financial situation at all times.
💵 Budgeting & Spending Analysis
Set budgets for different spending categories and track your actual spending. Compare your planned budget with actual expenses to identify potential areas for savings or reallocation.
📈 Investment & Asset Management
Track the performance of your investments, including stocks, bonds, or real estate. Use the dashboard to analyze asset performance over time, helping you make smarter investment decisions.
🔒 Debt Management
Monitor and manage your outstanding debts, including credit card balances, loans, and mortgages. Stay on top of repayment schedules and calculate the impact of payments on your financial health.
📅 Time-Based Financial Tracking
Track your finances over different time periods—monthly, quarterly, or annually. Analyze trends in income, spending, savings, and investments to help make long-term financial decisions.
⚙️ Customizable Dashboard
Customize the dashboard to reflect your specific financial goals and needs. Add or remove categories, modify KPIs, and tailor the tracker to fit your financial planning objectives.
Why You’ll Love the Financial Planning KPI Dashboard in Excel
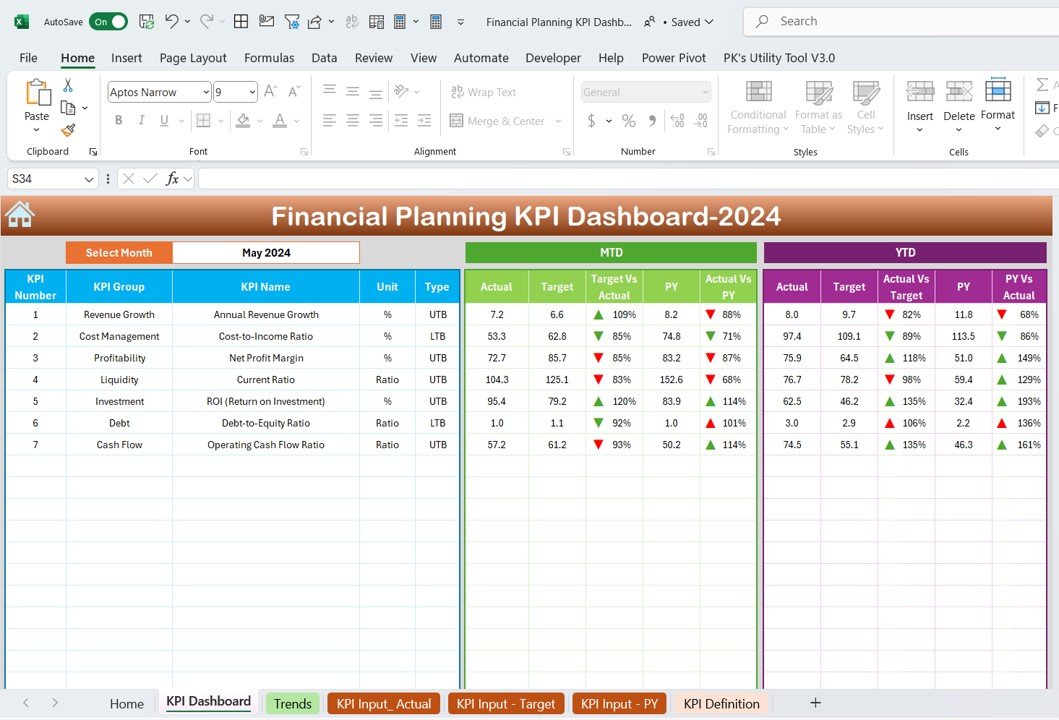
✅ Comprehensive Financial Monitoring
Track income, expenses, investments, debt, and savings in one centralized dashboard. Get a clear view of your financial health at any given time.
✅ Improve Budgeting & Saving
By comparing budgeted vs. actual spending, you can easily identify areas where you can save more or adjust your financial strategy.
✅ Manage Investments Smarter
Track the performance of your investments and understand how they are contributing to your overall financial growth.
✅ Track Debt & Make Smarter Decisions
Efficiently manage your debts, track repayment progress, and adjust your strategies to minimize debt over time.
✅ Customizable for All Financial Needs
Whether you’re a personal finance enthusiast, a small business owner, or a financial planner, the dashboard is flexible and can be adjusted to suit your financial planning needs.
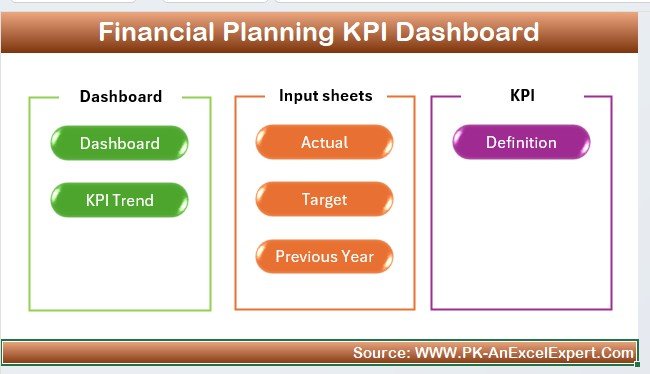
What’s Inside the Financial Planning KPI Dashboard in Excel?
-
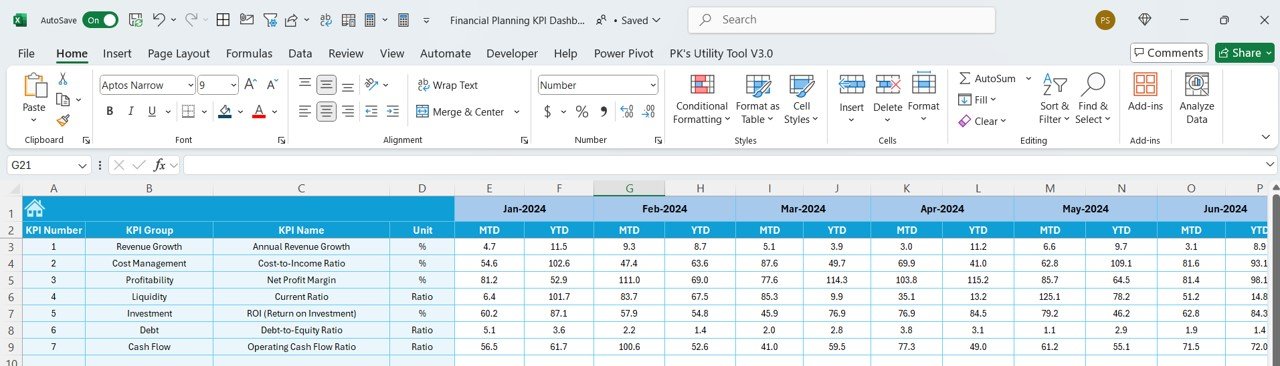
Income & Expense Tracking: Monitor your monthly income and expenses with ease.
-
Budgeting & Spending Analysis: Compare planned budgets to actual spending for smarter financial decisions.
-
Investment & Asset Management: Track and analyze your investment performance over time.
-
Debt Management: Stay on top of your debts and repayment schedules.
-
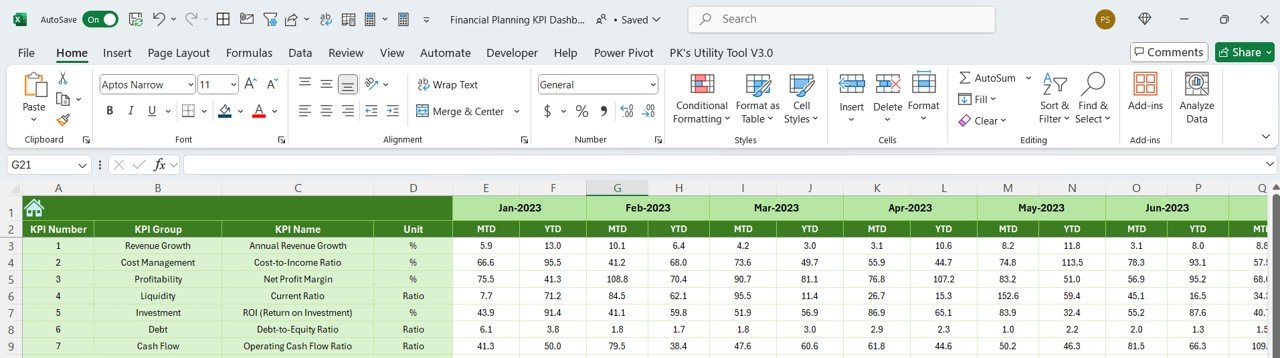
Time-Based Financial Tracking: Analyze your financial progress over time.
-
Customizable Features: Adjust the dashboard according to your unique financial goals.
How to Use the Financial Planning KPI Dashboard in Excel
1️⃣ Download the Template: Instantly get the Financial Planning KPI Dashboard in Excel.
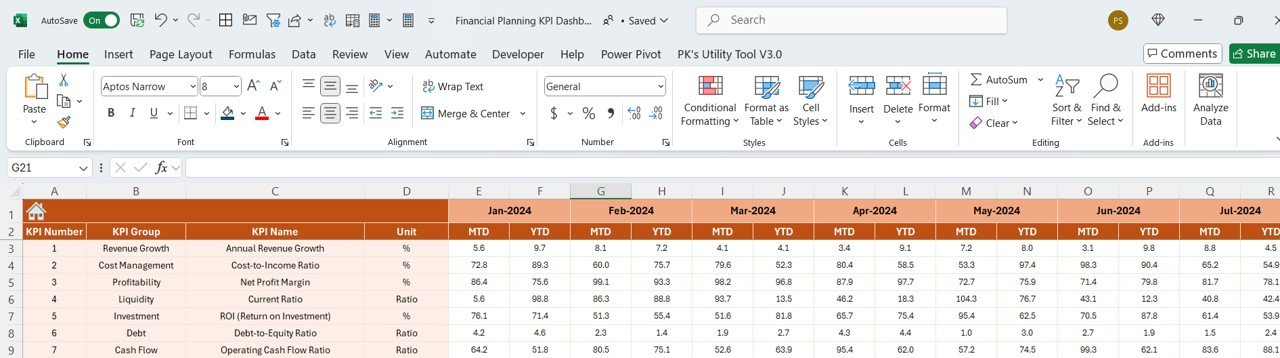
2️⃣ Input Your Financial Data: Add your income, expenses, debt, and investment details to the dashboard.
3️⃣ Track KPIs & Performance: Monitor key financial metrics such as income, savings, investments, and debt.
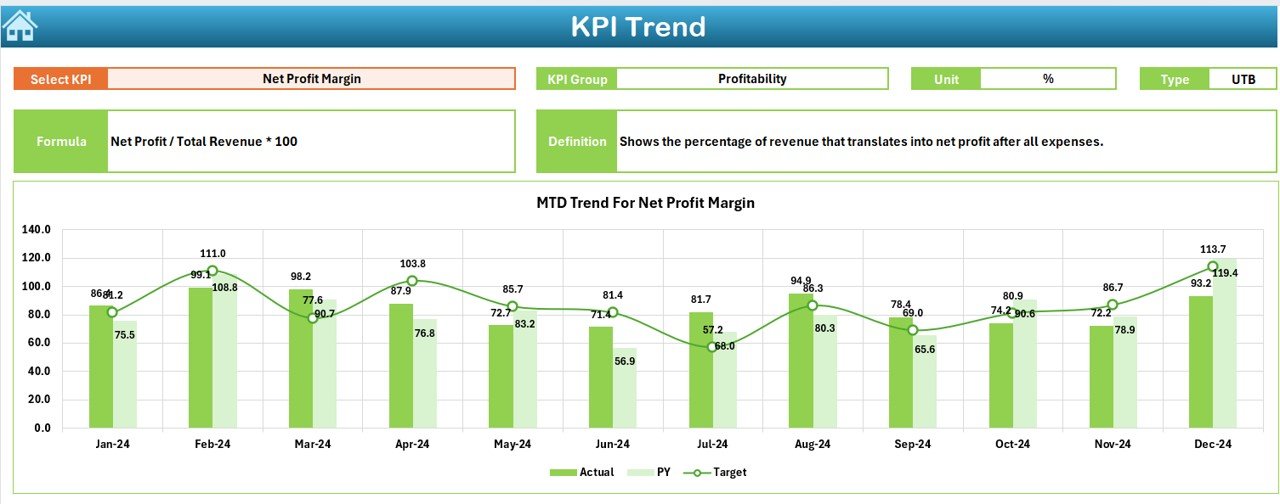
4️⃣ Analyze Financial Trends: Use time-based analysis to assess your financial progress and trends.
5️⃣ Make Informed Financial Decisions: Use the insights to make smarter decisions about budgeting, saving, investing, and debt management.
Who Can Benefit from the Financial Planning KPI Dashboard in Excel?
🔹 Individuals & Families
🔹 Financial Planners & Advisors
🔹 Small Business Owners
🔹 Entrepreneurs
🔹 Personal Finance Enthusiasts
🔹 Investment Analysts
🔹 Financial Institutions & Firms
Take control of your finances with the Financial Planning KPI Dashboard in Excel. Track your income, expenses, savings, investments, and debt to make better financial decisions and achieve your financial goals.
Click here to read the Detailed blog post
Visit our YouTube channel to learn step-by-step video tutorials
Youtube.com/@PKAnExcelExpert


Reviews
There are no reviews yet.