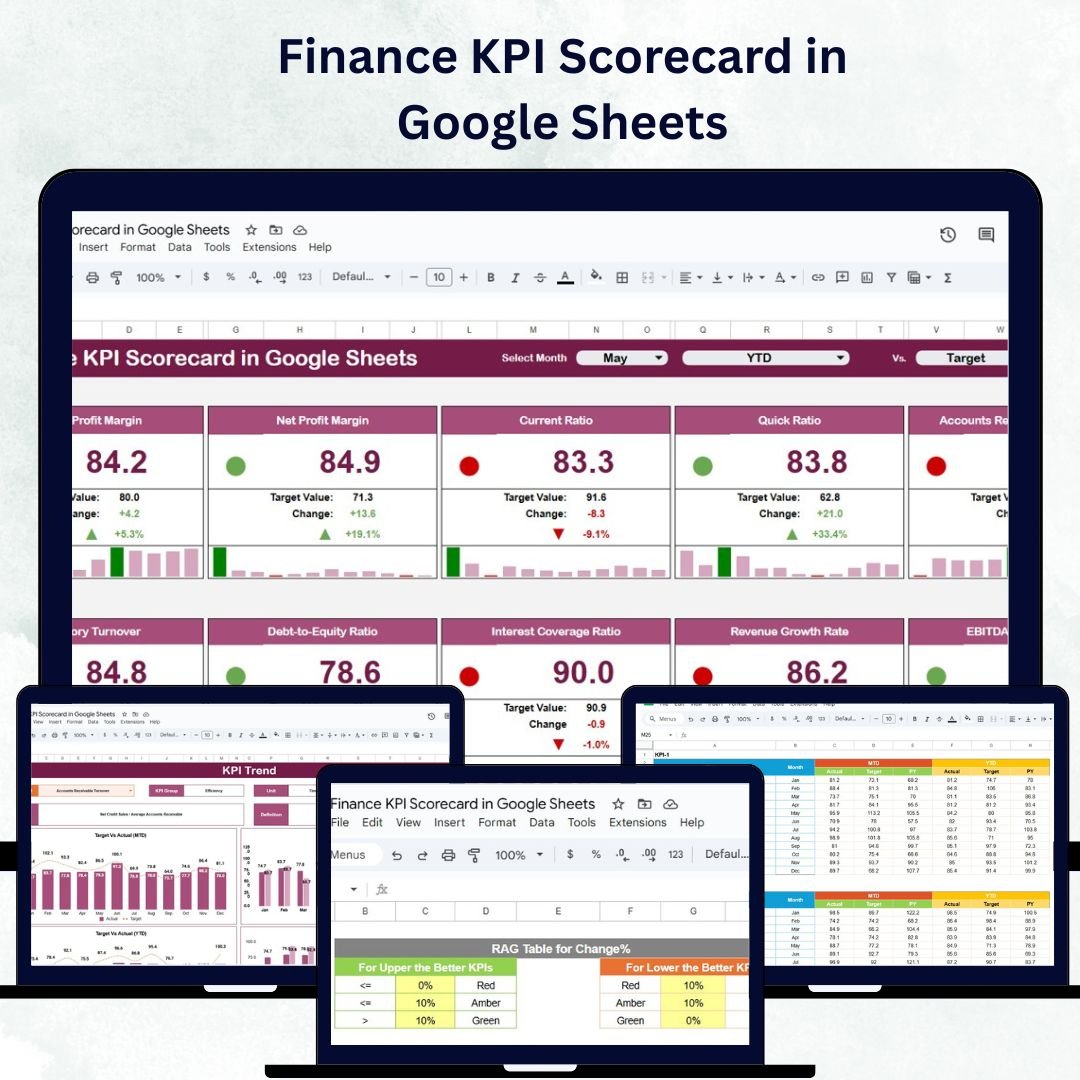

In today’s fast-paced business world, financial transparency and performance tracking are key to sustained success. The Finance KPI Scorecard in Google Sheets offers a ready-to-use, interactive solution that allows finance teams and business leaders to monitor, analyze, and visualize critical financial metrics — all in one centralized dashboard.
This scorecard is built entirely in Google Sheets, ensuring collaboration, accessibility, and automation for financial reporting. It helps organizations evaluate revenue, profitability, expenses, and liquidity with real-time data visualization, making financial management simple, insightful, and efficient. 💼📈
🔑 Key Features of the Finance KPI Scorecard in Google Sheets
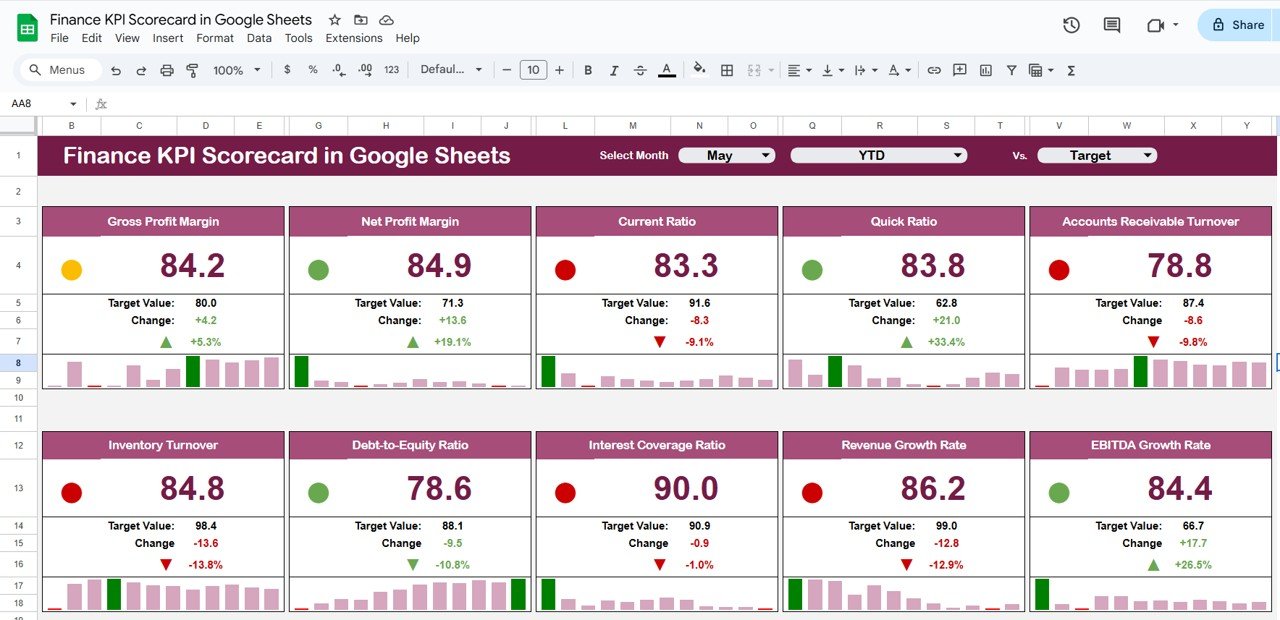
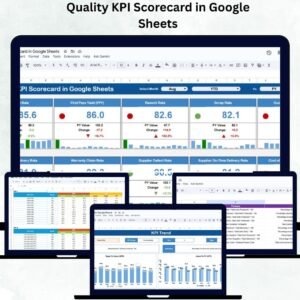
📊 Scorecard Overview Sheet
Get a snapshot of your organization’s financial health with dynamic visuals and intuitive indicators:
-
Month Dropdown: Choose any month to view financial performance instantly
-
MTD & YTD Views: Toggle between Month-to-Date and Year-to-Date results
-
Traffic Lights & Arrows: Visual cues instantly show whether KPIs are improving or declining
-
Key Metrics Tracked: Revenue, Net Profit, Expenses, Cash Flow, Profit Margin, and more
-
Performance Summary: Understand financial standing at a glance with clear color-coded indicators
This sheet provides a bird’s-eye view of company finances and enables fast decision-making.
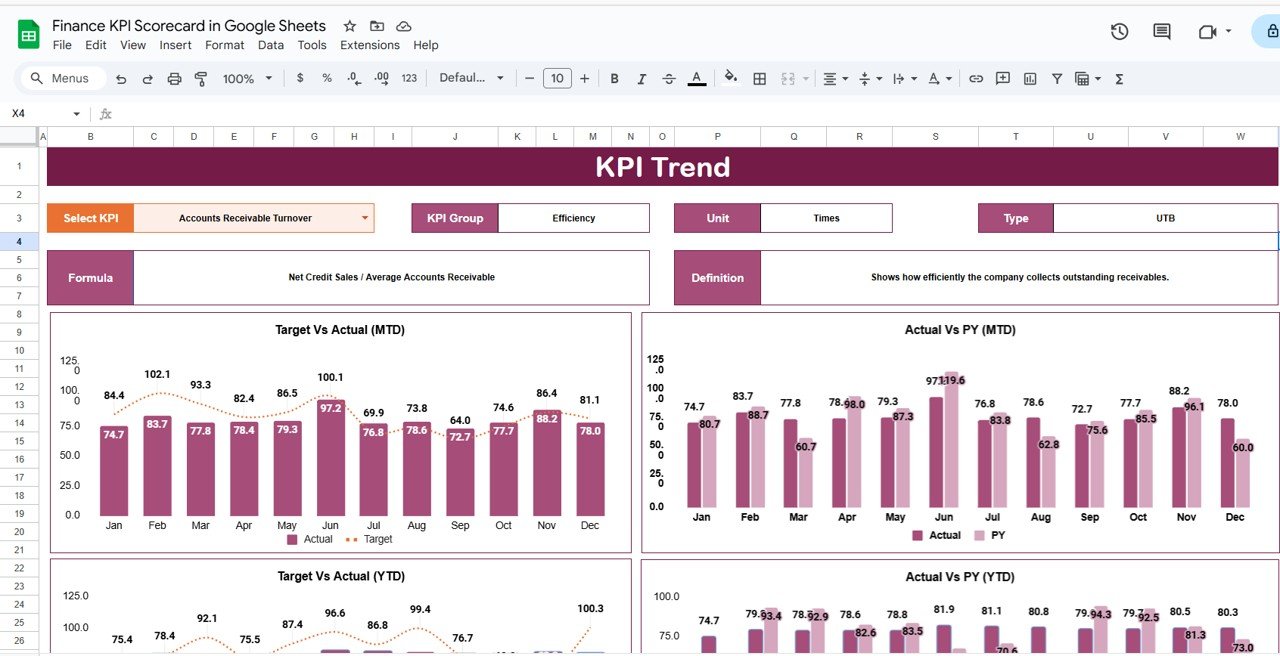
📈 Trend Sheet Tab
Dive deeper into financial performance trends over time:
-
KPI Selection (Range C3): Select any financial KPI to analyze
-
View KPI Group, Unit, and Type (UTB/LTB): Understand whether higher or lower is better
-
Visual Charts: Line graphs and trend visuals for both MTD and YTD comparisons
-
Identify Patterns: Spot seasonal performance, trends, and financial irregularities
Perfect for finance leaders seeking in-depth analytics and trend visualization.
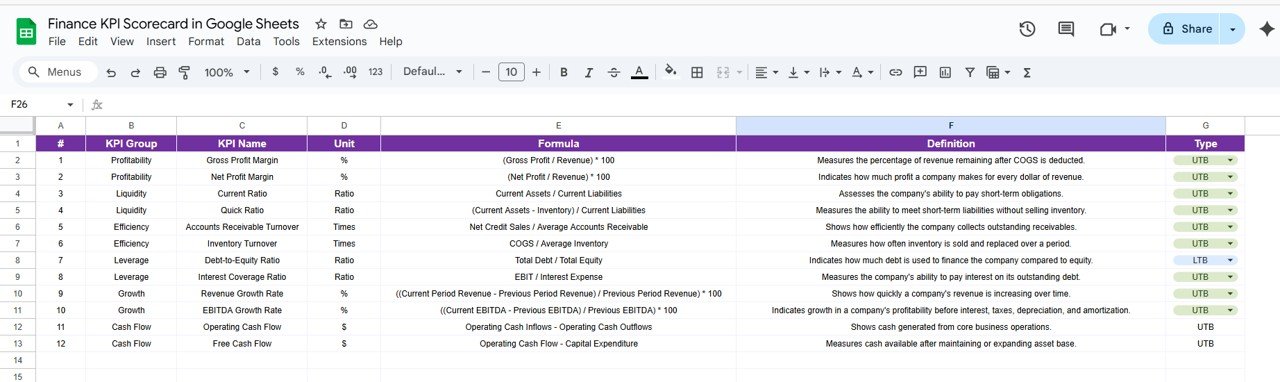
📘 KPI Definition Sheet Tab
Maintain clarity across teams with a standardized KPI reference:
-
KPI Name, Group, Unit, Formula, and Definition clearly documented
-
Specifies Upper-the-Better (UTB) or Lower-the-Better (LTB) type
-
Ensures transparency and consistency in financial analysis
This acts as the dictionary of your financial metrics, aligning all departments.
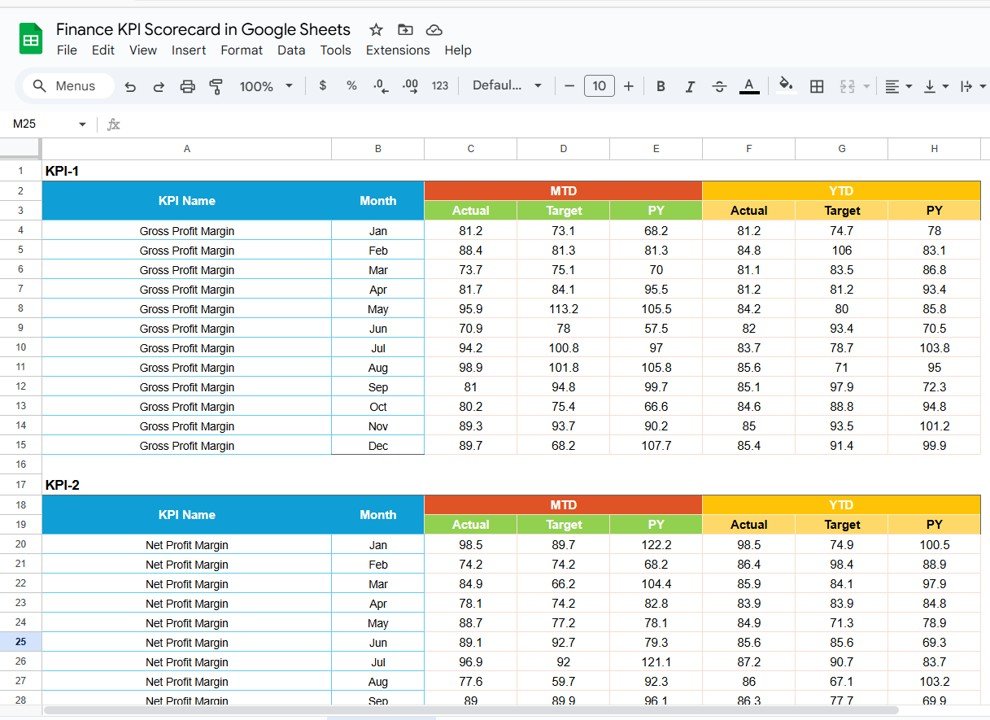
🧾 Data Input Sheet Tab
Centralize your financial data entry:
-
Record monthly and yearly Actual values for all KPIs
-
Update anytime — the dashboard auto-refreshes instantly
-
Supports department-level or multi-unit reporting
This tab forms the foundation for accurate and automated reporting.
🎨 Color Settings Sheet Tab
Personalize your visuals:
-
Modify traffic light colors and arrow indicators
-
Highlight MTD vs YTD performance visually
-
Customize the look and feel to align with your organization’s theme
💡 Advantages of Using the Finance KPI Scorecard
✅ Centralized Financial Tracking: Consolidate all performance metrics in one place
📈 Real-Time Insights: Automatically updates as new financial data is entered
📊 Trend Analysis: Monitor MTD, YTD, and YoY performance
🎯 Visual Performance Indicators: Traffic lights and arrows simplify complex data
🧠 Data-Driven Decisions: Identify performance gaps and make informed choices
⚙️ Customizable Template: Add new KPIs or modify formulas easily
👥 Collaborative Access: Multiple users can edit in real-time via Google Sheets
This tool transforms manual reporting into a dynamic financial intelligence system that’s accessible anytime, anywhere.
🧠 Best Practices for Using the Finance KPI Scorecard
-
Update Data Promptly: Record Actual values monthly for accuracy
-
Focus on Critical KPIs: Prioritize metrics like Cash Flow, Profit Margin, and ROI
-
Leverage Conditional Formatting: Use traffic lights to visualize results
-
Monitor MTD & YTD Trends: Identify growth patterns and seasonal performance
-
Customize Definitions: Align KPIs with company-specific financial goals
-
Segment by Department: Analyze results by division, location, or business unit
💼 How This Scorecard Helps Finance Teams
-
Track Financial Health: Evaluate profitability, liquidity, and efficiency in real-time
-
Identify Bottlenecks: Pinpoint areas with overspending or declining performance
-
Improve Reporting: Replace manual spreadsheets with automated visual dashboards
-
Support Strategic Decisions: Provide leadership with actionable financial insights
-
Enhance Accountability: Assign KPI responsibility to finance or departmental heads
By combining clarity, automation, and collaboration, this scorecard empowers finance teams to stay on top of every financial movement with precision and confidence. 🚀


Reviews
There are no reviews yet.