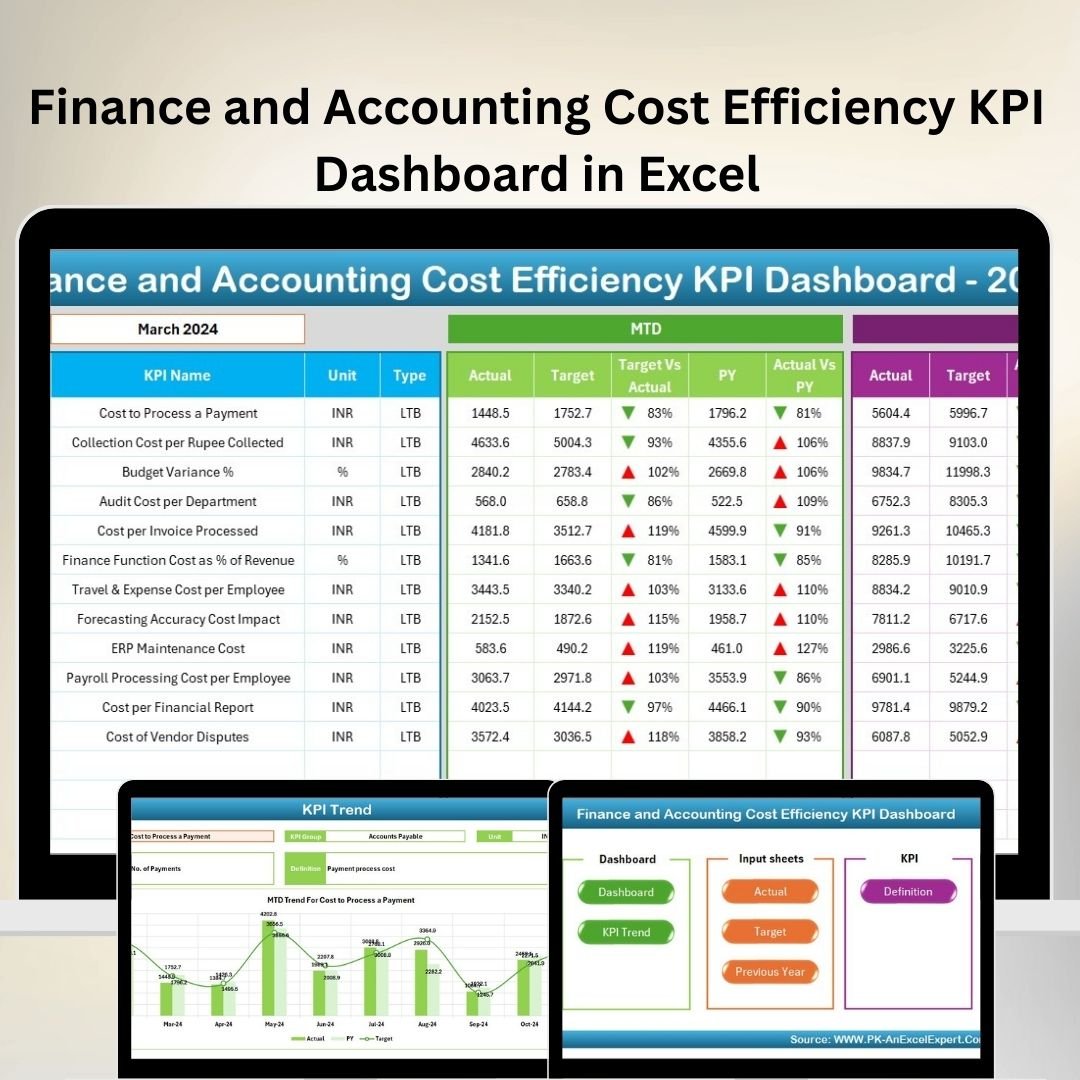


The Finance and Accounting Cost Efficiency KPI Dashboard in Excel is an essential tool for finance professionals, accountants, and business managers to track and optimize the cost efficiency of their financial operations. This Excel-based dashboard allows you to monitor key performance indicators (KPIs) such as cost-to-revenue ratio, operating expenses, profitability, and more, giving you a comprehensive view of your organization’s financial health.
With real-time insights into cost management and financial performance, this dashboard helps you identify areas where you can reduce expenses, improve profitability, and increase overall efficiency. Whether you’re managing operational costs, analyzing departmental expenses, or optimizing budget allocation, this tool is designed to streamline the financial analysis process and improve decision-making.
Key Features of the Finance and Accounting Cost Efficiency KPI Dashboard in Excel
📊 Cost-to-Revenue Ratio Monitoring
Track the cost-to-revenue ratio to ensure that your operating costs are aligned with revenue generation. This KPI helps you identify areas where costs can be reduced without sacrificing operational efficiency.
📈 Operating Expenses Tracking
Monitor your operating expenses across different departments and functions. Use this data to analyze and control costs, identify budget overruns, and optimize resource allocation.
💡 Profitability Analysis
Track profitability metrics such as gross profit margin, net profit margin, and return on investment (ROI) to assess your business’s financial health and identify opportunities for improvement.
📅 Budget vs Actual Analysis
Compare your actual expenses against your budgeted amounts to identify discrepancies. This analysis helps you maintain financial control and make adjustments to future budgets based on historical data.
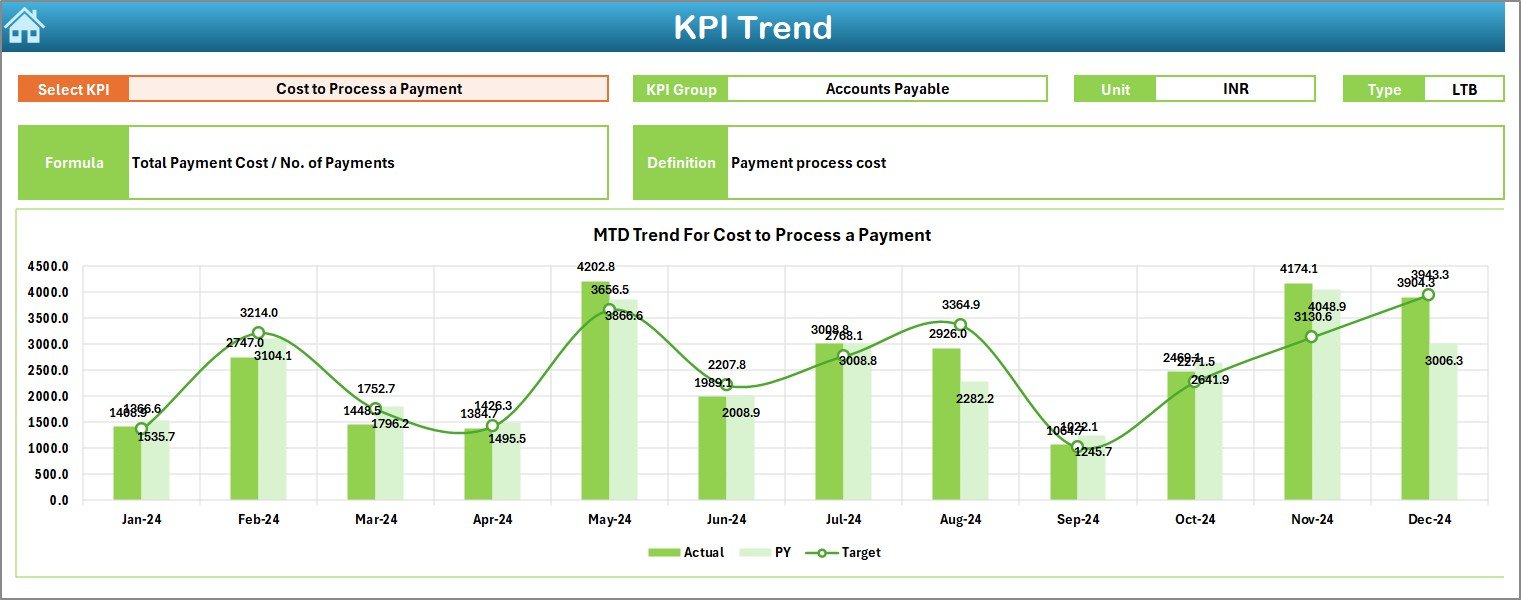
⚙️ Time-Based Financial Performance Tracking
Track cost efficiency and financial performance over different time periods (daily, monthly, quarterly). Analyze trends and understand how your cost management strategies are evolving over time.
🔑 Customizable KPIs & Metrics
Tailor the dashboard to track the KPIs most relevant to your business. Whether you’re focused on specific cost areas, revenue streams, or departments, you can easily adjust the dashboard to match your financial goals.
Why You’ll Love the Finance and Accounting Cost Efficiency KPI Dashboard in Excel
✅ Comprehensive Financial Insights
Gain a clear understanding of your financial performance with KPIs that cover cost efficiency, profitability, and budget management. Make informed decisions that optimize your financial operations.
✅ Improve Cost Management
Track and manage costs more effectively with real-time insights into operating expenses and cost-to-revenue ratios. Identify areas to cut costs and improve financial efficiency.
✅ Enhance Profitability
Track profitability metrics and identify opportunities to improve profit margins. Focus on key areas of your business that directly impact profitability and ensure long-term financial success.
✅ Maintain Financial Control
Use budget vs actual analysis to keep track of your finances and make necessary adjustments in real-time. Prevent overspending and ensure that your financial goals are being met.
✅ Customizable & Scalable
This dashboard is highly customizable, allowing you to tailor it to the specific needs of your finance department, whether you’re a small business or a large corporation with complex financial operations.
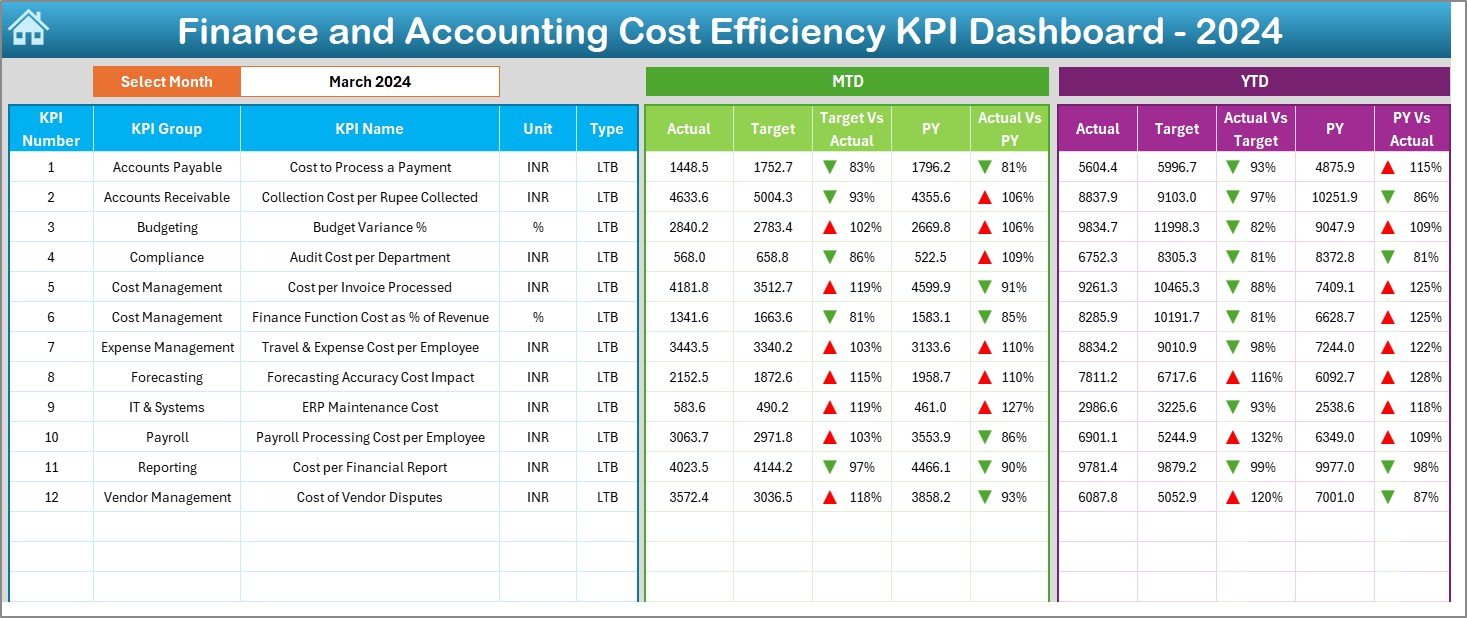
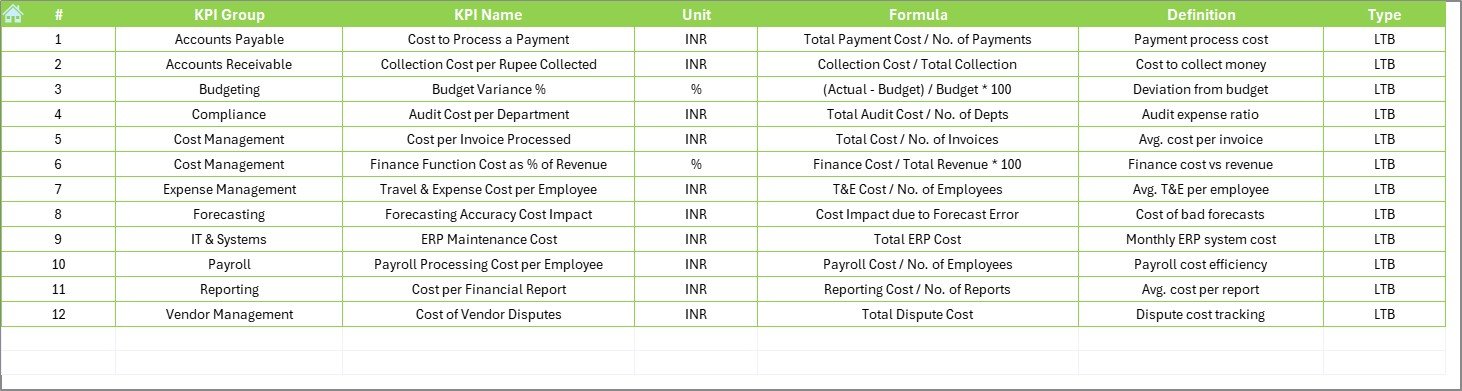
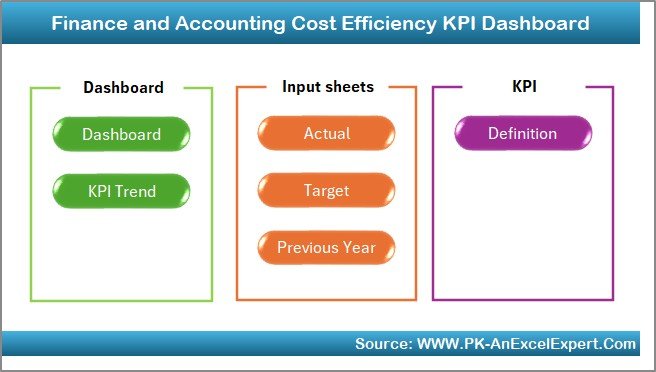
What’s Inside the Finance and Accounting Cost Efficiency KPI Dashboard in Excel?
-
Cost-to-Revenue Ratio: Monitor the cost-to-revenue ratio and adjust operations accordingly.
-
Operating Expenses Tracking: Track and manage operating expenses across departments.
-
Profitability Metrics: Analyze profitability through gross margin, net margin, and ROI.
-
Budget vs Actual Analysis: Compare actual expenses to the budget to identify discrepancies.
-
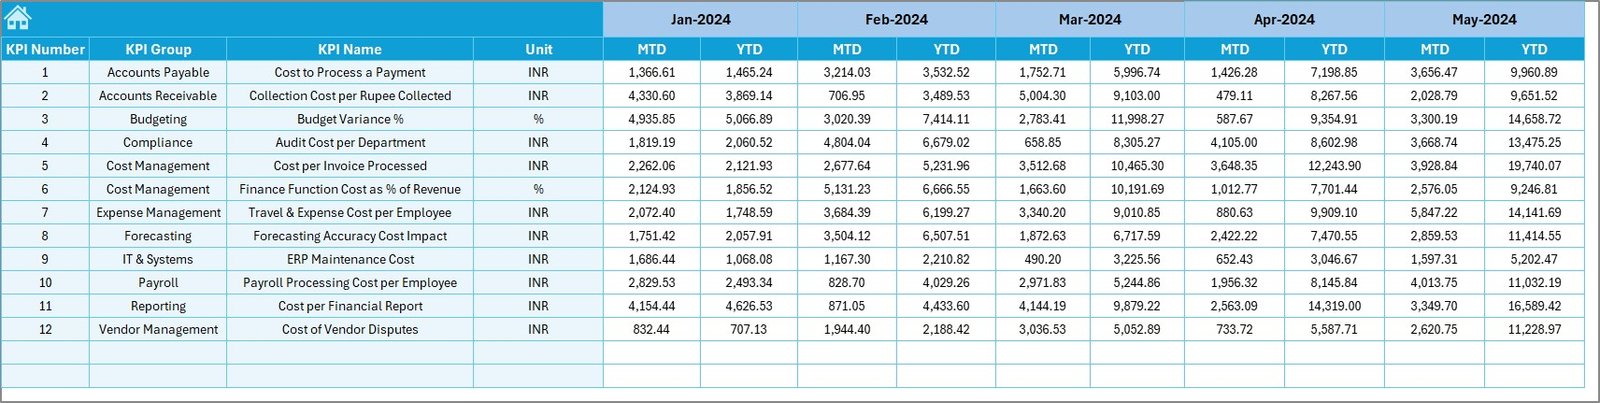
Time-Based Analysis: Track financial performance over time and identify trends.
-
Customizable KPIs: Adjust the dashboard to reflect your financial management goals.
How to Use the Finance and Accounting Cost Efficiency KPI Dashboard in Excel
1️⃣ Download the Template: Access the Finance and Accounting Cost Efficiency KPI Dashboard in Excel instantly.
2️⃣ Input Financial Data: Enter data such as revenue, operating expenses, and profit margins.
3️⃣ Monitor KPIs & Performance: Track key metrics such as cost-to-revenue ratio, profitability, and operating expenses.
4️⃣ Analyze Data & Trends: Use time-based analysis to identify financial trends and optimize cost management.
5️⃣ Optimize Financial Efficiency: Use insights from the dashboard to reduce costs, improve profitability, and enhance financial efficiency.
Who Can Benefit from the Finance and Accounting Cost Efficiency KPI Dashboard in Excel?
🔹 CFOs & Finance Managers
🔹 Accounting Teams & Departments
🔹 Business Owners & Entrepreneurs
🔹 Small & Medium Enterprises (SMBs)
🔹 Large Corporations & Enterprises
🔹 Financial Consultants & Advisors
🔹 Budget Analysts & Cost Management Professionals
Optimize your financial operations with the Finance and Accounting Cost Efficiency KPI Dashboard in Excel. Track key metrics, improve cost management, and make data-driven decisions that increase profitability and streamline your financial processes.
Click here to read the Detailed blog post
Visit our YouTube channel to learn step-by-step video tutorials
Youtube.com/@PKAnExcelExpert


Reviews
There are no reviews yet.