Managing and tracking business expenses is crucial for effective financial planning and decision-making. The Expense Tracking Dashboard in Power BI offers a dynamic, interactive, and visually engaging solution to monitor, analyze, and optimize business expenses across various departments, categories, vendors, and projects. This dashboard simplifies financial data into meaningful insights, enabling users to make data-driven decisions with ease.
🌟 Why Choose the Power BI Expense Tracking Dashboard?
This Power BI-based dashboard provides a comprehensive financial overview with real-time analytics, making expense management faster, smarter, and more efficient. Whether you’re a finance professional, business manager, or decision-maker, this tool helps you track spending patterns, identify cost-saving opportunities, and streamline budgeting efforts.
📌 Key Features of the Expense Tracking Dashboard:
1️⃣ Overview Page – Your Financial Summary at a Glance
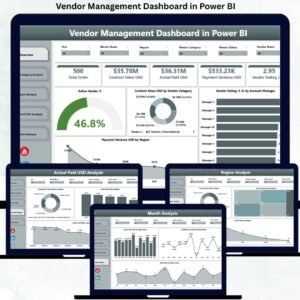
The Overview page acts as the central hub, providing a quick snapshot of:
- Current Year (CY) vs Previous Year (PY) Expenses – Understand expense trends over time.
- Expense Variance Analysis – Track the difference between CY & PY expenses with percentage change insights.
- Expense Breakdown by Department & Project – View spending across teams and projects.
- Dynamic Filtering – Filter data by year, month, department, category, and payment method for tailored insights.
2️⃣ Expense Trend Analysis – Understand Your Spending Patterns
Tracking expense trends is critical for effective financial management. This page helps users:
- Visualize Monthly Expense Trends – Compare CY vs PY expenses using interactive line charts.
- Monitor Weekly Expense Distribution – Identify cost fluctuations over time.
- Analyze Expenses by Payment Method – Track payments via credit card, PayPal, bank transfers, or cash.
- Spot Expense Spikes & Outliers – Find irregularities and opportunities for cost control.
3️⃣ Department & Employee Analysis – Gain Deeper Insights into Spending
This page provides detailed visibility into department-wise and employee-wise expenses:
- Departmental Expense Breakdown – Monitor spending across Marketing, IT, Sales, HR, Finance, and Operations.
- Employee-wise Expense Report – Identify high-spending employees & optimize resource allocation.
- Expense Category Segmentation – Understand where the money goes across different spending categories.
This section is particularly helpful for HR & Finance teams to track individual expenditures and overall department budgets.
4️⃣ Category & Vendor Analysis – Optimize Business Expenditure
Vendor and category analysis allows organizations to manage supplier relationships and reduce unnecessary spending. Key features include:
- Expense Comparison by Category – Identify major spending categories like Software, Travel, Food, Office Supplies, and Utilities.
- Top Vendor Expense Report – Track vendor-based expenses with comparisons between Amazon, Apple, Local Café, Office Depot, and more.
- Enhanced Budgeting & Cost Control – Recognize high-cost vendors and negotiate better pricing.
With vendor & category insights, businesses can strategically allocate funds and cut down unnecessary costs.
⚡ Benefits of Using This Power BI Expense Dashboard
✅ Real-time Expense Tracking – Stay updated with live data and interactive visuals.
✅ Automated Financial Reports – Save hours by eliminating manual tracking.
✅ Better Decision-Making – Identify cost-saving opportunities with accurate insights.
✅ Customizable Filters & Slicers – Drill down into specific departments, months, or vendors.
✅ Increased Financial Transparency – Gain clear visibility into spending patterns and vendor relationships.
✅ Professional Data Visualization – Transform raw financial data into interactive charts & graphs.
📥 Who Can Benefit from This Dashboard?
This Power BI Expense Tracking Dashboard is perfect for:
✔ Business Owners & CEOs – Monitor expenses and optimize financial planning.
✔ Finance Managers & CFOs – Get deeper insights into spending trends and variances.
✔ HR & Department Heads – Track departmental budgets and employee-related expenses.
✔ Project Managers – Control costs for different projects and reduce budget overruns.
✔ Accountants & Analysts – Automate expense reporting and analysis.
🚀 Get Started with Smarter Expense Tracking Today!
With the Expense Tracking Dashboard in Power BI, managing your business finances has never been easier. This all-in-one analytics tool provides deep insights, real-time tracking, and dynamic filtering, helping you make faster, smarter, and more informed financial decisions.
Click here to read the detailed blog post
Visit our YouTube channel to learn step-by-step video tutorials
Watch the step-by-step video tutorial:
Also check our Procurement Dashboard in Power BI


Reviews
There are no reviews yet.