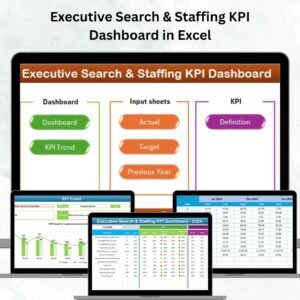
Executive Search & Staffing KPI Dashboard in Excel in today’s fast-paced recruitment landscape, staying ahead in executive search and staffing requires more than intuition — it requires data-driven precision. 💼📊
The Executive Search & Staffing KPI Dashboard in Excel is a ready-to-use performance monitoring tool designed to help recruiters, HR leaders, and staffing agencies track, measure, and visualize key performance indicators across all stages of the hiring process.
This all-in-one Excel dashboard eliminates the hassle of juggling multiple spreadsheets. It empowers your team to focus on what truly matters — filling roles faster, improving candidate quality, reducing costs, and increasing client satisfaction.
⚙️ Key Features of the Executive Search & Staffing KPI Dashboard
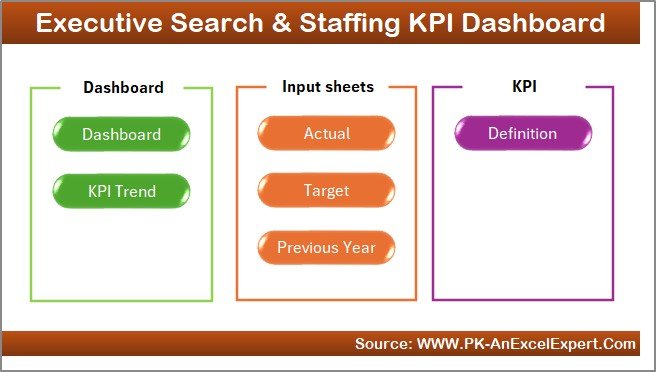
📊 Seven Well-Structured Worksheets:
-
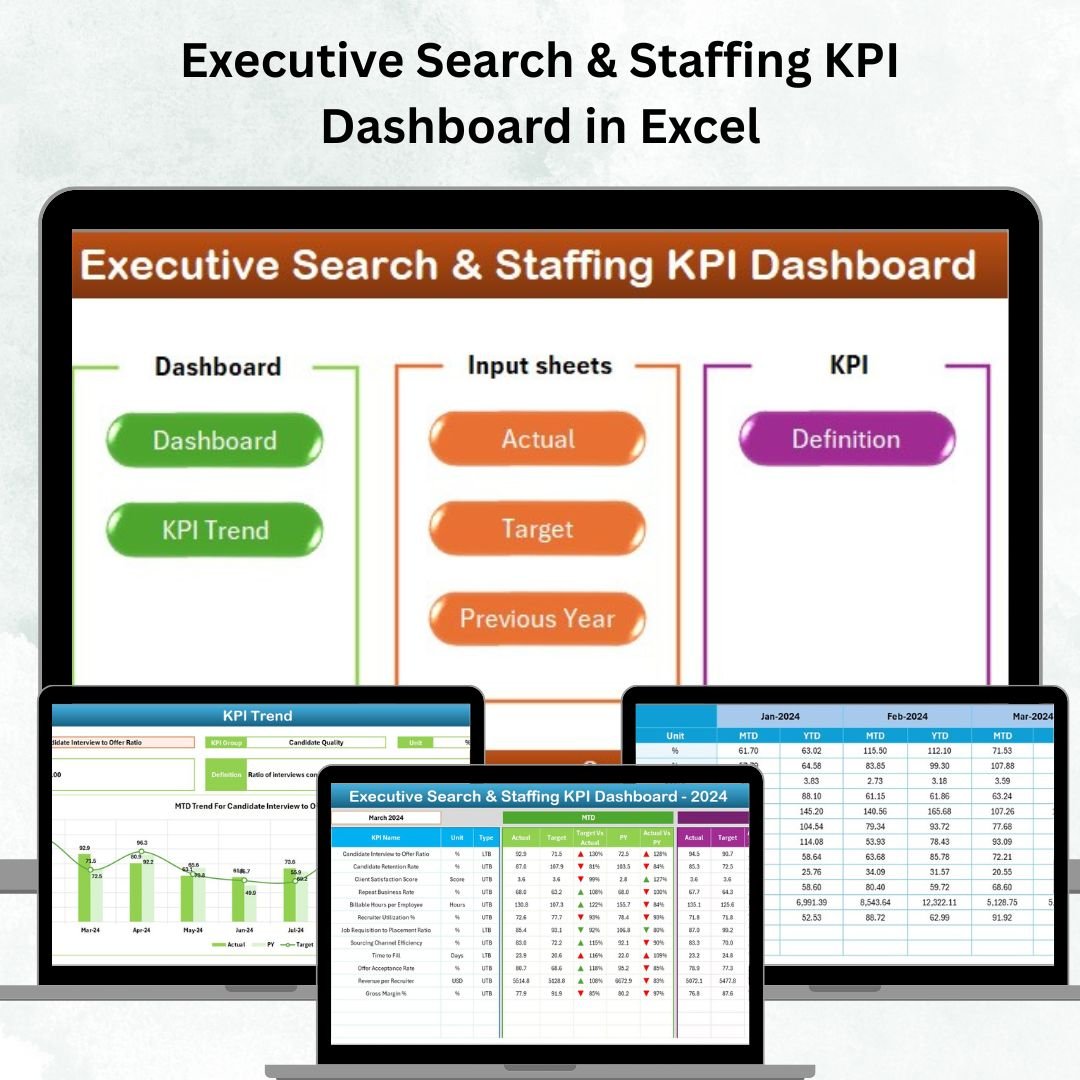
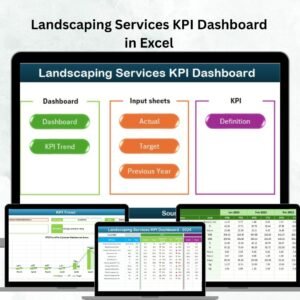
Home Sheet: Your central navigation hub with six quick-access buttons for Dashboard, KPI Trend, Actual Numbers, Target, Previous Year, and KPI Definition.
-
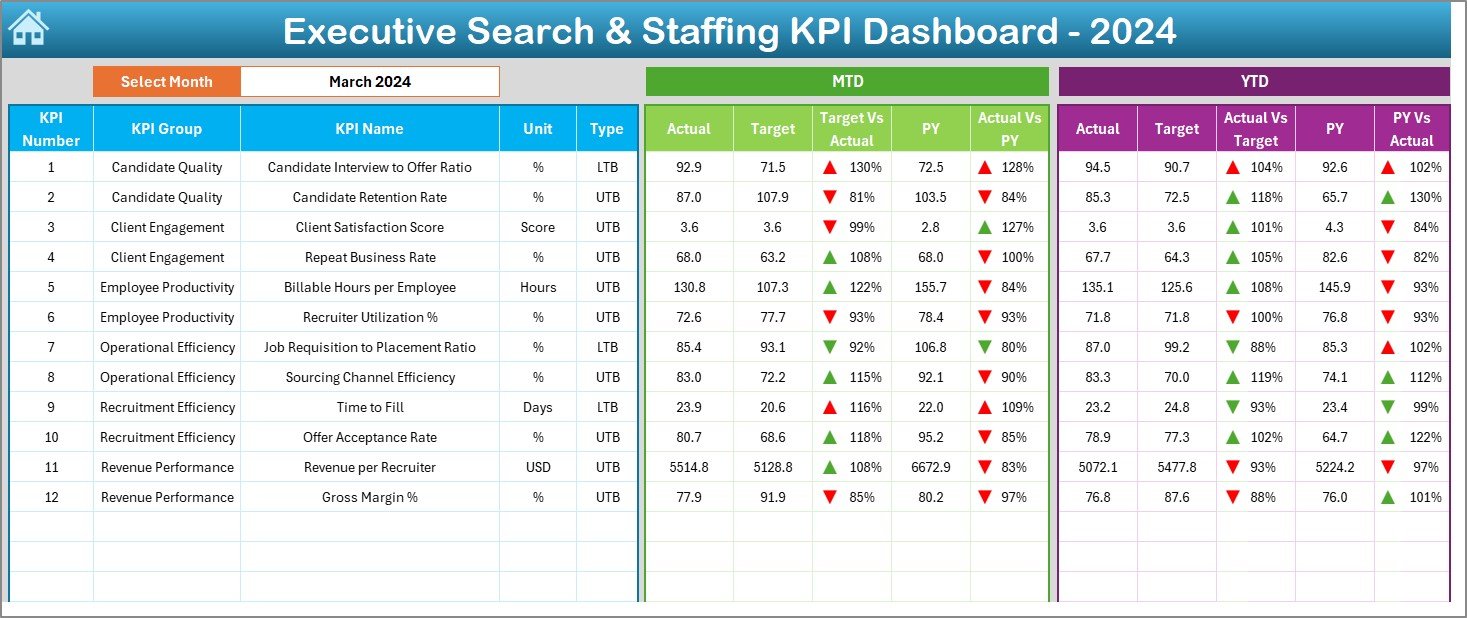
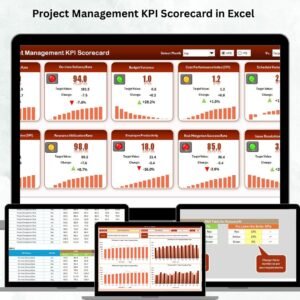
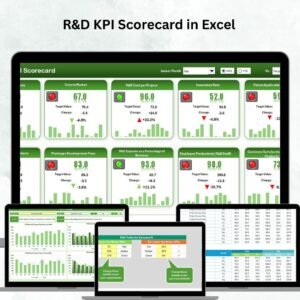
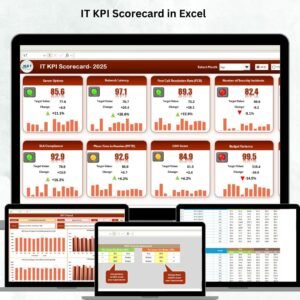
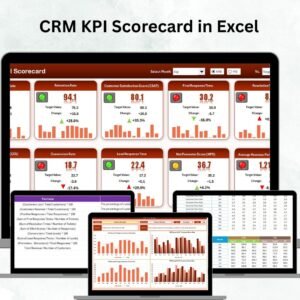
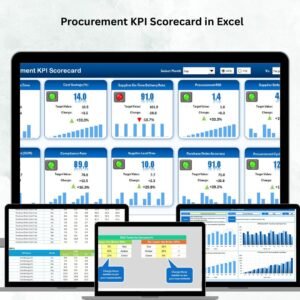
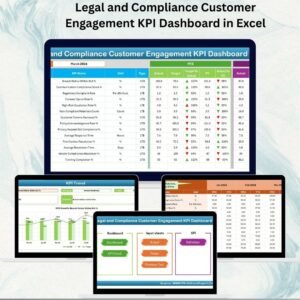
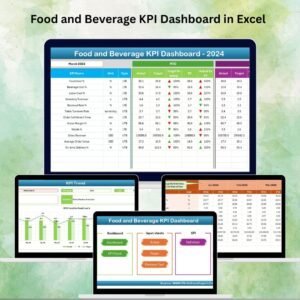
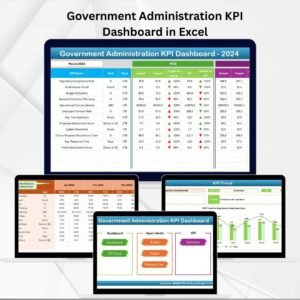
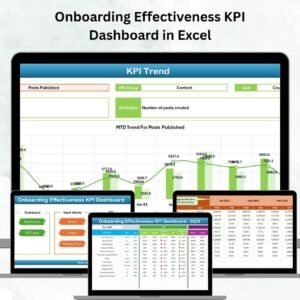
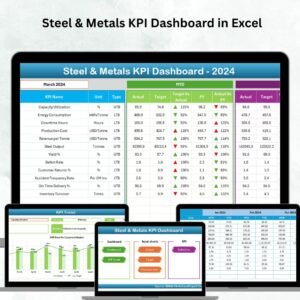
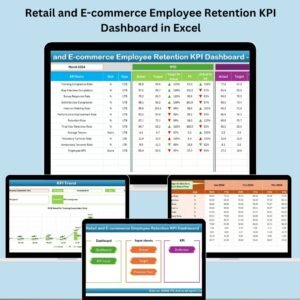
Dashboard Sheet: Displays all major recruitment KPIs using dynamic visuals, summary cards, and conditional formatting.
-
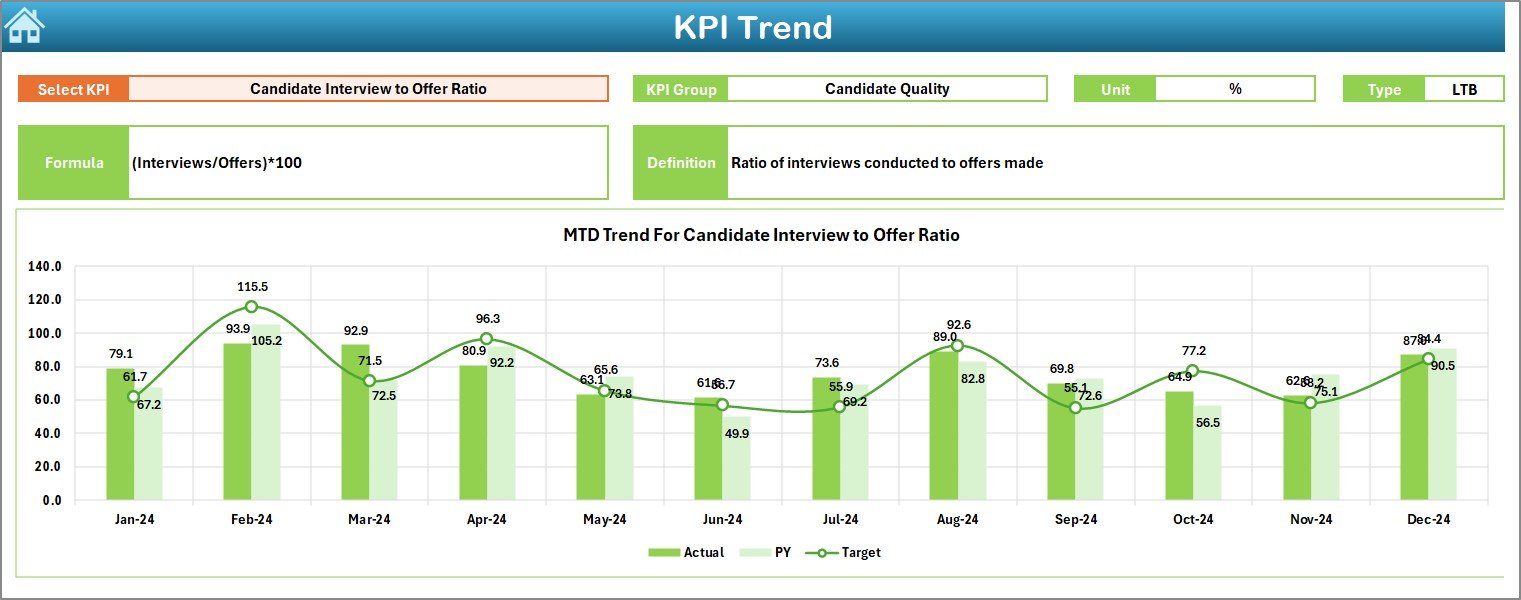
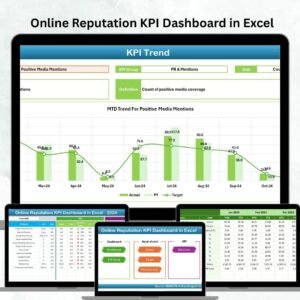
KPI Trend Sheet: Enables month-wise analysis and comparison between Actual, Target, and Previous Year data.
-
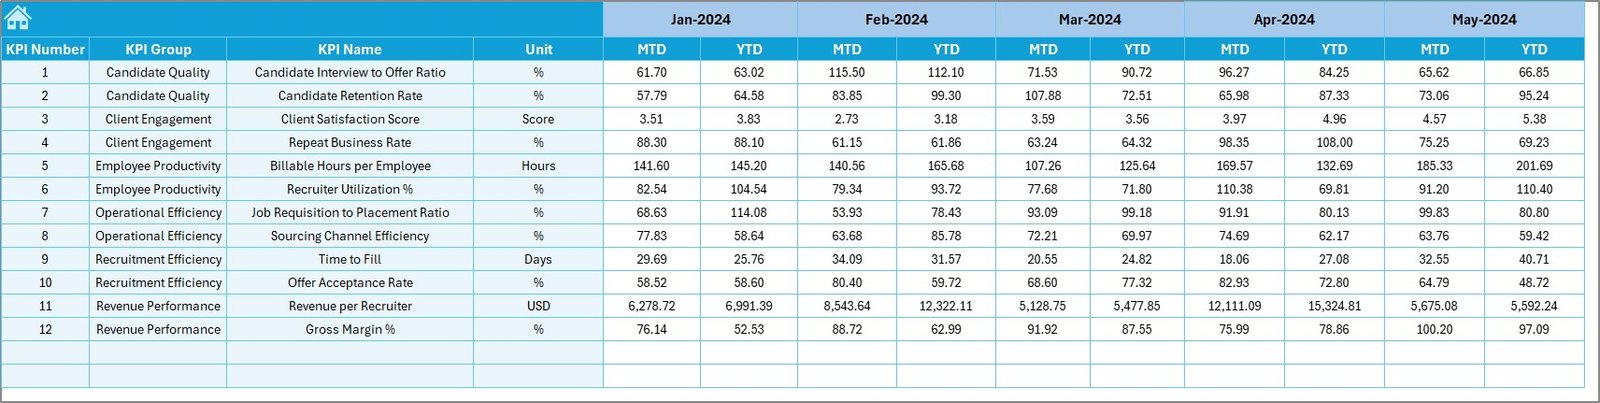
Actual Numbers Input Sheet: Input real-time recruitment data effortlessly and let the dashboard update automatically.
-
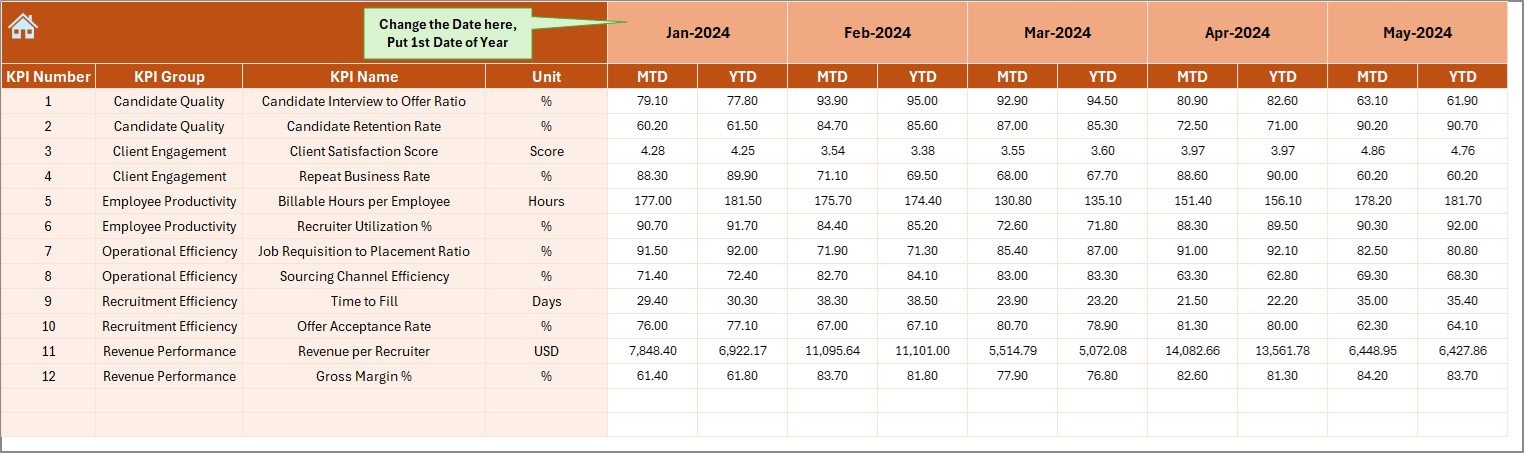
Target Sheet: Define your hiring goals and track progress toward MTD and YTD targets.
-
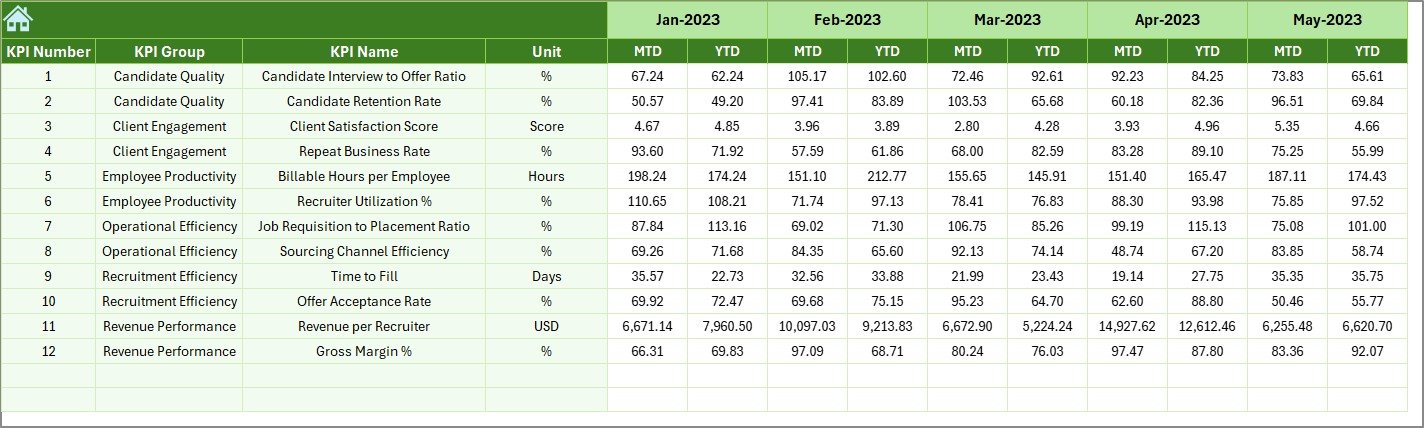
Previous Year Data Sheet: Benchmark current performance against past results to measure growth.
-
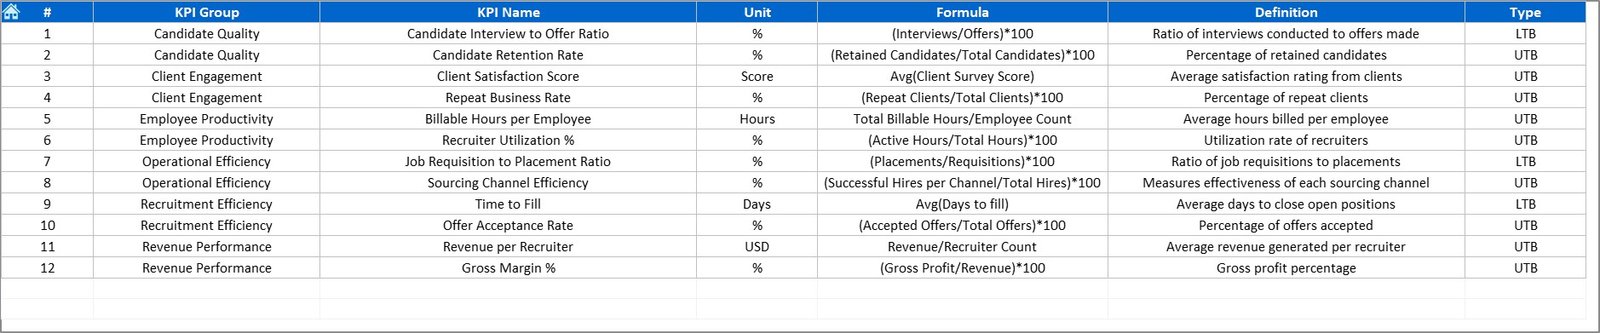
KPI Definition Sheet: Store KPI names, formulas, and definitions for clarity and consistency.
🎯 Dynamic Controls:
Choose your desired month from the drop-down (cell D3) and watch the entire dashboard update instantly.
📈 Real-Time Insights:
View Month-to-Date (MTD) and Year-to-Date (YTD) comparisons across Actual, Target, and Previous Year data.
🎨 Interactive Visuals:
Conditional formatting arrows (green for progress, red for decline) provide an instant view of performance trends.
🧭 Fully Customizable:
Add, remove, or modify KPIs, update team or region names, and adjust charts as your recruitment goals evolve.
📂 What’s Inside the Executive Search & Staffing KPI Dashboard
✨ Home Sheet:
Navigate effortlessly through the dashboard with user-friendly buttons. No more searching for tabs — get started immediately.
📊 Dashboard Sheet:
This is the analytical core of the workbook. It features:
-
KPI cards for metrics like Time to Hire, Fill Rate, Offer Acceptance Rate, and Client Satisfaction.
-
MTD and YTD visual comparisons.
-
Interactive graphs with color-coded insights.
📉 KPI Trend Sheet:
Drill deeper into individual metrics. Select any KPI from the drop-down (cell C3) to view performance trends and definitions.
🧾 Actual Numbers Input Sheet:
Record your monthly results in one place — Actuals, Targets, and Previous Year data update all dashboards automatically.
🎯 Target & Definition Sheets:
Maintain alignment and clarity with defined KPI targets, measurement units, and transparent formulas.
💡 How to Use the Executive Search & Staffing KPI Dashboard
1️⃣ Download & Open the template in Excel.
2️⃣ Explore the Home Page — use quick buttons for smooth navigation.
3️⃣ Enter Monthly Data in the Actual Numbers and Target sheets.
4️⃣ View Trends on the Dashboard and KPI Trend pages.
5️⃣ Compare Performance between months or years using built-in visuals.
6️⃣ Update Regularly to maintain accurate, up-to-date insights.
Within minutes, you’ll transform recruitment data into actionable intelligence. 🔍
👥 Who Can Benefit from This Dashboard
✅ Recruitment Agencies: Track consultant productivity, fill rates, and client satisfaction.
✅ Corporate HR Teams: Measure hiring efficiency and reduce time-to-fill.
✅ Talent Acquisition Leaders: Align strategic hiring goals with real-time metrics.
✅ Freelance Recruiters: Present professional data-driven reports to clients.
✅ Business Owners: Gain transparent insights into overall staffing performance.
🌟 Advantages of Executive Search & Staffing KPI Dashboard in Excel
-
📈 Data-Driven Decisions: Replace guesswork with real-time performance analytics.
-
⚡ Automated Updates: KPIs refresh automatically without manual recalculations.
-
🧭 Transparent Reporting: Improve accountability across teams and recruiters.
-
💼 Goal Alignment: Align recruitment performance with business objectives.
-
🕒 Save Time: Eliminate redundant data entry with smart formulas.
-
🧠 Insightful Visualization: Identify hiring bottlenecks and improvement areas instantly.
-
🎨 Customizable & Scalable: Suitable for individual recruiters or enterprise-level agencies.
-
💰 Cost-Effective: No subscription — one Excel file does it all!


Reviews
There are no reviews yet.