


The Environmental KPI Dashboard in Google Sheets is an essential tool for organizations aiming to track and improve their environmental performance. This customizable dashboard allows organizations to monitor key environmental metrics, such as energy consumption, water usage, waste management, and carbon emissions. By centralizing these key performance indicators (KPIs), the dashboard helps organizations make informed decisions and drive sustainable practices.
Using Google Sheets, this dashboard can be easily shared and updated in real-time, enabling collaboration among teams and providing up-to-date data for environmental management. The dashboard is designed to be flexible, adapting to different sustainability goals and performance metrics.
Key Features of the Environmental KPI Dashboard in Google Sheets

📋 Customizable Compliance Metrics
-
Tailored Environmental Categories: Customize the dashboard to reflect specific environmental requirements such as waste reduction, energy efficiency, water conservation, and emissions control.
-
Dynamic Data Entry: Easily input and update environmental data, ensuring that your dashboard is always current and aligned with your goals.
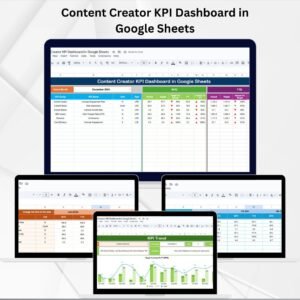
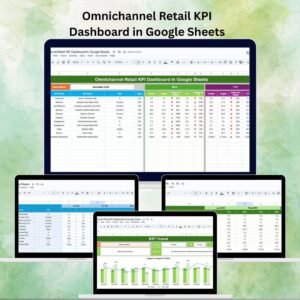
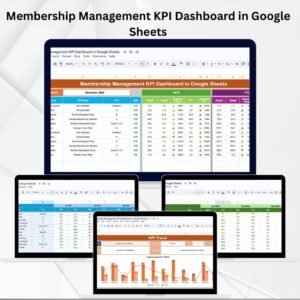
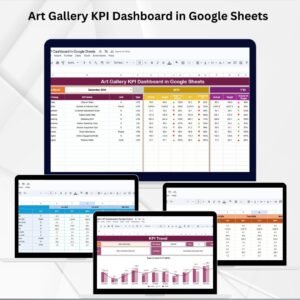
📊 Interactive Data Visualization
-
KPI Trend Tracking: Use various chart types such as bar, line, and pie charts to visualize trends in environmental data, helping identify areas that require attention.
-
Conditional Formatting: Highlight key performance areas using color-coded formatting to quickly identify areas where performance is exceeding or falling short of expectations.
💻 Real-Time Collaboration and Accessibility
-
Multi-User Collaboration: Share and update the dashboard with multiple team members in real-time, ensuring that everyone stays on track and informed.
-
Cloud-Based Access: Access the dashboard from any device with internet connectivity, providing flexibility for remote and on-site monitoring.
🛠 Automated Calculations and Reporting
-
Built-In Formulas: Use Google Sheets’ functions to automatically calculate key performance metrics such as total energy usage, water conservation, and waste diversion percentages, saving time and reducing errors.
-
Scheduled Reporting: Set up automated email notifications or reports to keep key stakeholders informed of progress toward environmental goals.
Benefits of Using Google Sheets for Environmental KPI Tracking
✅ Cost-Effective Solution
Google Sheets is a free tool that offers a robust set of features for tracking environmental performance, eliminating the need for expensive software.
✅ User-Friendly Interface
The simple and intuitive design of Google Sheets makes it easy for users with varying levels of expertise to use the dashboard effectively.
✅ Scalable and Flexible
As your organization’s environmental goals evolve or new sustainability metrics are introduced, the dashboard can easily be customized to accommodate new KPIs and data sources.
Getting Started with Your Environmental KPI Dashboard in Google Sheets
-
Define Environmental KPIs: Identify the key environmental metrics that matter most to your organization, such as energy consumption, waste management, carbon emissions, and water usage.
-
Set Up the Dashboard: Organize the dashboard with sections for data entry, KPI tracking, and visualizations, ensuring it is easy to navigate.
-
Input Data: Enter your environmental data, ensuring accuracy and consistency in how you track your performance.
-
Customize Features: Adjust the dashboard to reflect your organization’s sustainability goals, whether you are tracking energy reduction, emissions cuts, or water conservation.
-
Monitor and Update: Regularly review and update the dashboard to ensure it reflects the most up-to-date data and aligns with evolving environmental strategies.
By using the Environmental KPI Dashboard in Google Sheets, your organization can monitor its sustainability initiatives effectively, identify areas for improvement, and make data-driven decisions to enhance environmental performance.
Click here to read the Detailed blog post
Environmental KPI Dashboard in Google Sheets
Visit our YouTube channel to learn step-by-step video tutorials
YouTube.com/@PKAnExcelExpert


Reviews
There are no reviews yet.