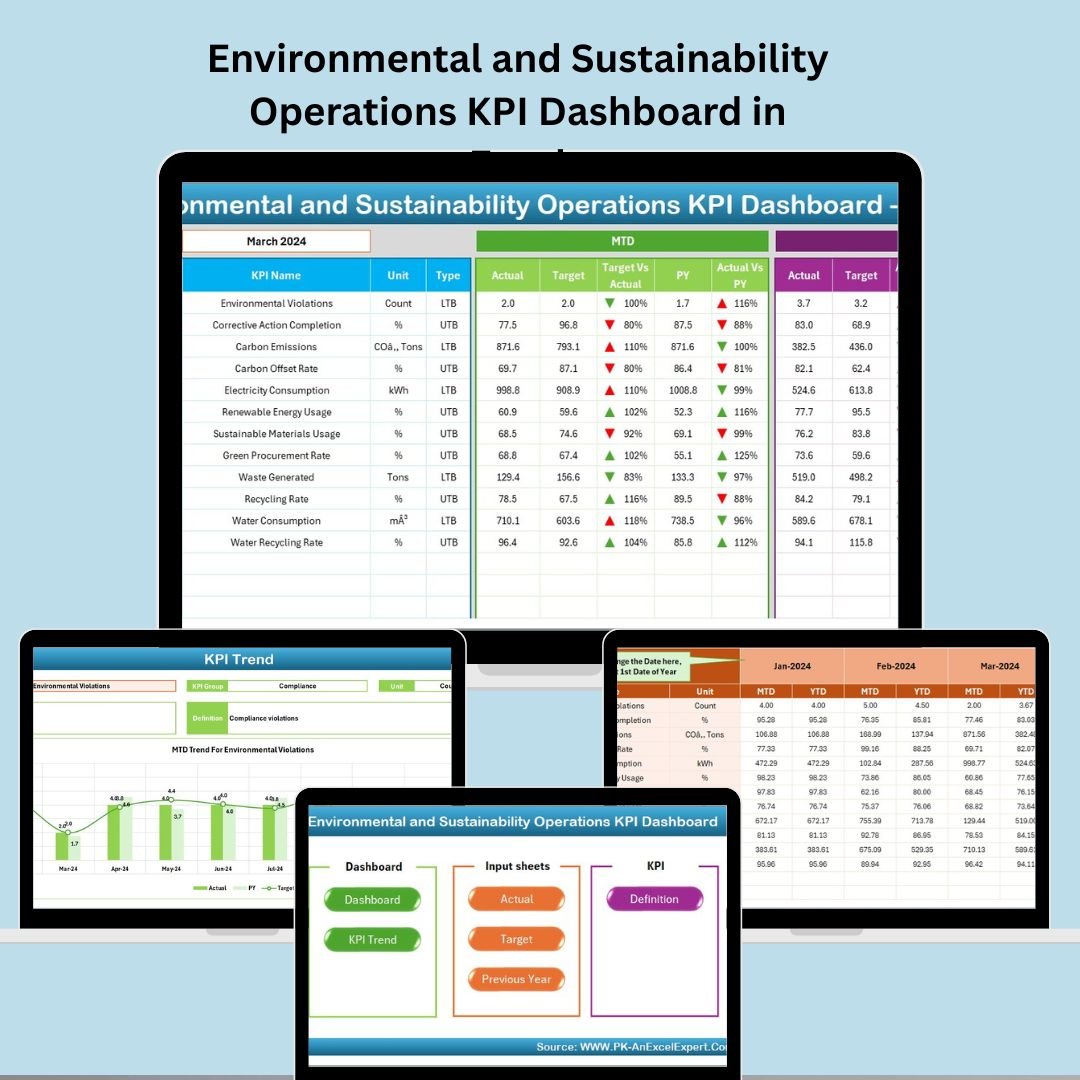
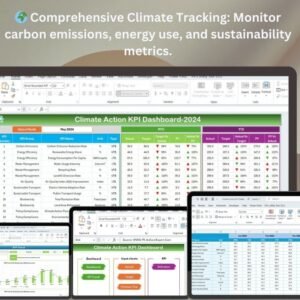
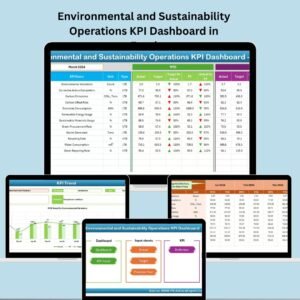
In today’s evolving business landscape, environmental performance is as critical as financial performance. Companies must demonstrate measurable commitment to sustainability—and that starts with data. The Environmental and Sustainability Operations KPI Dashboard in Excel empowers you to monitor, analyze, and act on key sustainability metrics—all in one intuitive, easy-to-use Excel tool.
Whether you’re tracking energy usage, carbon emissions, or recycling rates, this Excel-based dashboard helps you stay compliant, cost-efficient, and environmentally responsible.
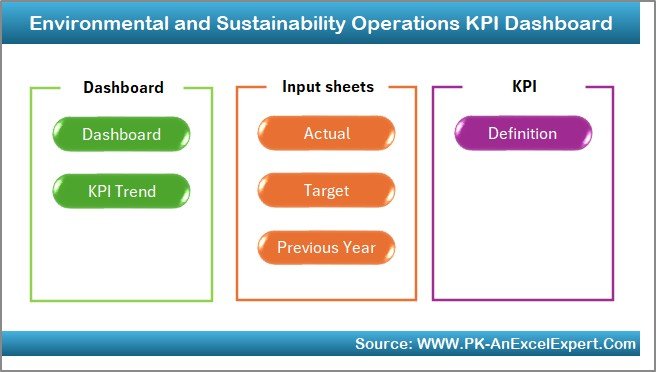
💡 Key Features of Environmental and Sustainability KPI Dashboard
🏠 Home Sheet – Your Command Center
-
Clean, simple navigation with clickable buttons
-
Instantly jump to Dashboard, Trend, Input, or Target sheets
-
Ideal for new users and team-wide adoption
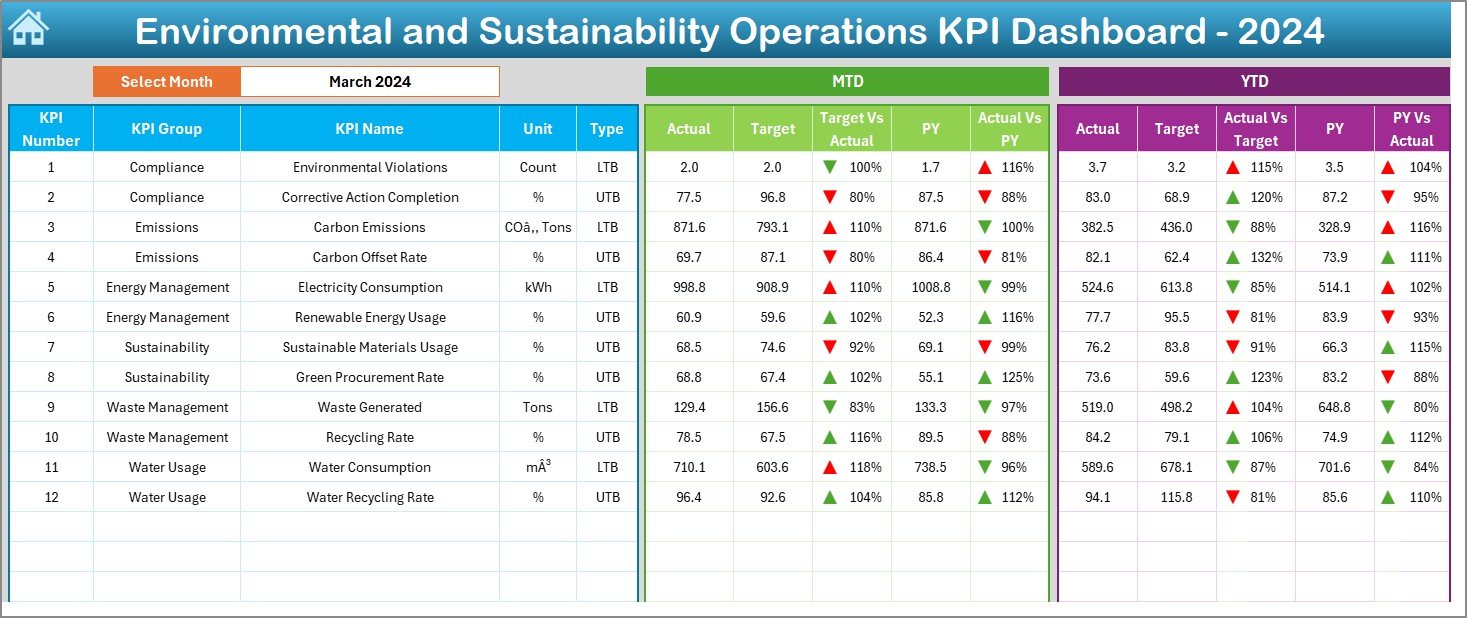
📊 Dashboard Sheet – All KPIs at a Glance
-
Select any month from dropdown (D3)
-
View MTD (Month-to-Date) and YTD (Year-to-Date) metrics
-
Compare Actuals with Target and Previous Year
-
✅ Conditional formatting with up/down arrows for instant performance insights
-
Designed for fast, visual decision-making
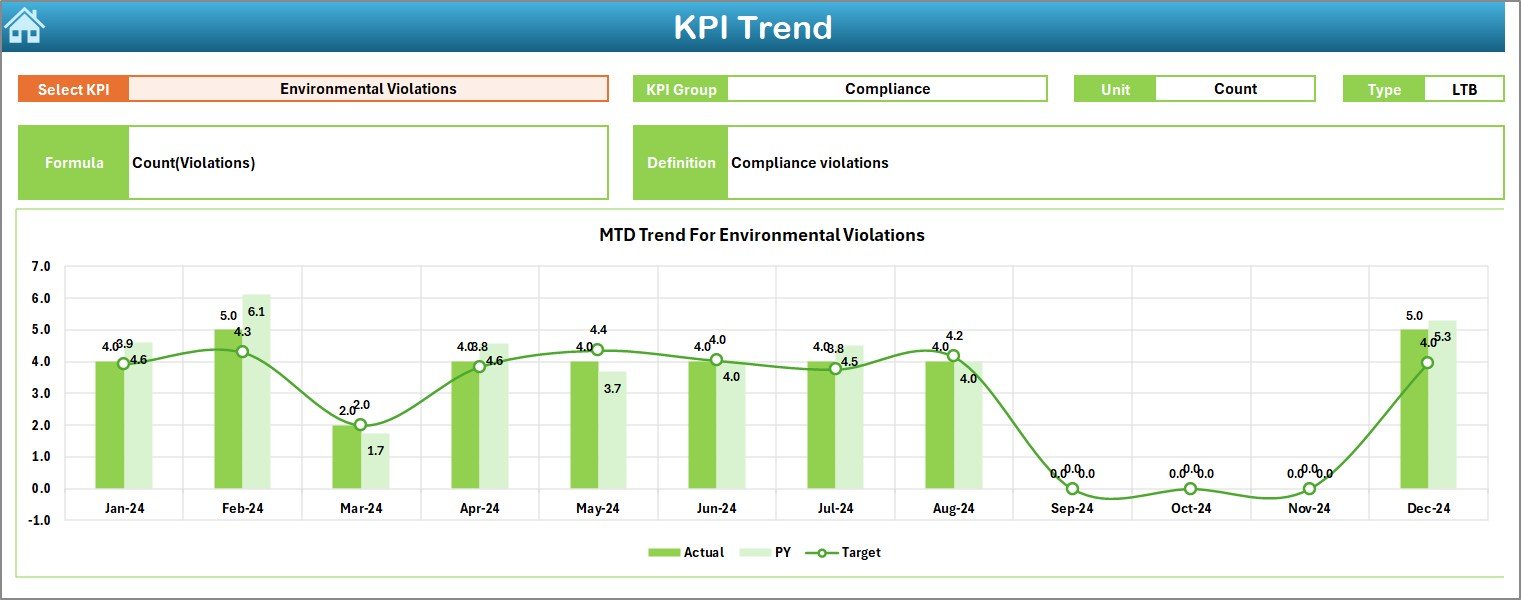
📈 KPI Trend Sheet – Analyze Monthly Performance
-
Pick a KPI from dropdown (C3)
-
See KPI Group, Unit, Type (LTB/UTB), Formula, and Definition
-
Visualize MTD and YTD trends using line charts
-
Great for spotting patterns and planning proactive actions
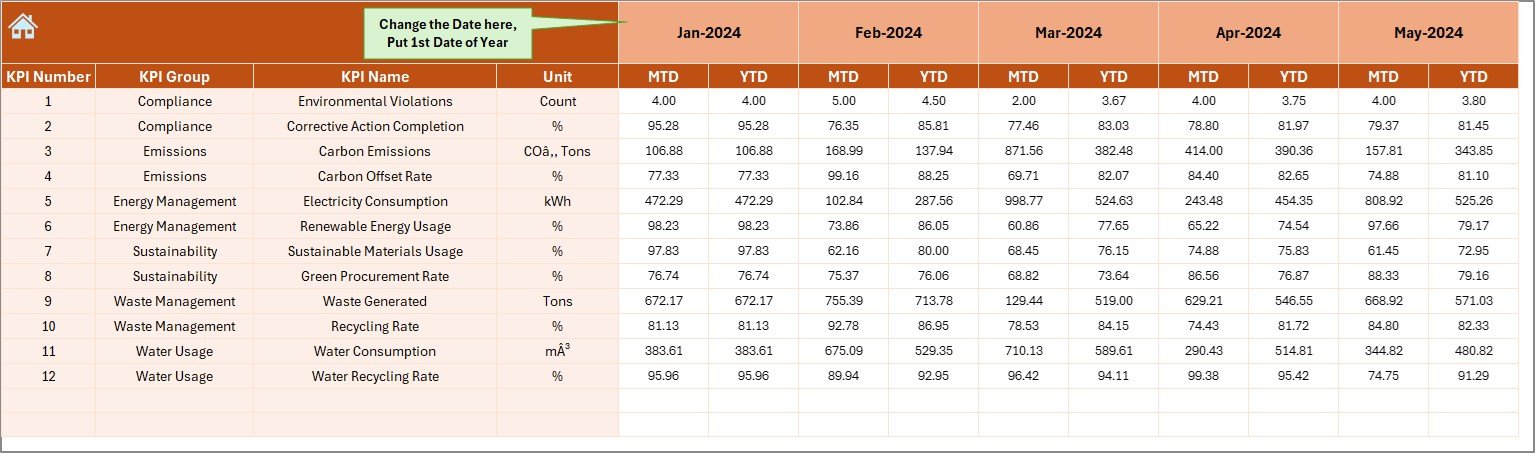
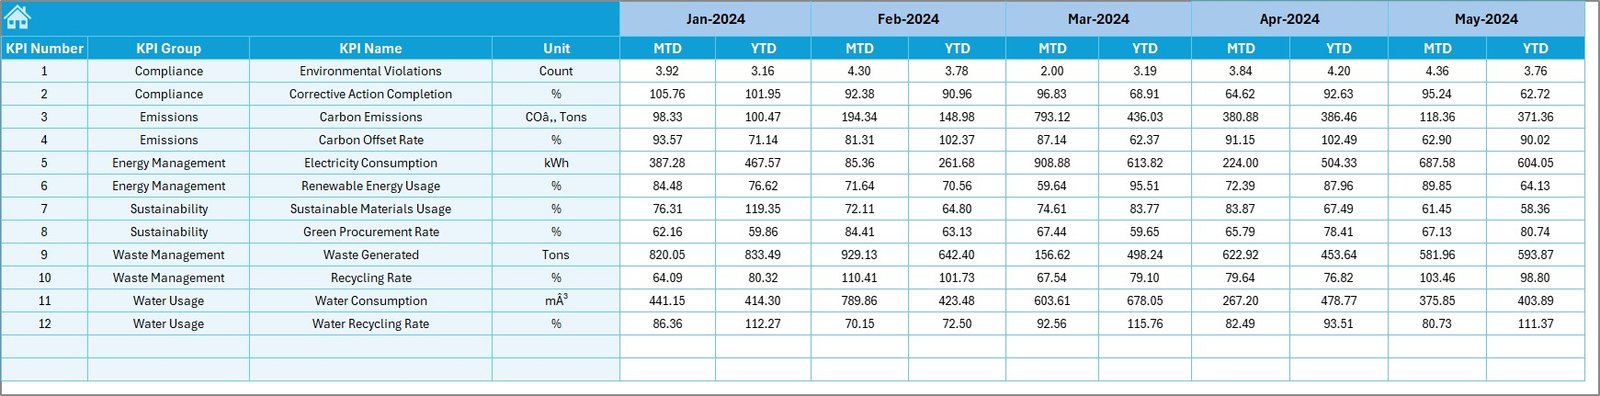
📥 Actual Numbers Input – Data Entry Made Easy
-
Select reporting start month in cell E1
-
Enter actual monthly values for all KPIs (MTD and YTD)
-
Dashboard and trend visuals update automatically
🎯 Target Sheet – Define Sustainability Goals
-
Input monthly targets for MTD and YTD per KPI
-
Helps benchmark and monitor organizational performance
-
Tied directly to dashboard for accurate variance display
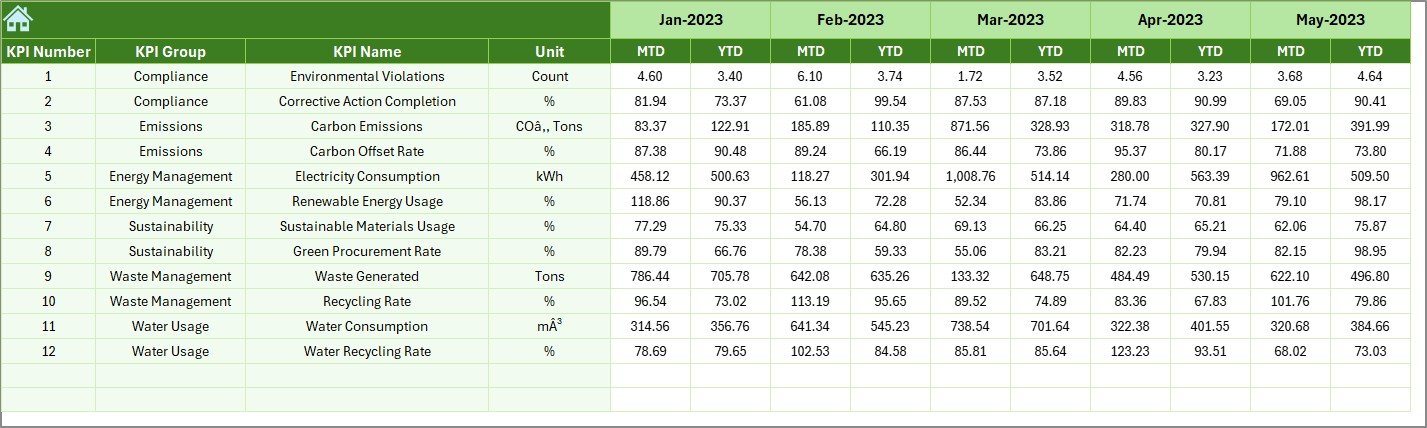
📁 Previous Year Numbers – Year-over-Year Comparison
-
Track and input last year’s numbers for each KPI
-
Enables deep comparisons and growth analysis
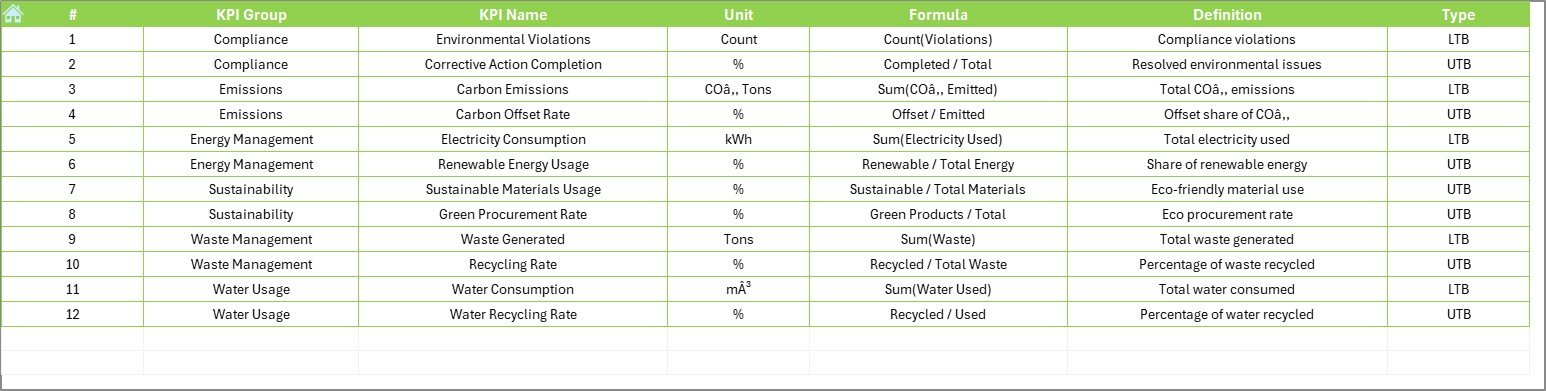
📘 KPI Definition Sheet – Consistency & Clarity
-
Log KPI Name, Group, Unit, Formula, and Definition
-
Ensures everyone knows what each metric means
-
Reduces confusion and supports team alignment
📦 What’s Inside the Template?
When you download this powerful Excel file, you receive:
✅ 7 fully structured worksheet tabs
✅ Built-in formulas and automated visuals
✅ Dropdown menus for month and KPI selection
✅ Conditional formatting and icon-based feedback
✅ Support for LTB (Lower the Better) and UTB (Upper the Better) KPIs
✅ Expandable layout for tracking additional metrics
No macros or coding required—just open Excel and start tracking!
🛠️ How to Use the Product
-
📥 Download and open the Excel file
-
📆 Set your reporting year in the Actual Numbers Input tab
-
🎯 Define targets in the Target Sheet
-
✍️ Input actual MTD and YTD data each month
-
📁 Add last year’s numbers in the Previous Year Sheet
-
📊 Use the Dashboard and Trend tabs to visualize progress
-
🔍 Spot trends and identify underperforming KPIs instantly
Built for business users—no Excel expertise required.
👥 Who Can Benefit from This Dashboard?
🌿 Sustainability Managers – Align KPIs with ESG goals
🏭 Facility & Plant Managers – Reduce resource consumption
📊 Compliance Teams – Prepare for audits with documented metrics
🧠 Executives & Strategy Leaders – Monitor company-wide green impact
🏢 Operations Teams – Improve energy, waste, and water efficiency
📚 Educational & Government Institutions – Track public environmental programs
If your organization has sustainability goals—this dashboard is a must-have.
🔗 Click here to read the Detailed blog post
🎥 Visit our YouTube channel to learn step-by-step video tutorials
👉 YouTube.com/@PKAnExcelExpert


Reviews
There are no reviews yet.