
The EdTech KPI Dashboard in Power BI is a powerful and interactive tool designed to help educational technology providers, educational institutions, and e-learning organizations track and measure their performance through key performance indicators (KPIs). This dashboard provides valuable insights into various aspects of EdTech operations, including student engagement, course completion rates, enrollment trends, and revenue generation, allowing stakeholders to make data-driven decisions to optimize their educational offerings.
Whether you’re tracking the performance of an online course, monitoring the effectiveness of educational tools, or analyzing the success of different learning modules, this dashboard enables you to see key metrics at a glance. With its user-friendly design and real-time data integration, this Power BI dashboard makes it easier to optimize the learning experience and maximize educational outcomes.
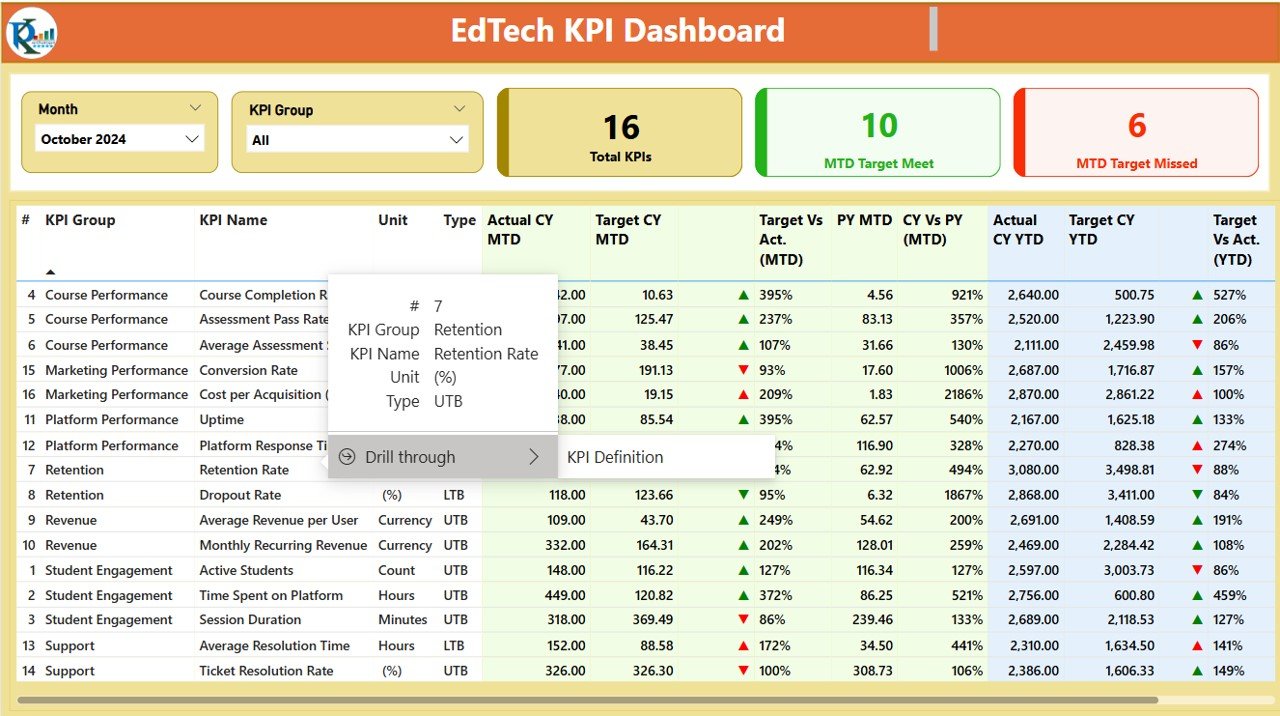
Key Features of the EdTech KPI Dashboard in Power BI
📊 Comprehensive KPI Tracking
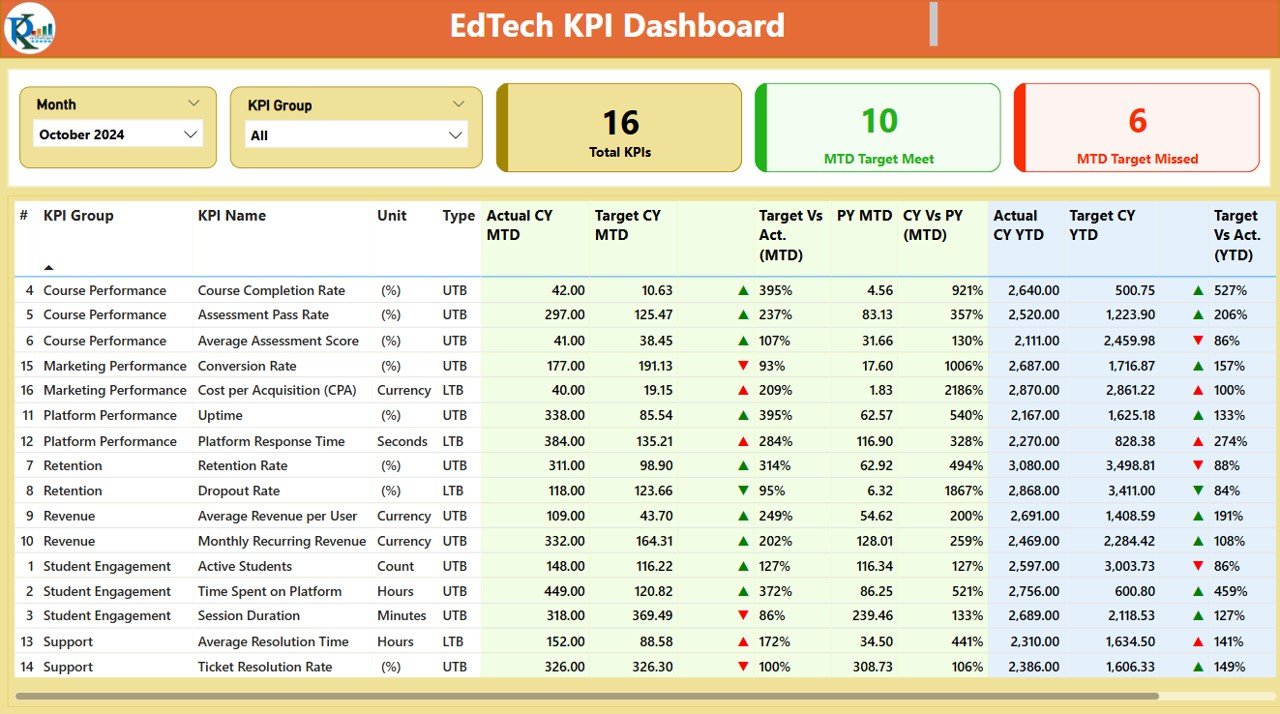
Monitor key EdTech metrics such as course completion rates, student engagement, revenue from courses, and student satisfaction. Track the effectiveness of your educational offerings with real-time insights.
📈 Student Engagement Monitoring
Track how engaged students are with your courses and materials. Measure interactions, active participation, and engagement levels to assess the success of different learning modules.
💡 Enrollment & Revenue Tracking
Measure enrollment trends and track revenue generated by course offerings, subscriptions, and other revenue streams. Use this data to assess growth and identify new opportunities for revenue generation.
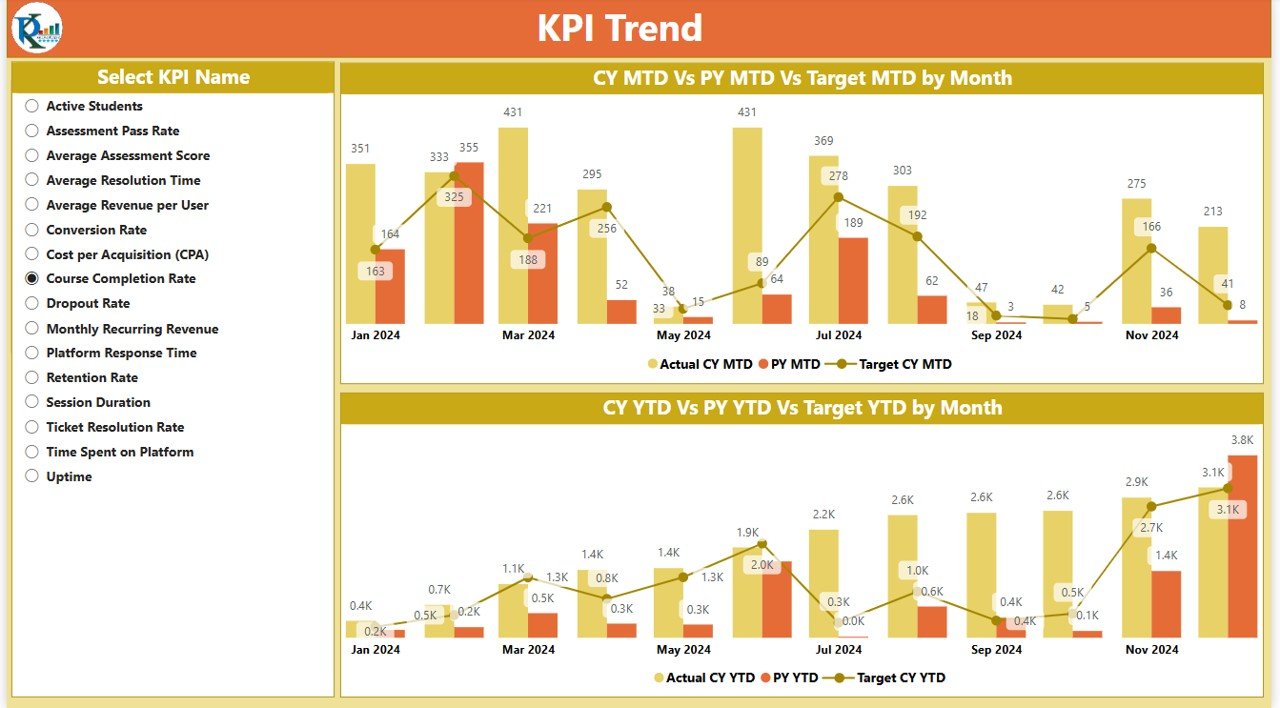
⏱ Time-Based Performance Analysis
Analyze your KPIs over different time periods (daily, weekly, monthly) to identify trends in student behavior, course completions, and revenue generation. Make informed decisions based on historical data.
📅 Learning Module Effectiveness
Monitor the performance of individual learning modules and identify which ones are most popular and effective. This helps you optimize your curriculum and improve overall course offerings.
⚙️ Customizable Dashboard
Tailor the dashboard to meet your specific EdTech business needs. Add custom KPIs, adjust data sources, and modify the design to reflect your organization’s objectives.
Why You’ll Love the EdTech KPI Dashboard in Power BI
✅ Track Student Engagement & Progress
Easily monitor how students are interacting with your courses and track their progress. This helps improve student retention and satisfaction.
✅ Optimize Course & Module Effectiveness
Analyze which modules are most effective and which ones need improvement. Use data-driven insights to optimize your learning materials and curriculum.
✅ Increase Revenue with Data Insights
Track enrollment trends and revenue generation to identify opportunities for new courses, pricing strategies, and upselling.
✅ Make Informed Decisions
Leverage real-time data and insights to make informed decisions that drive growth, improve student outcomes, and enhance the overall learning experience.
✅ Fully Customizable & Scalable
The dashboard is highly customizable to fit your organization’s unique needs. It can scale from small EdTech startups to large educational institutions and e-learning platforms.
What’s Inside the EdTech KPI Dashboard in Power BI?
-
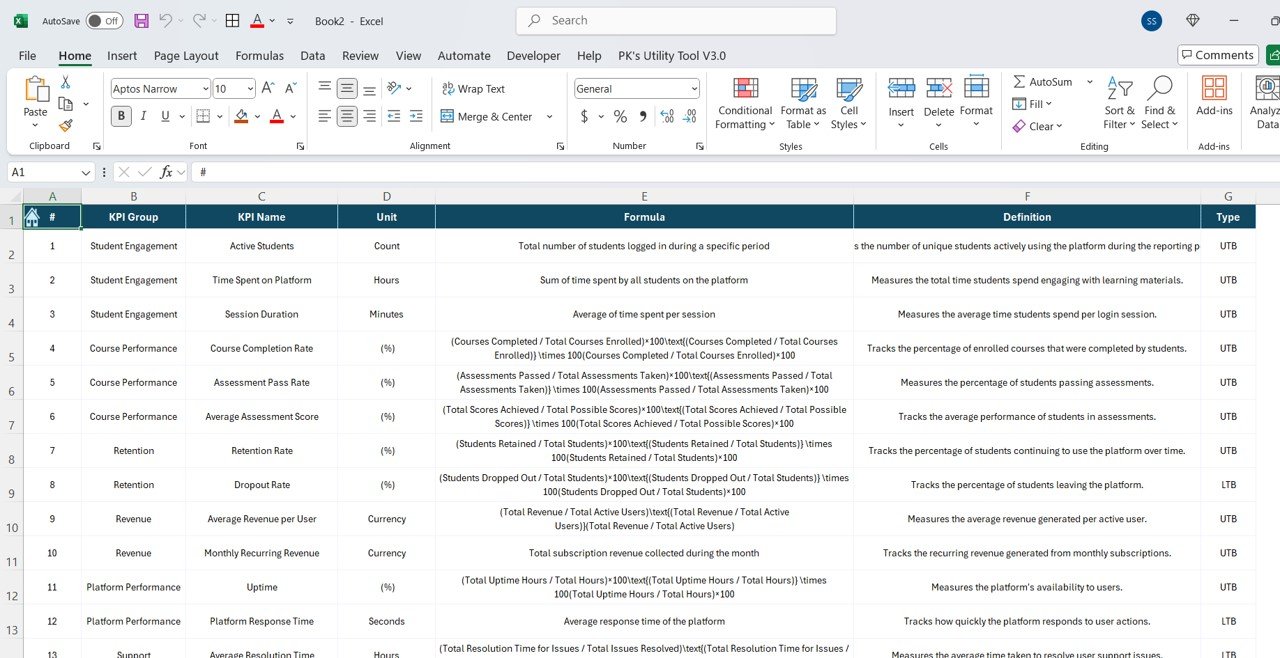
Comprehensive KPI Tracking: Monitor course completions, engagement, and revenue metrics.
-
Student Engagement Monitoring: Track student activity and interaction levels.
-
Enrollment & Revenue Tracking: Measure enrollment trends and course revenue.
-
Time-Based Performance Analysis: Analyze performance across different time periods.
-
Learning Module Effectiveness: Track which modules are most effective.
-
Customizable Features: Add and modify KPIs as per your business requirements.
How to Use the EdTech KPI Dashboard in Power BI
1️⃣ Download the Template: Get instant access to the EdTech KPI Dashboard in Power BI.
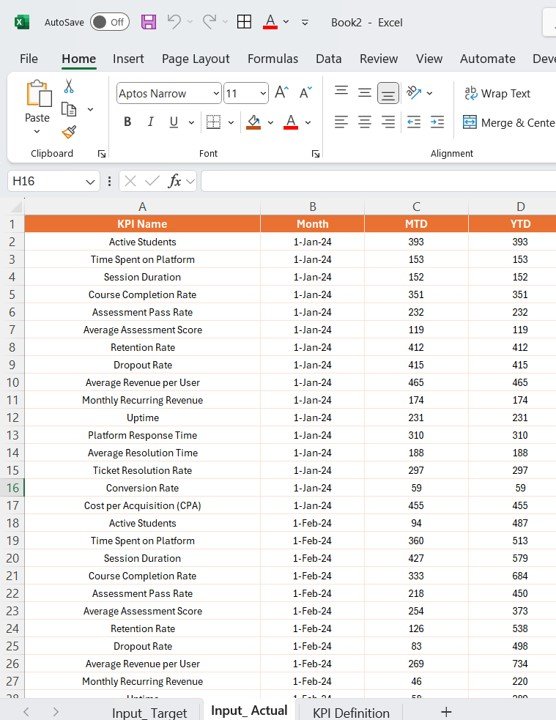
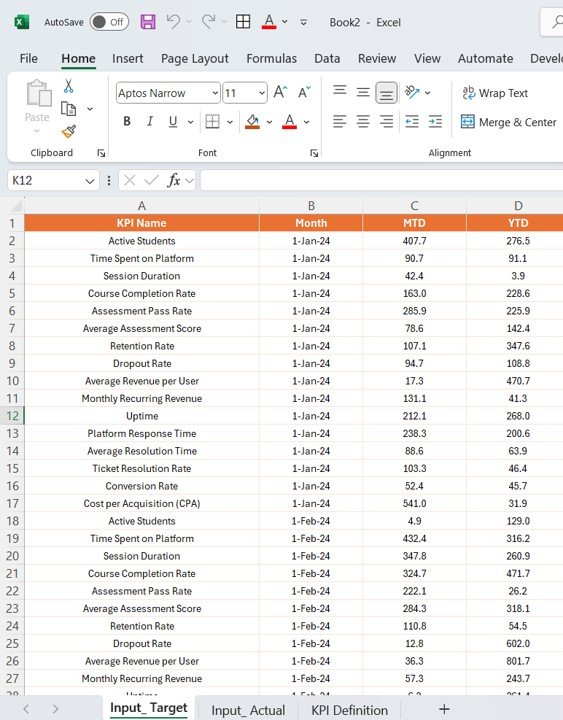
2️⃣ Integrate Your Data: Link your course enrollment, revenue, and engagement data to the dashboard for real-time insights.
3️⃣ Track KPIs & Performance: Monitor key metrics like course completion rates, student engagement, and revenue generation.
4️⃣ Analyze Trends & Data: Use time-based analysis to track progress and identify growth opportunities.
5️⃣ Optimize Your EdTech Business: Use the insights from the dashboard to optimize course offerings, increase student engagement, and drive revenue.
Who Can Benefit from the EdTech KPI Dashboard in Power BI?
🔹 EdTech Providers & E-Learning Platforms
🔹 Educational Institutions & Online Course Providers
🔹 Content Developers & Curriculum Designers
🔹 Learning & Development Teams
🔹 E-Learning Analysts & Data Scientists
🔹 Educational Entrepreneurs & Startups
🔹 Investors & Stakeholders in EdTech Ventures
Track and optimize your EdTech business with the EdTech KPI Dashboard in Power BI. Monitor key metrics, analyze performance, and make data-driven decisions to enhance student engagement and drive growth.
Click here to read the Detailed blog post
Visit our YouTube channel to learn step-by-step video tutorials
Youtube.com/@PKAnExcelExpert


Reviews
There are no reviews yet.