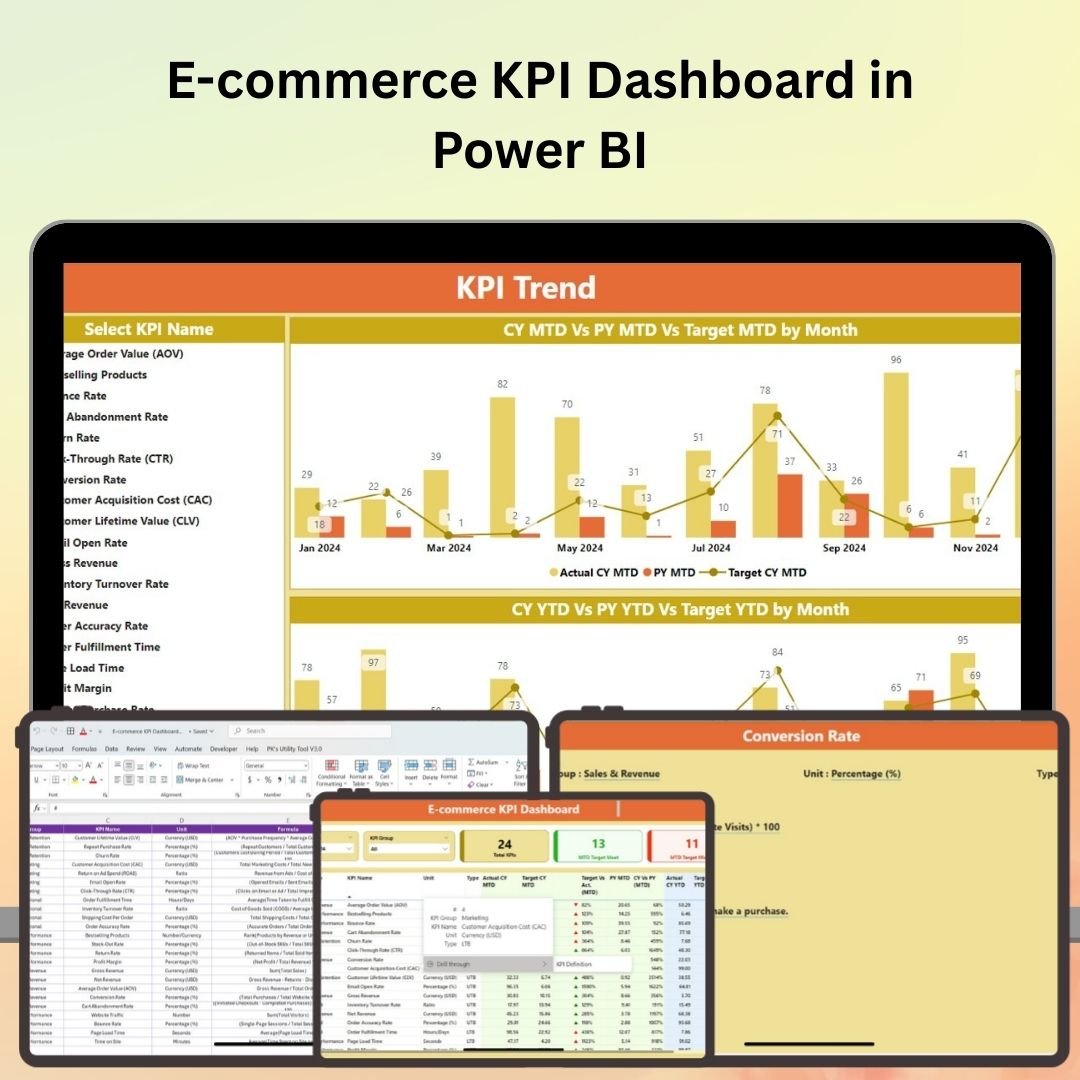
The E-Commerce KPI Dashboard in Power BI is a dynamic and interactive tool designed for e-commerce business owners, product managers, and marketing teams. This Power BI dashboard enables you to track key performance indicators (KPIs) related to your online store, including sales performance, customer behavior, product performance, marketing ROI, and operational efficiency. With real-time data tracking and customizable visualizations, this dashboard allows you to monitor your e-commerce business performance and make data-driven decisions to optimize growth and profitability.
Whether you’re tracking traffic, conversion rates, or revenue, this KPI dashboard helps you identify trends, measure success, and uncover areas for improvement, all from one easy-to-use platform.

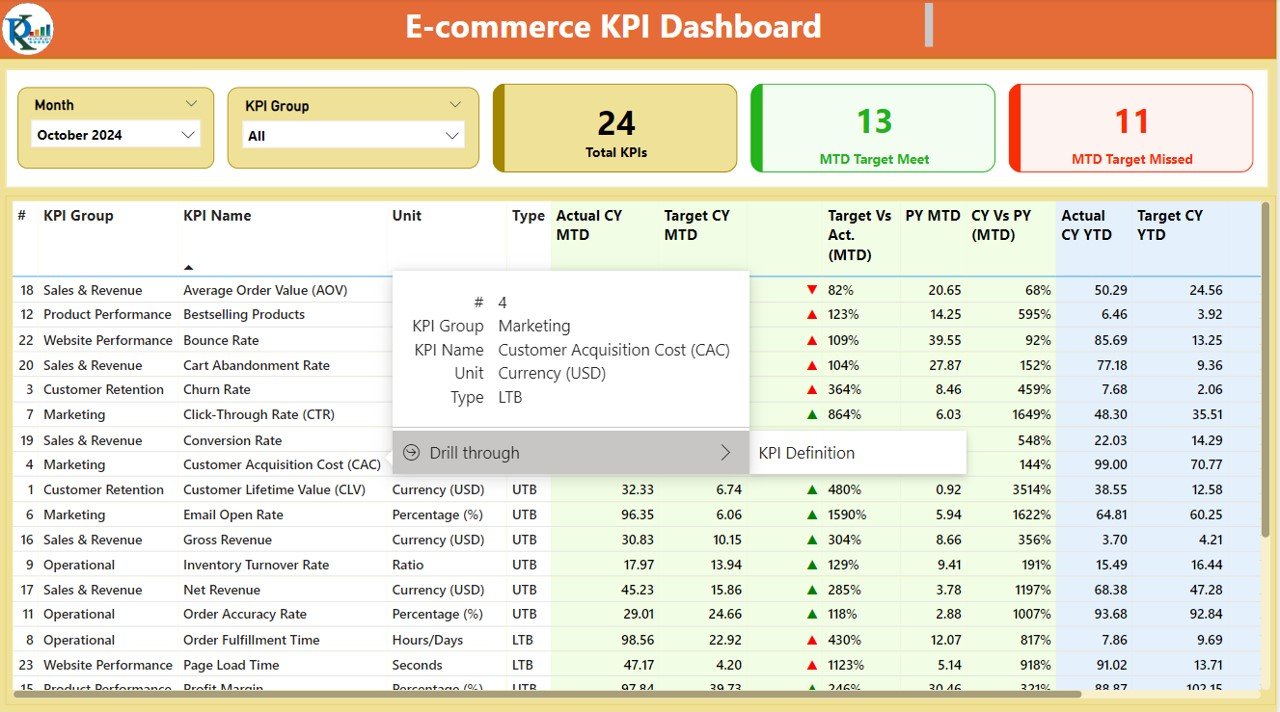
Key Features of the E-Commerce KPI Dashboard in Power BI:
📈 Sales and Revenue Monitoring
Track the overall sales performance, revenue growth, average order value, and sales by product category to gain insights into business profitability.
👥 Customer Behavior Analysis
Monitor customer metrics such as acquisition channels, lifetime value, retention rate, and purchasing patterns to enhance customer engagement and loyalty.
🛍️ Product Performance Tracking
Track the performance of individual products, including sales volume, returns, and inventory status, to optimize product offerings and inventory management.
🎯 Marketing and Campaign ROI
Evaluate the effectiveness of marketing campaigns by tracking conversion rates, customer acquisition costs (CAC), and return on ad spend (ROAS).
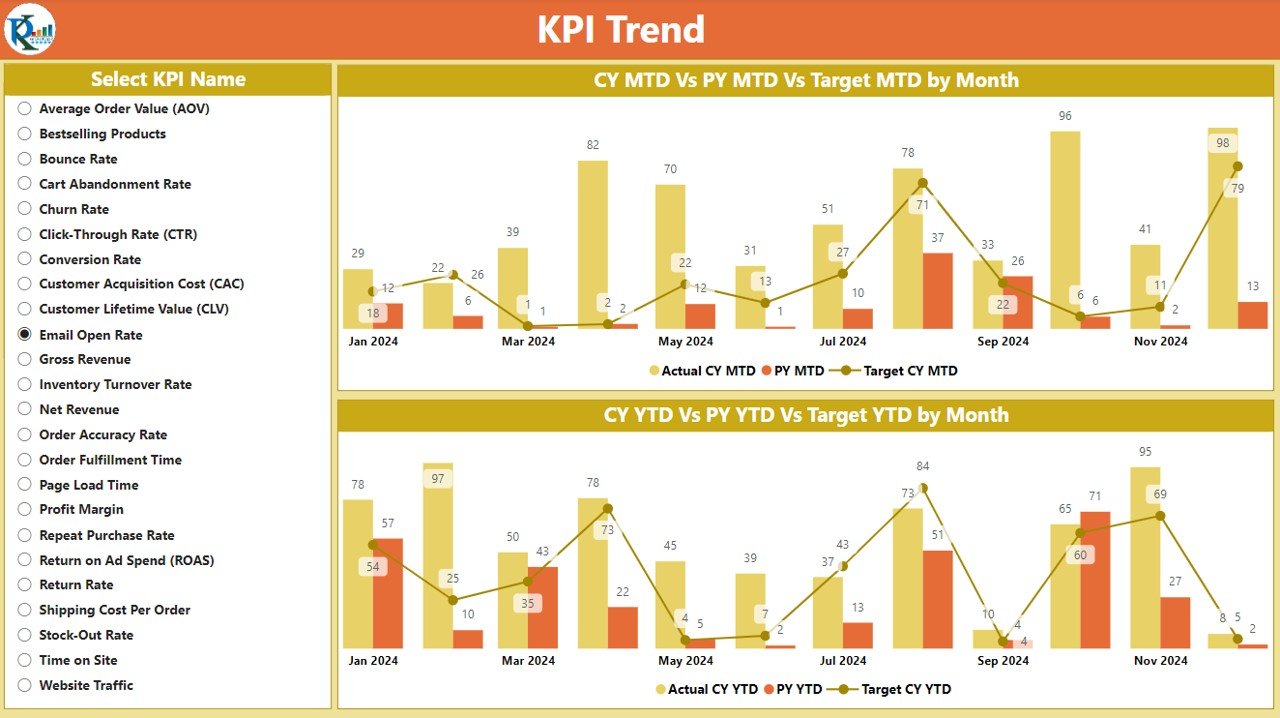
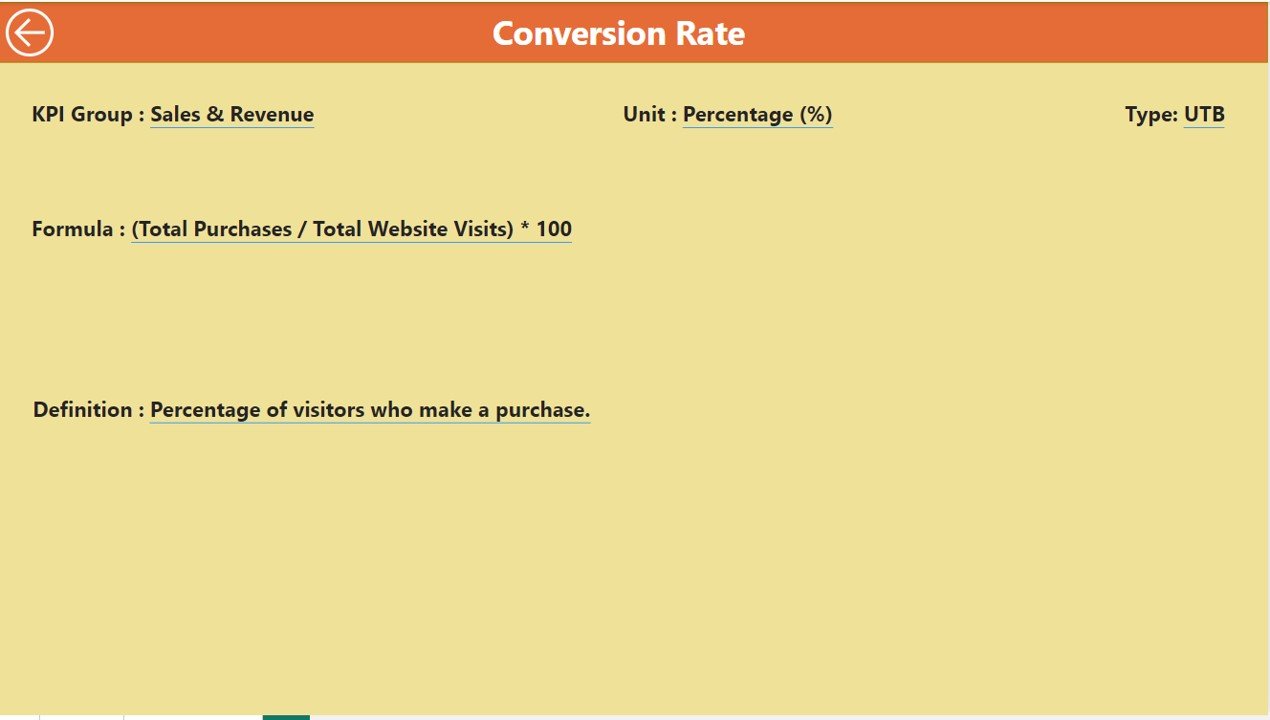
💡 Traffic and Conversion Analysis
Analyze website traffic, user behavior, and conversion rates to understand how visitors interact with your online store and improve your conversion optimization strategies.
🚀 Why You’ll Love the E-Commerce KPI Dashboard in Power BI:
✅ Track Sales Performance – Monitor overall sales trends, revenue, and average order value to evaluate business growth.
✅ Measure Customer Behavior – Understand customer lifetime value, retention rates, and purchasing patterns to optimize customer engagement and retention.
✅ Optimize Product Performance – Track individual product sales, returns, and inventory levels to adjust product offerings and inventory management.
✅ Analyze Marketing ROI – Measure the success of your marketing campaigns by tracking ROAS, CAC, and conversion rates.
✅ Enhance Conversion Rates – Monitor traffic and conversion metrics to improve your website’s performance and drive more sales.
✅ Fully Customizable and Interactive – Customize the dashboard to fit your business needs, with interactive visualizations and real-time tracking.
What’s Inside the E-Commerce KPI Dashboard in Power BI:
-
Sales and Revenue Performance: Track sales growth, average order value, and revenue by product category to assess profitability and business performance.
-
Customer Metrics: Monitor key customer metrics, including customer acquisition channels, lifetime value, and retention rates to improve engagement strategies.
-
Product Performance: Track sales volume, returns, and inventory levels for each product to optimize product offerings and manage stock levels.
-
Marketing and Campaign Metrics: Analyze the ROI of your marketing campaigns, including ROAS, conversion rates, and customer acquisition costs to measure marketing effectiveness.
-
Website Traffic and Conversion Rates: Monitor website traffic, user engagement, and conversion rates to improve user experience and optimize conversion strategies.
-
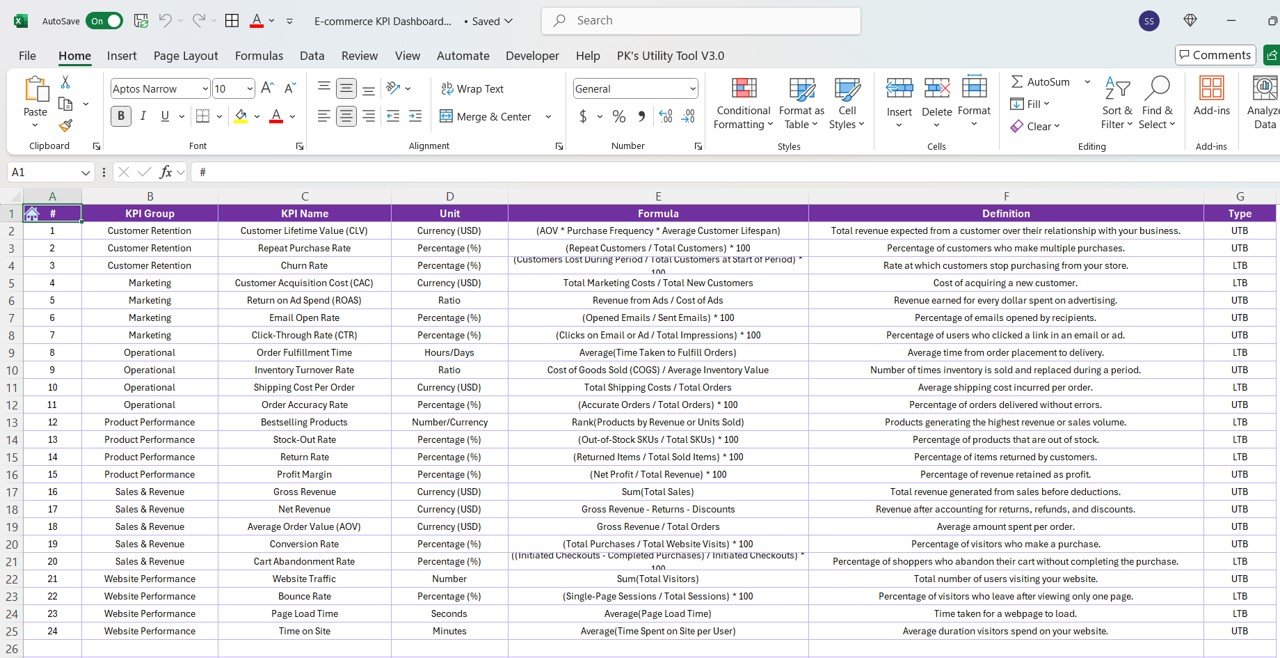
Customizable Reports: Generate tailored reports that focus on specific KPIs such as sales performance, marketing ROI, or customer acquisition, helping you make data-driven decisions.
How to Use the E-Commerce KPI Dashboard in Power BI:
1️⃣ Download the Template – Access your Power BI file instantly after purchase.
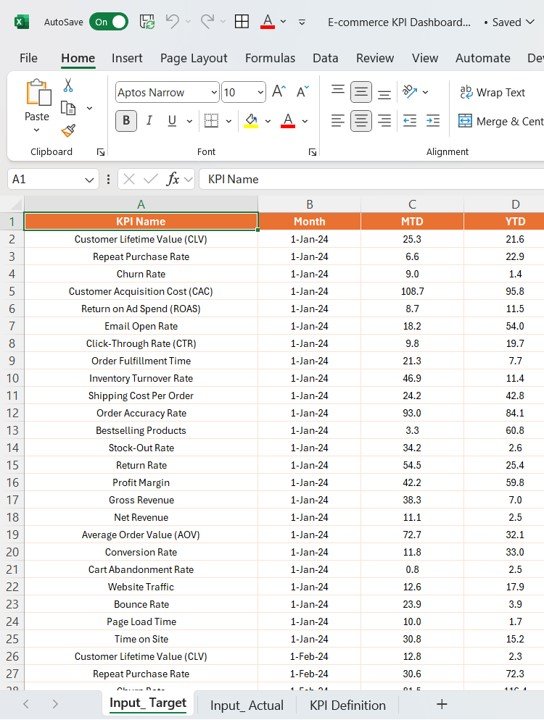
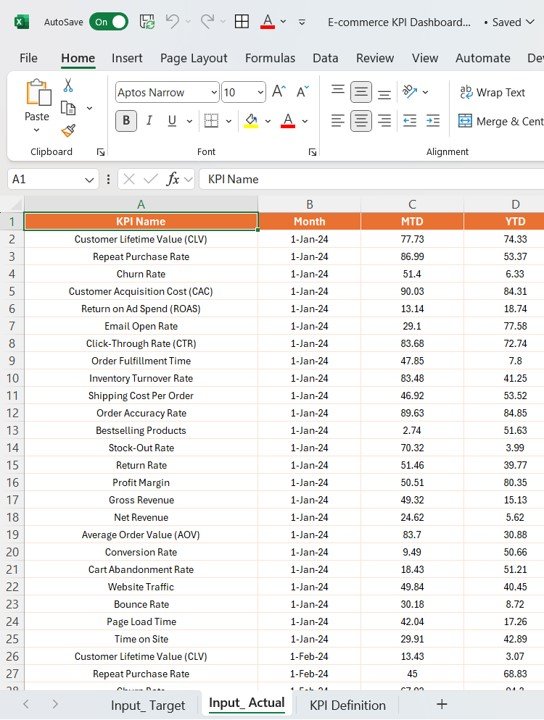
2️⃣ Import Your E-Commerce Data – Input your sales, customer, and product data into the dashboard to start tracking KPIs.
3️⃣ Monitor Key Metrics – Use the dashboard to track sales, customer behavior, marketing ROI, and product performance in real-time.
4️⃣ Analyze Website Traffic – Evaluate website traffic, conversion rates, and user behavior to improve your online store’s performance.
5️⃣ Generate Reports – Create customized reports summarizing key metrics such as sales, ROI, and customer behavior to inform your e-commerce strategy.
Who Can Benefit from the E-Commerce KPI Dashboard in Power BI:
-
E-Commerce Business Owners
-
Marketing and Sales Teams
-
Product Managers
-
Data Analysts
-
Online Retailers
-
Digital Marketing Agencies
-
E-Commerce Consultants
-
Supply Chain and Operations Managers
The E-Commerce KPI Dashboard in Power BI is the perfect tool for tracking and optimizing your e-commerce performance. By providing insights into sales, customer behavior, product performance, marketing ROI, and website traffic, this dashboard helps you make smarter business decisions and drive growth for your online store.
Click here to read the Detailed blog post
https://www.pk-anexcelexpert.com/e-commerce-kpi-dashboard-in-power-bi/
Visit our YouTube channel to learn step-by-step video tutorials
Youtube.com/@PKAnExcelExpert


Reviews
There are no reviews yet.