
In the competitive world of online retail, having a clear and organized view of your business performance is critical. The E-commerce Dashboard in Power BI is a ready-to-use, interactive analytics tool designed for online store owners, managers, and analysts who want to track sales, revenue, customer satisfaction, and shipping efficiency — all in one place.
With visually appealing charts, KPI cards, and interactive filters, this dashboard turns raw e-commerce data into meaningful insights that drive smarter decisions. Whether you sell on a single platform or across multiple channels, this dashboard helps you monitor, analyze, and optimize every aspect of your e-commerce operations.
🔑 Key Features of the E-commerce Dashboard
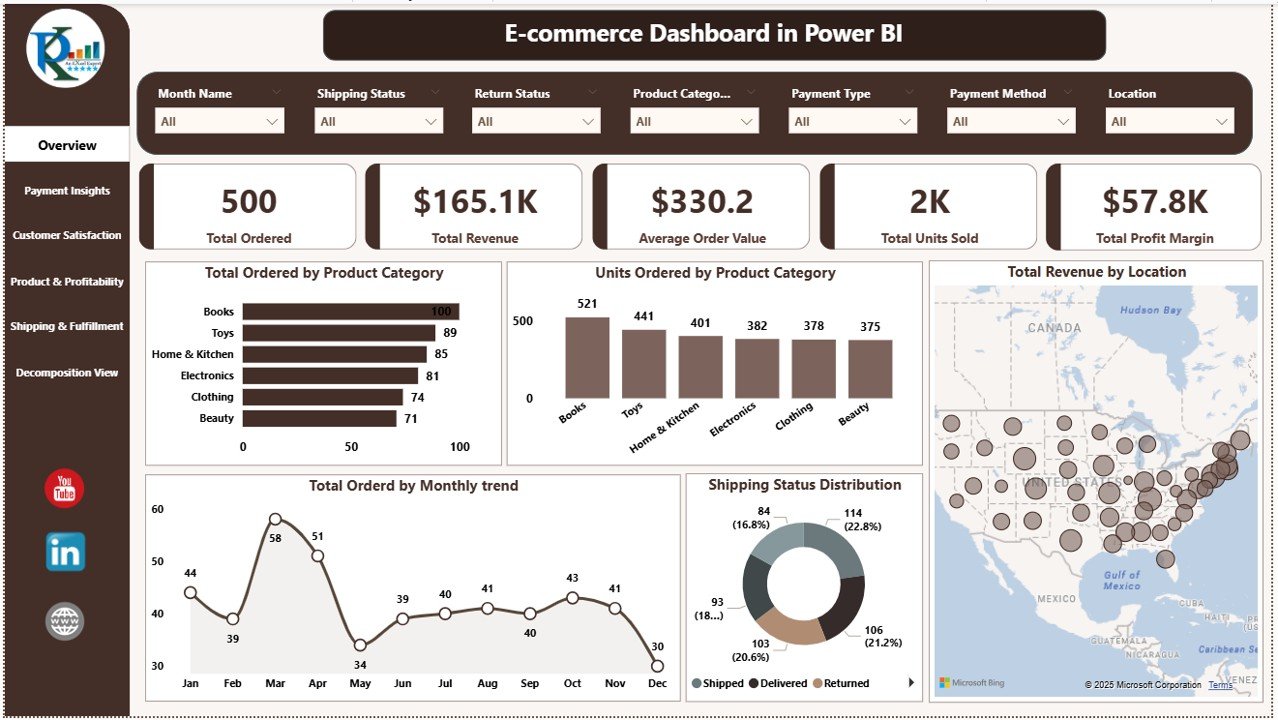
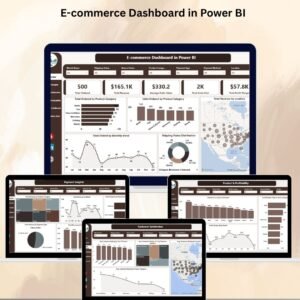
📌 Overview Page – High-Level Performance Snapshot
-
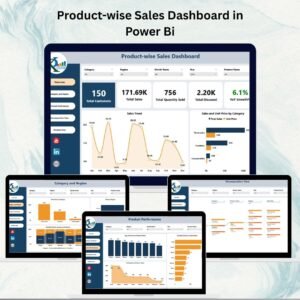
Cards for Key Metrics: Total Orders, Total Revenue, Average Order Value, Total Units Sold, and Total Profit Margin.
-
Charts: Orders by Product Category, Units Ordered by Product Category, Revenue by Location, Monthly Order Trend, and Shipping Status Distribution.
-
Quickly identify top products, best-performing regions, and seasonal sales patterns.
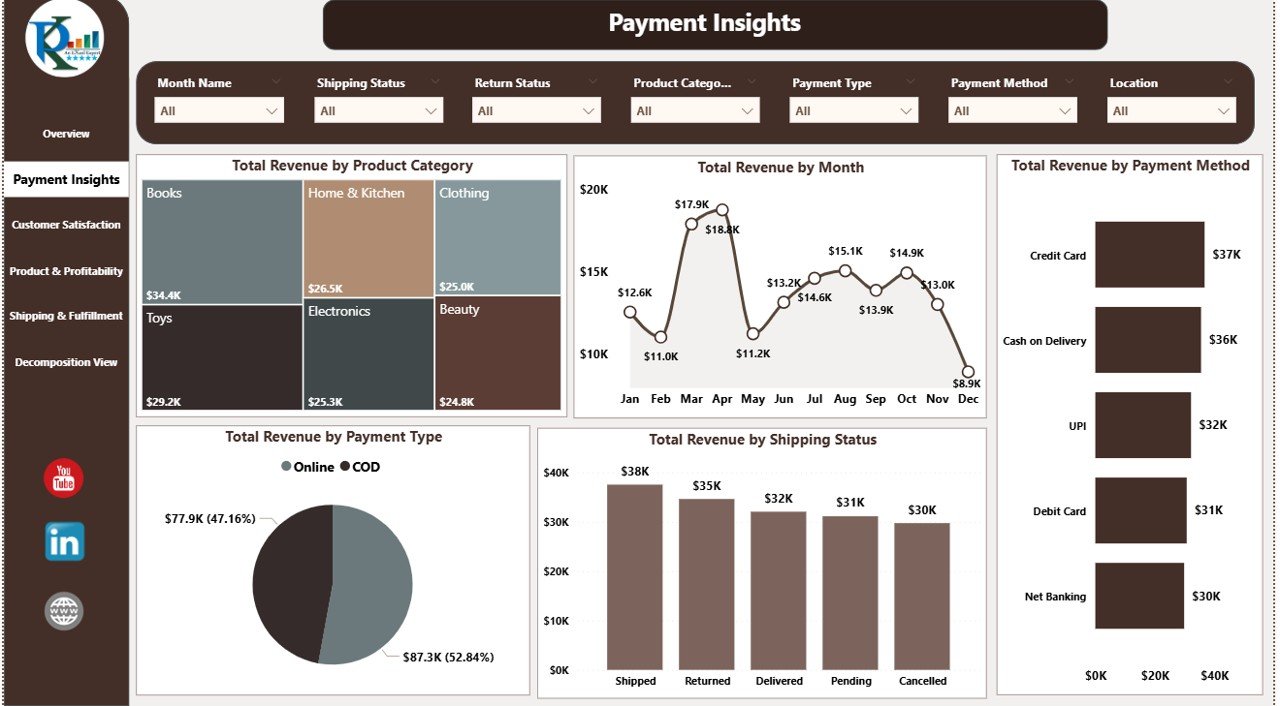
💳 Payment Insights – Understand Revenue Sources
-
Charts: Revenue by Product Category, Revenue by Month, Revenue by Payment Method, Revenue by Payment Type, and Revenue by Shipping Status.
-
Discover which payment options are most popular and profitable.
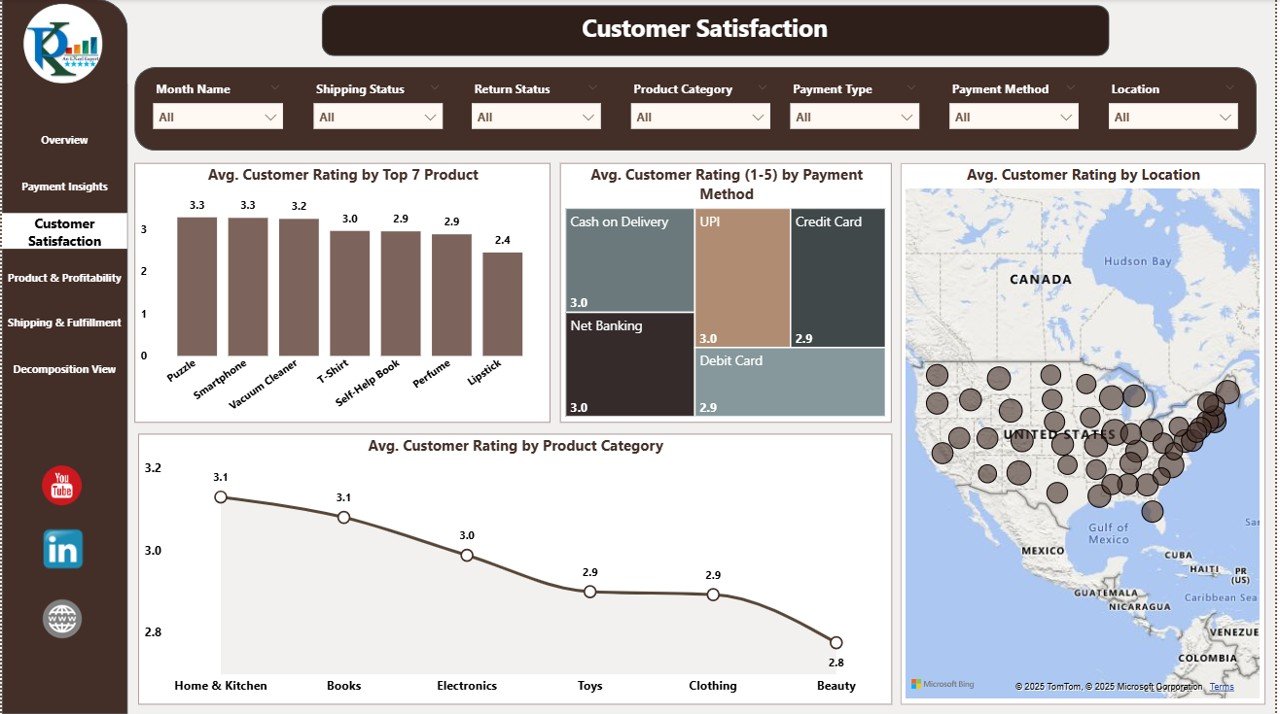
💬 Customer Satisfaction – Track Service Quality
-
Charts: Average Customer Rating by Top 7 Products, by Payment Method, by Location, and by Product Category.
-
Identify areas where customer experience can be improved.
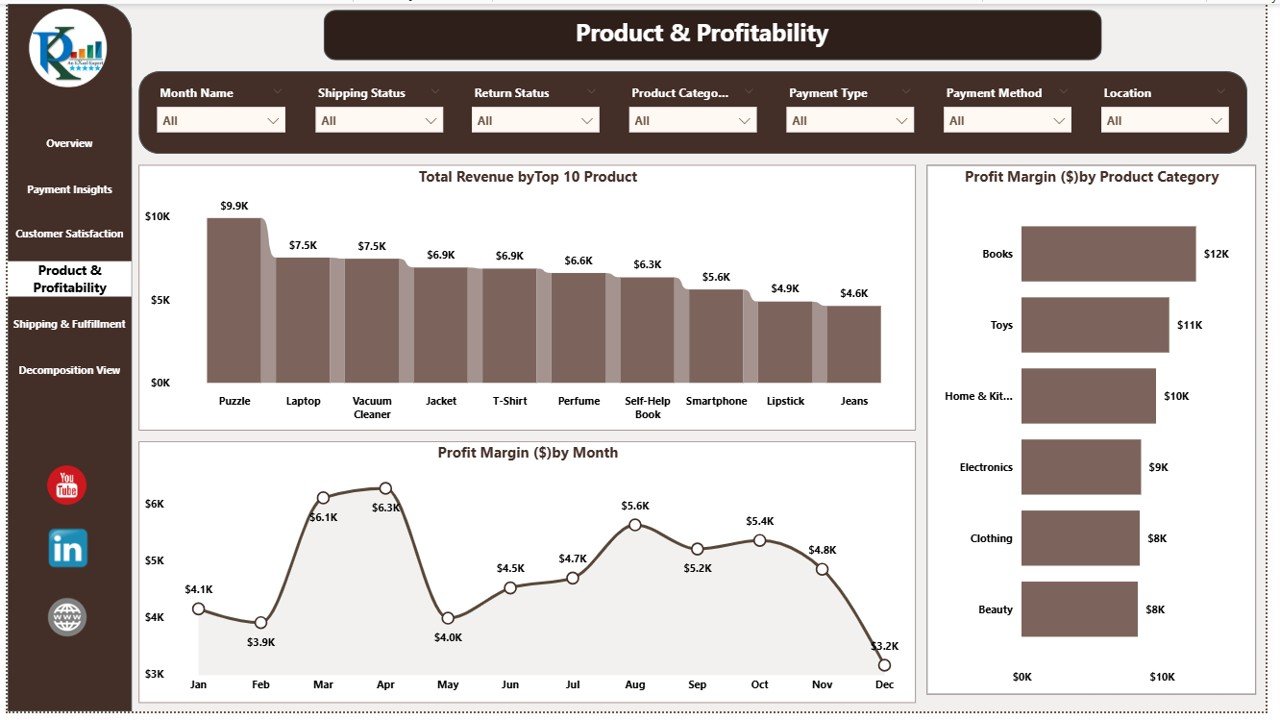
📦 Product & Profitability – Focus on Margins
-
Charts: Revenue by Top 10 Products, Profit Margin by Category, and Profit Margin by Month.
-
Pinpoint high-margin products to prioritize in marketing and sales efforts.
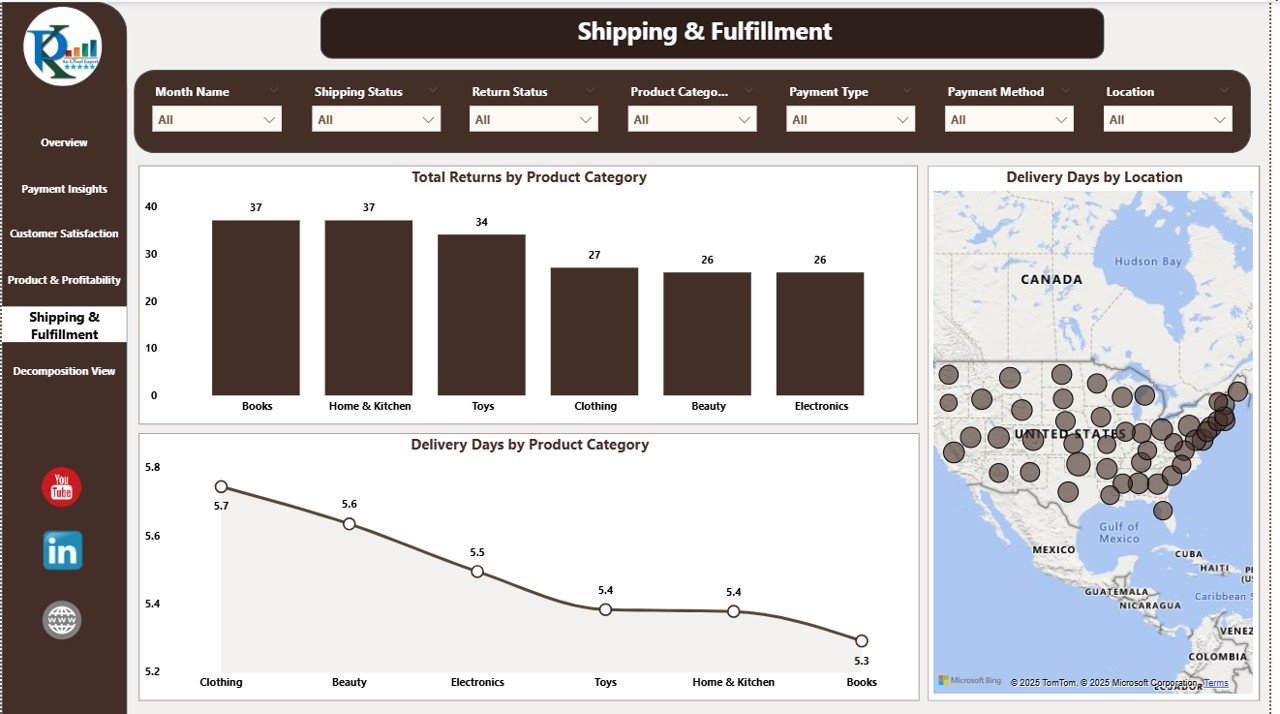
🚚 Shipping & Fulfillment – Optimize Logistics
-
Charts: Returns by Product Category, Delivery Days by Location, and Delivery Days by Product Category.
-
Monitor shipping performance to reduce delays and improve customer satisfaction.
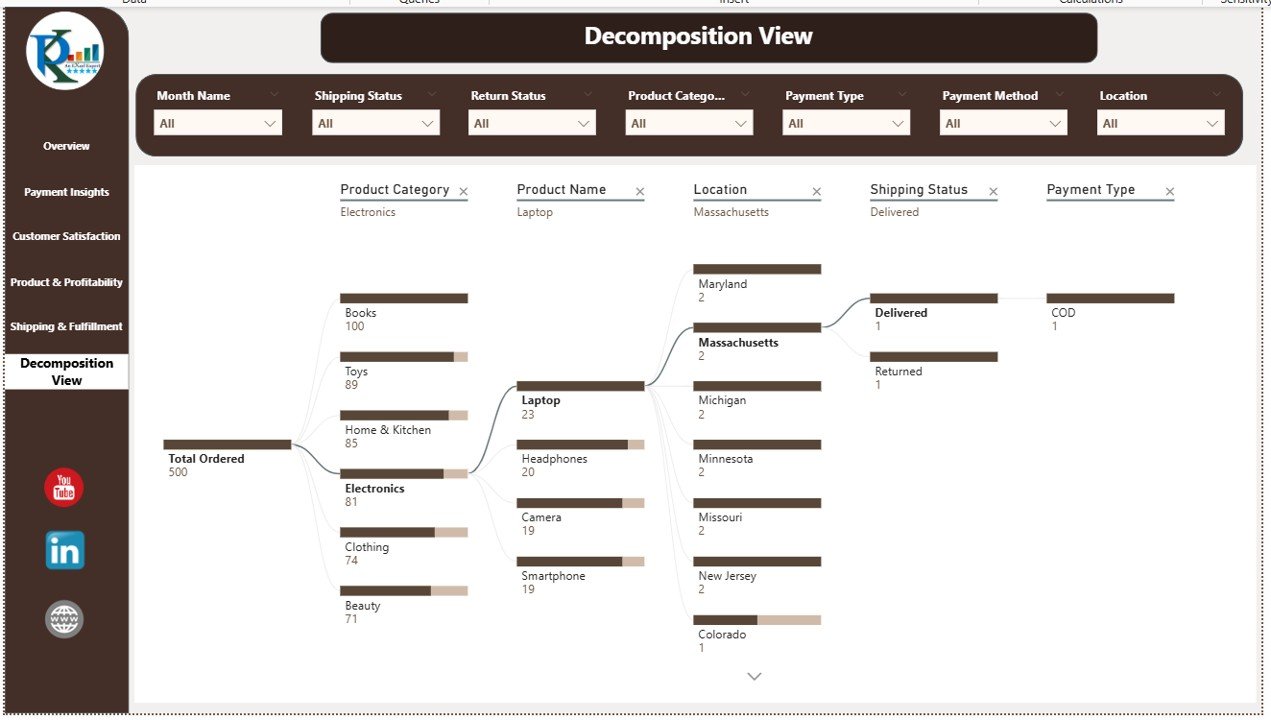
🌳 Decomposition View – Drill-Down Analysis
-
Use Power BI’s decomposition tree to break down revenue, orders, or profit by multiple dimensions such as category, region, or customer type.
📦 What’s Inside the E-commerce Dashboard?
✅ Power BI File – Fully built with interactive visuals and slicers
✅ Overview Page – Comprehensive sales, revenue, and shipping snapshot
✅ Payment Insights Page – Payment trends and performance
✅ Customer Satisfaction Page – Ratings and feedback analysis
✅ Product & Profitability Page – Sales vs. margin performance
✅ Shipping & Fulfillment Page – Logistics and delivery monitoring
✅ Decomposition View Page – Custom drill-down analysis
✅ Data Connection-Ready – Works with Excel, CSV, or database feeds
✅ Customizable Layout – Add KPIs, visuals, and filters as needed
🧠 How to Use the E-commerce Dashboard
-
Load Your Data – Connect your sales, shipping, and feedback data to the Power BI file.
-
Filter & Segment – Use slicers to analyze by product category, location, or time period.
-
Monitor Trends – Identify sales peaks, slow-moving products, and shipping delays.
-
Take Action – Use insights to improve payment processes, enhance customer satisfaction, and boost profitability.
👥 Who Can Benefit from This Dashboard?
-
🏪 E-commerce Store Owners – Stay on top of your KPIs in real time.
-
📈 Sales & Marketing Teams – Track campaign performance and sales trends.
-
🛠 Operations Managers – Monitor shipping and fulfillment efficiency.
-
📊 Business Analysts – Perform in-depth sales and profitability analysis.
🔗 Click here to read the Detailed blog post
Watch the step-by-step video Demo:


Reviews
There are no reviews yet.