

Digital media agencies handle high-speed operations every single day—campaign launches, budget allocation, tracking performance, optimizing spends, monitoring ROI, and preparing client reports. As workload increases, teams start depending on scattered spreadsheets, emails, and manual updates. This leads to delays, errors, and misaligned decisions.
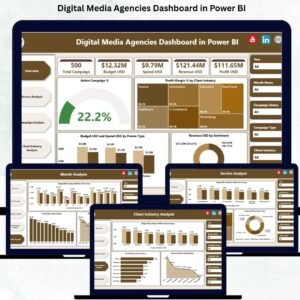
The Digital Media Agencies Dashboard in Power BI solves these problems by bringing all KPIs into a single, automated, and visually powerful dashboard. It shows campaign performance, service profitability, budget vs spend insights, revenue patterns, client industry analysis, and monthly trends within seconds.
The dashboard connects directly with Excel, ensuring that once the backend data updates, all visuals refresh automatically. This helps agencies move from guesswork to rapid, data-driven decision-making.
Let’s explore the complete structure, features, benefits, and usage guidelines of this dashboard.
📌 What Is a Digital Media Agencies Dashboard in Power BI?
A Digital Media Agencies Dashboard in Power BI is a ready-to-use analytical tool designed for:
Digital marketing agencies
Media planning teams
Account managers
Advertisers
Performance marketing teams
Agency leadership
It gives a complete 360° view of:
Campaign performance
Service category efficiency
Client industry profitability
Budget vs spend comparison
Revenue and profit analysis
Monthly performance trends
Because of clean visuals, smart slicers, and automated updates, teams can interpret complex information quickly.
🎯 Why Digital Media Agencies Need This Dashboard
Agencies function in a fast-changing environment:
New campaigns start every week
Ad formats keep evolving
Client budgets change frequently
Profitability depends on quick decisions
Manual reporting slows everything down.
This dashboard solves such challenges by offering:
✔ Real-time visibility
See live performance metrics without waiting for reports.
✔ Faster decision-making
Clear visuals help identify profitable and underperforming areas instantly.
✔ Strong budget and spend tracking
Understand whether the agency is overspending or underutilizing budgets.
✔ Accurate revenue and profit insights
Make informed decisions about pricing, services, and client focus.
✔ Better team alignment
Everyone—from campaign managers to leadership—relies on the same trusted data.
📊 Key Features of the Digital Media Agencies Dashboard
The dashboard includes five powerful analytical pages, each focusing on a critical area of digital marketing.
🟦 1. Overview Page — Your Complete Agency Snapshot
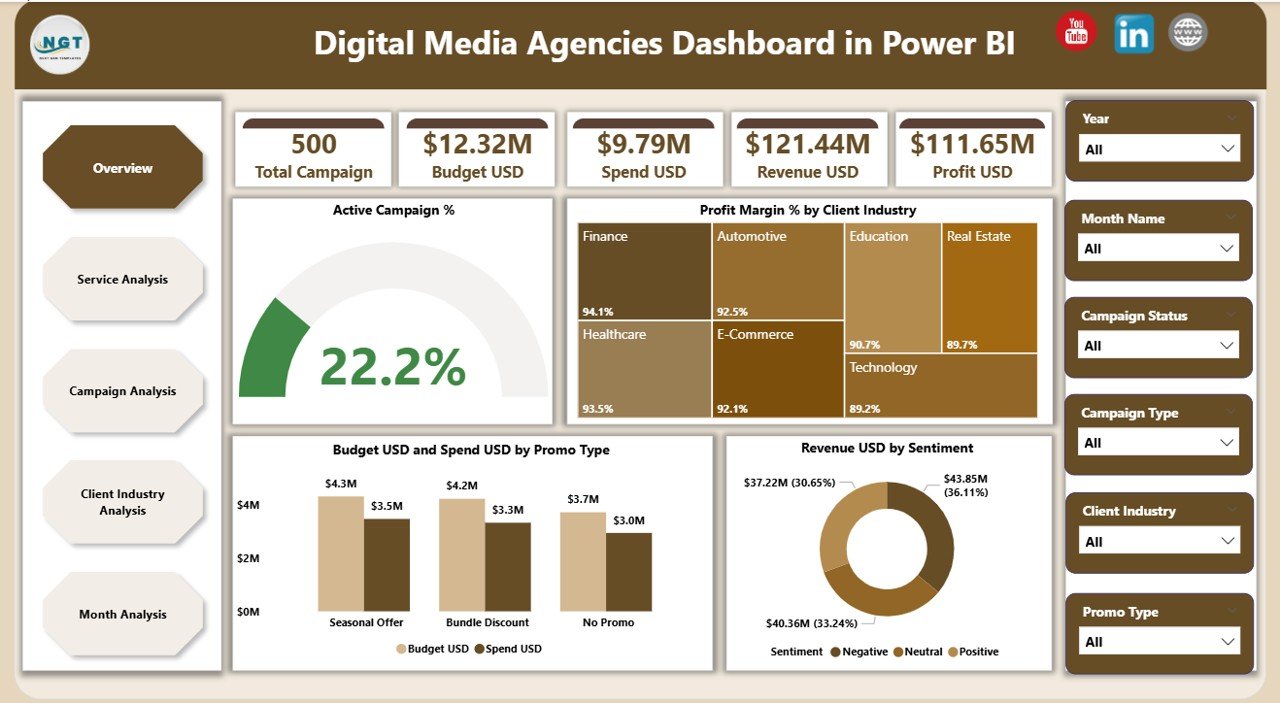
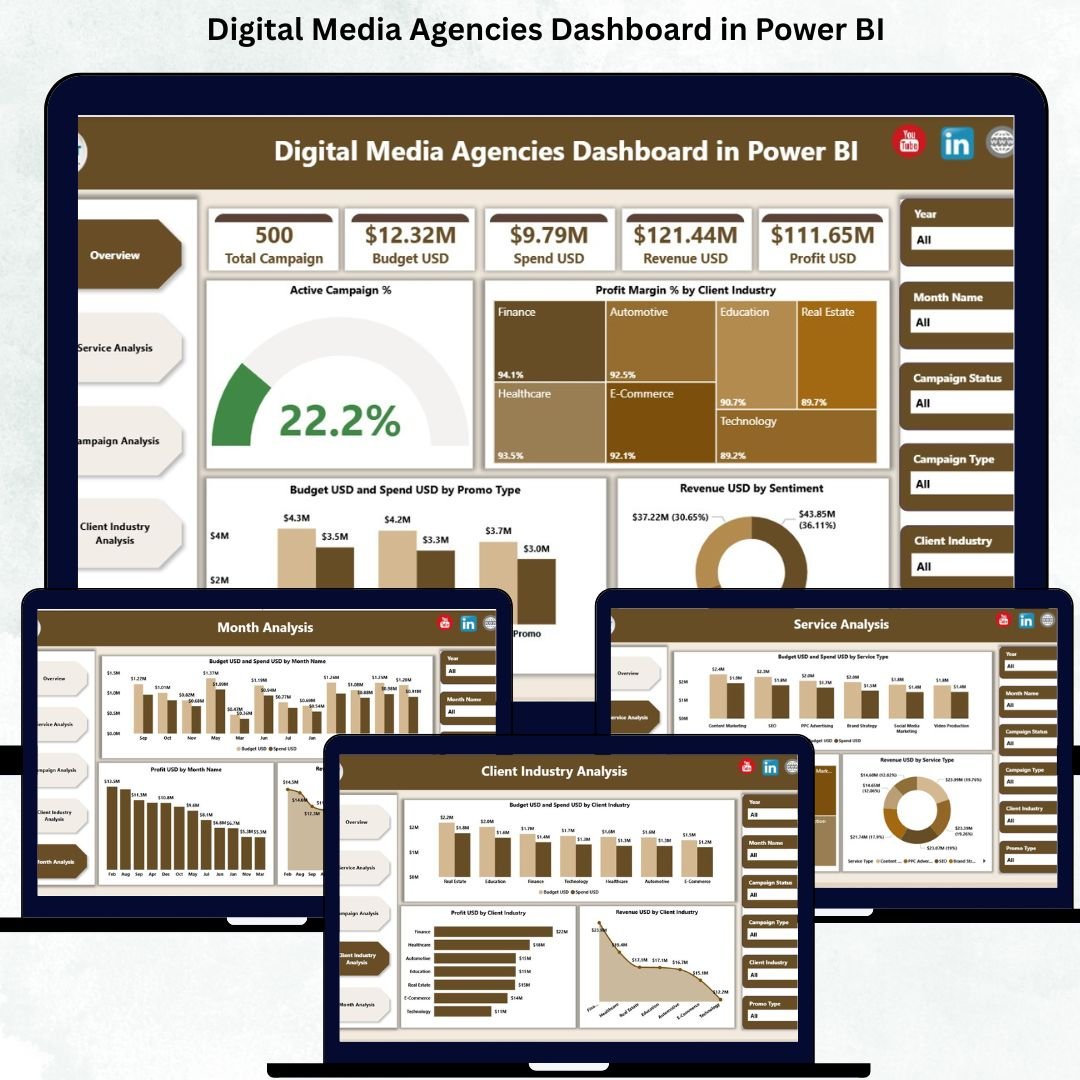
The Overview Page gives a high-level summary of:
⭐ KPI Cards
Active Campaign %
Profit Margin %
Total Budget vs Spend
Total Revenue
⭐ 4 Essential Charts
Active Campaign %
Profit Margin % by Client Industry
Budget USD vs Spend USD by Promo Type
Revenue USD by Sentiment
This page helps you answer:
Are campaigns performing well?
Which industries are profitable?
Is the agency overspending?
What is client sentiment across promotions?
It is designed to give instant clarity—perfect for leadership and daily review meetings.
🟧 2. Service Analysis Page — Which Services Perform the Best?
Every agency offers multiple services:
SEO
Paid Ads
Social Media
Influencer Marketing
Content Marketing
Video Production
Email Campaigns
This page helps you understand the real value each service provides.
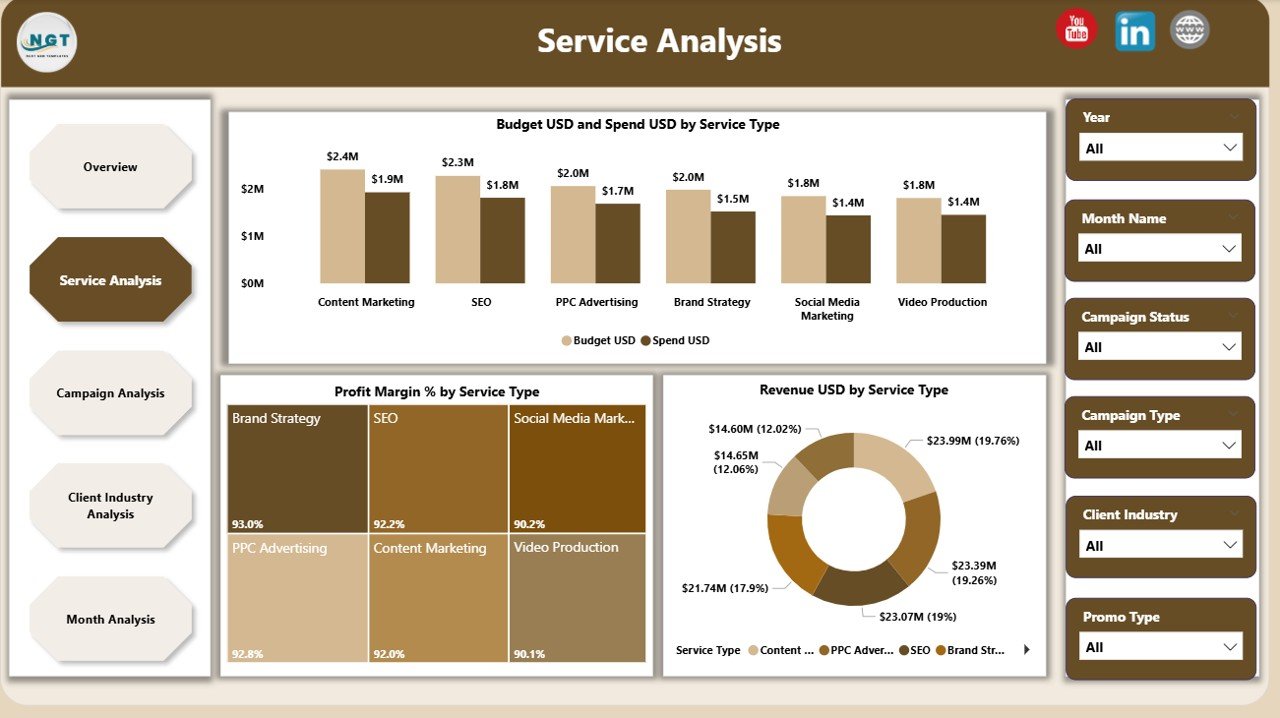
Charts Included:
Budget USD vs Spend USD by Service Type
Profit Margin % by Service Type
Revenue USD by Service Type
It helps answer:
Which service delivers high profit?
Which services exceed budgets?
Which categories need pricing or strategy updates?
🟩 3. Campaign Analysis Page — Deep Performance Insights
Campaigns drive agency results. This page focuses entirely on campaign types such as:
Awareness campaigns
Traffic campaigns
Lead generation
Conversion campaigns
Retargeting campaigns
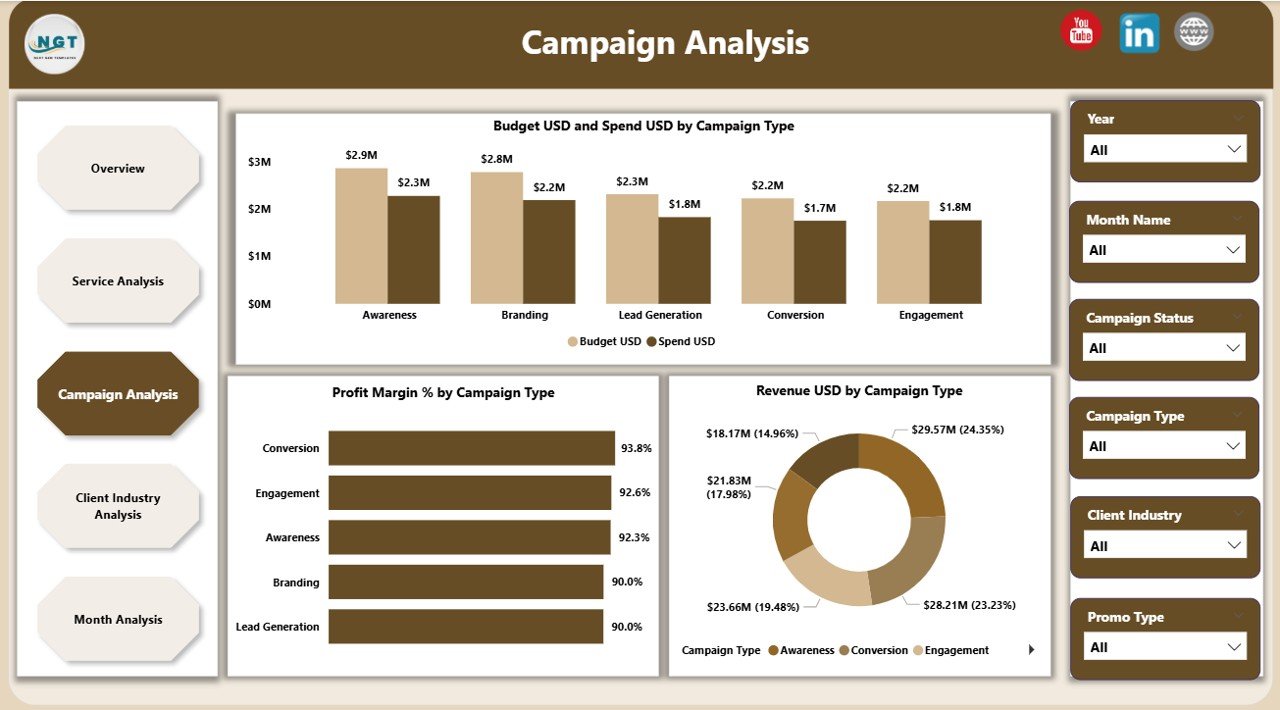
Charts Included:
Budget vs Spend by Campaign Type
Profit Margin % by Campaign Type
Revenue USD by Campaign Type
This helps you see where money is spent wisely—and where ROI needs improvement.
🟪 4. Client Industry Analysis — Revenue & Profit by Industry
Not all client industries perform equally. Some give higher revenue, some require higher budgets, while some are your most profitable segments.
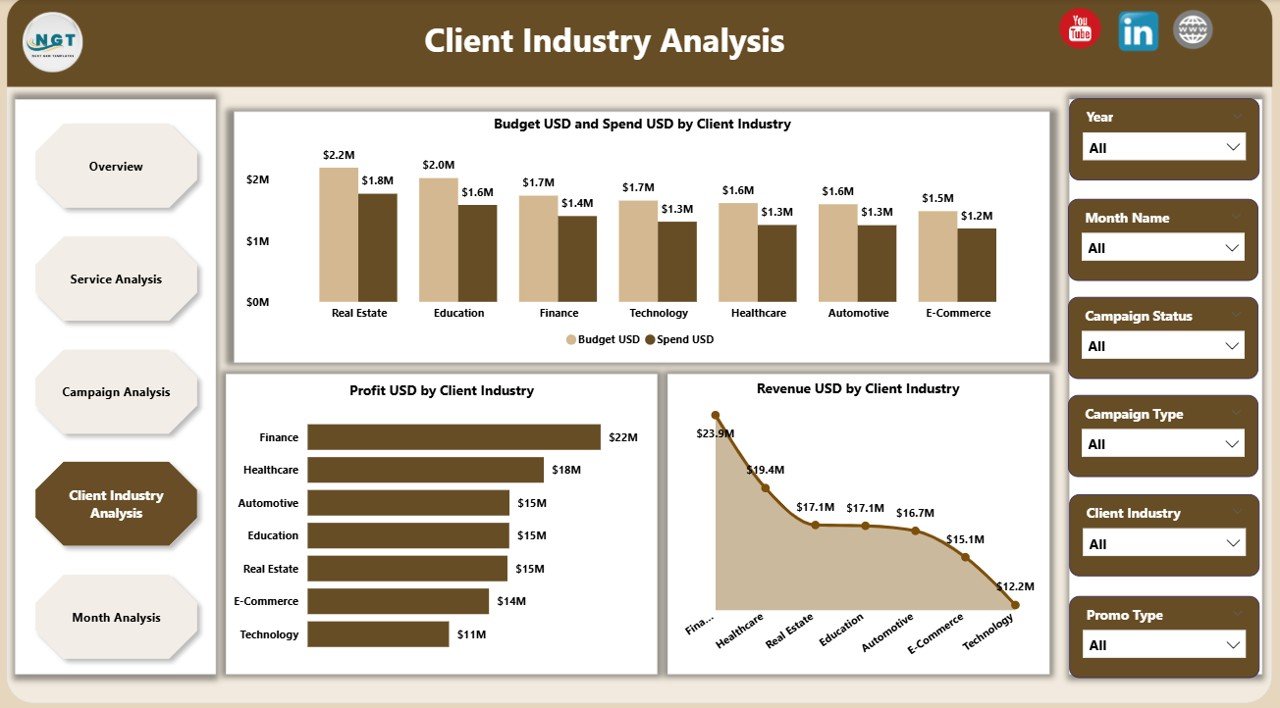
Charts Included:
Budget USD vs Spend USD by Client Industry
Profit USD by Client Industry
Revenue USD by Client Industry
This helps agencies:
Identify their most profitable industries
Decide which industries to target more
Improve pricing strategies
Optimize resource allocation
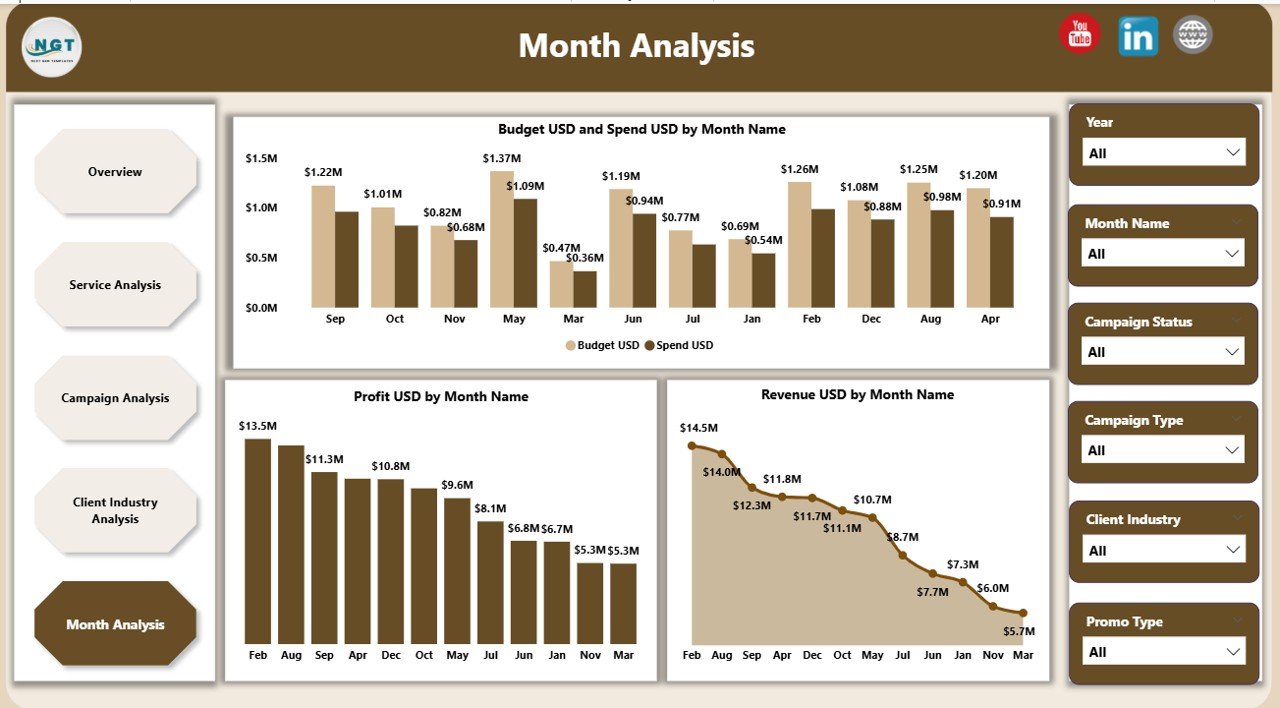
🟫 5. Monthly Trends Page — Understand Seasonal Patterns
Every agency experiences seasonal highs and lows in revenue, campaigns, and profitability.
Charts Included:
Budget USD vs Spend USD by Month
Profit USD by Month
Revenue USD by Month
You get deep clarity on:
Which months perform best
Spending spikes
Seasonal drops
Monthly ROI trends
This improves forecasting and planning for future quarters.
🌟 Advantages of This Dashboard
⭐ 1. Real-time insights
No delays, no manual calculations.
⭐ 2. Complete visibility
Track campaigns, clients, budgets, and profits.
⭐ 3. Better budget management
Avoid overspending and plan more accurately.
⭐ 4. Strong profitability tracking
See profit margins by service, campaign, and industry.
⭐ 5. Better client reporting
Use Power BI visuals to give professional reports.
⭐ 6. Fully automated
Once Excel updates, everything refreshes.
⭐ 7. Zero complexity
Anyone can use it—no technical experience needed.
🧠 Best Practices for Maximum Results
Update Excel data regularly
Review campaign performance weekly
Monitor profit margins closely
Use slicers for deeper insights
Share dashboard access with teams
Compare month-wise trends for forecasting
Track budget vs spend throughout the month
🚀 How This Dashboard Improves Agency Productivity
This dashboard becomes the agency’s single source of truth.
It helps:
Campaign teams optimize performance
Finance teams track spends
Client teams prepare reports fast
Leadership plan strategy confidently
With clarity and automation, productivity increases across the entire agency.
🏁 Conclusion
The Digital Media Agencies Dashboard in Power BI gives agencies a complete, interactive, and professional analytics system. It tracks campaigns, services, industries, monthly trends, budgets, spends, revenue, and profit margins—all in real time.
🔗 Click here to read the Detailed blog post
Visit our YouTube channel to learn step-by-step video tutorials







Reviews
There are no reviews yet.