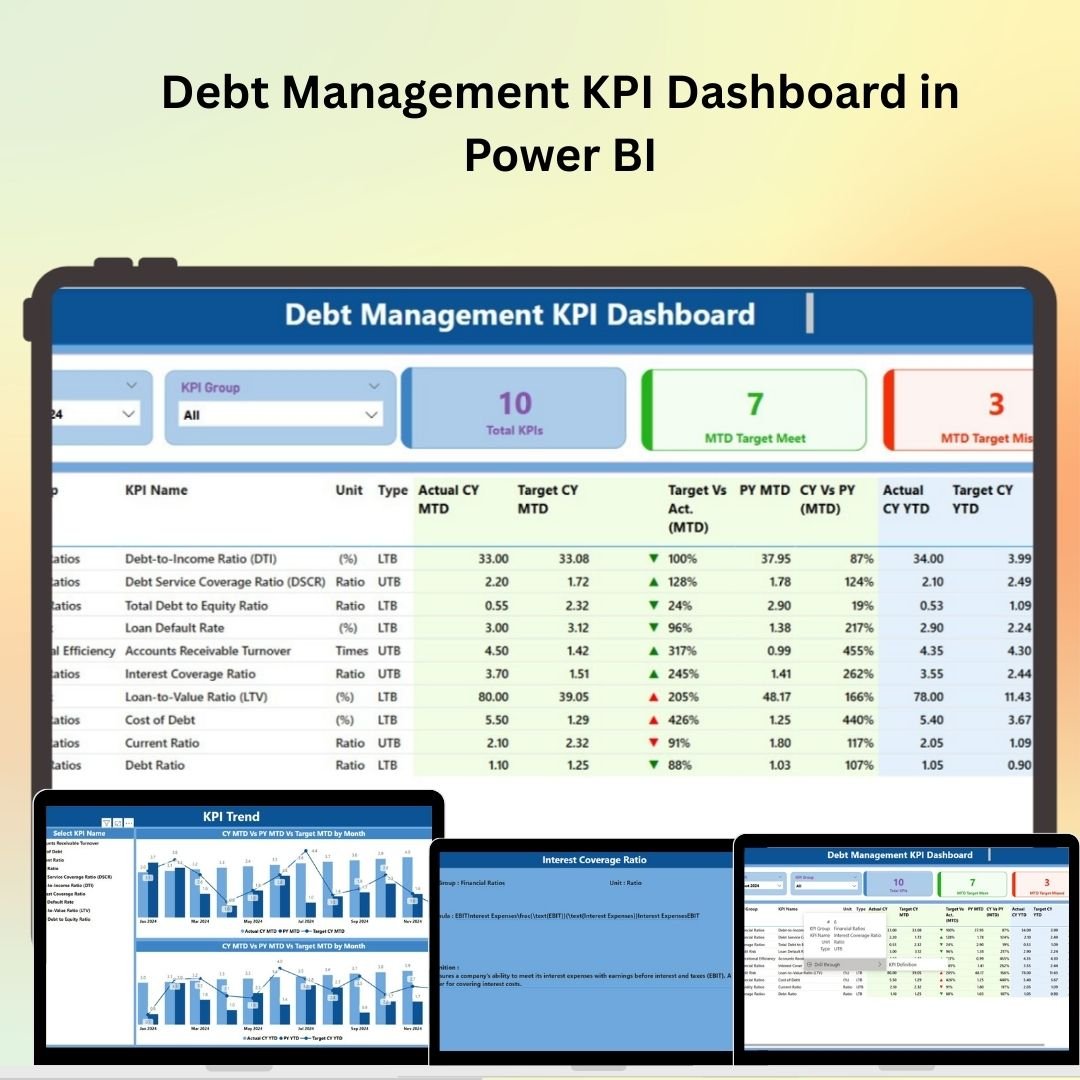
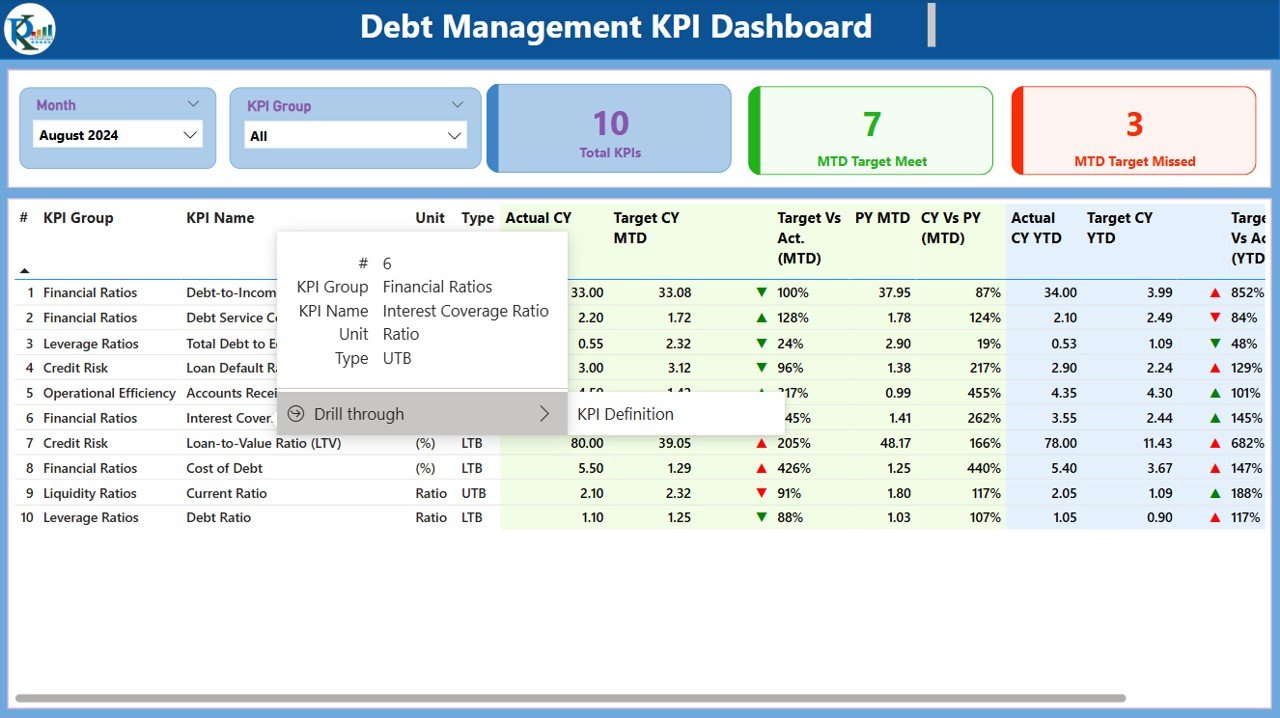
The Debt Management KPI Dashboard in Power BI is an essential tool designed for businesses and financial managers to track, monitor, and visualize debt-related metrics. This comprehensive dashboard provides a detailed view of key performance indicators (KPIs) related to debt management, such as outstanding balances, payment statuses, and overdue amounts. It is ideal for businesses looking to gain insight into their financial health, manage cash flow, and make informed decisions regarding their debt obligations.
With the Debt Management KPI Dashboard in Power BI, you can monitor the performance of debt collection efforts, identify overdue accounts, and analyze trends over time. The dashboard features interactive visualizations, real-time data updates, and custom filters, giving you full control over your debt management strategy.
Key Features of the Debt Management KPI Dashboard in Power BI
📌 Comprehensive Debt Metrics
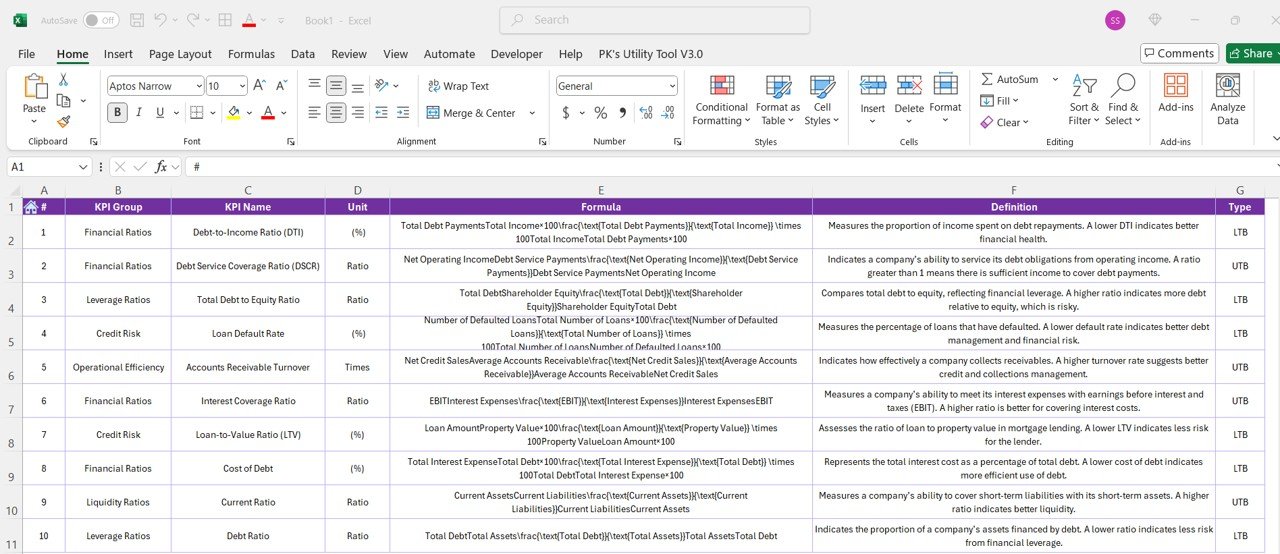
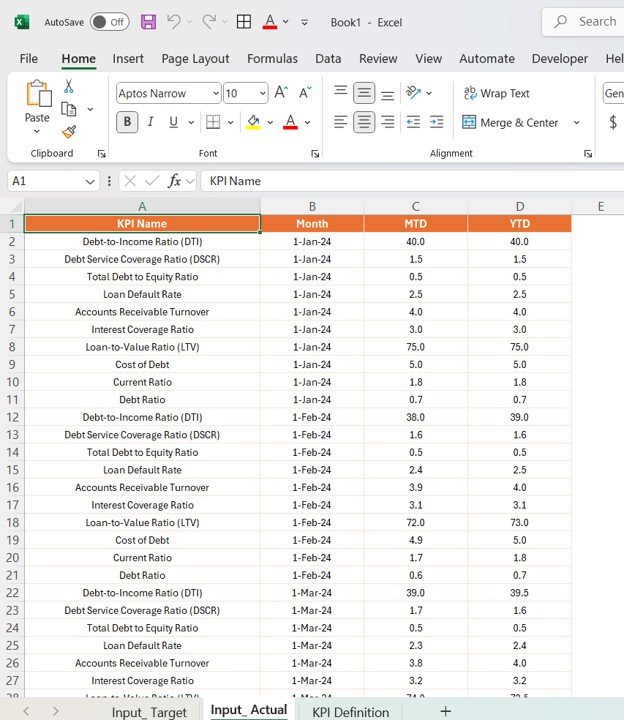
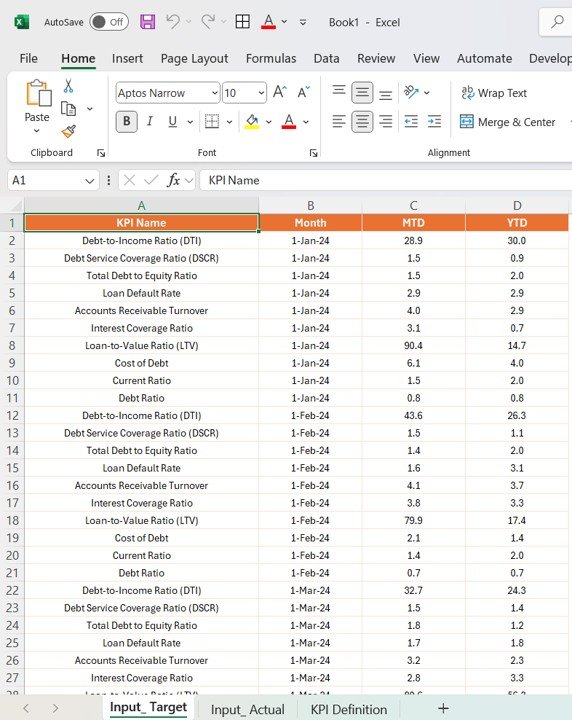
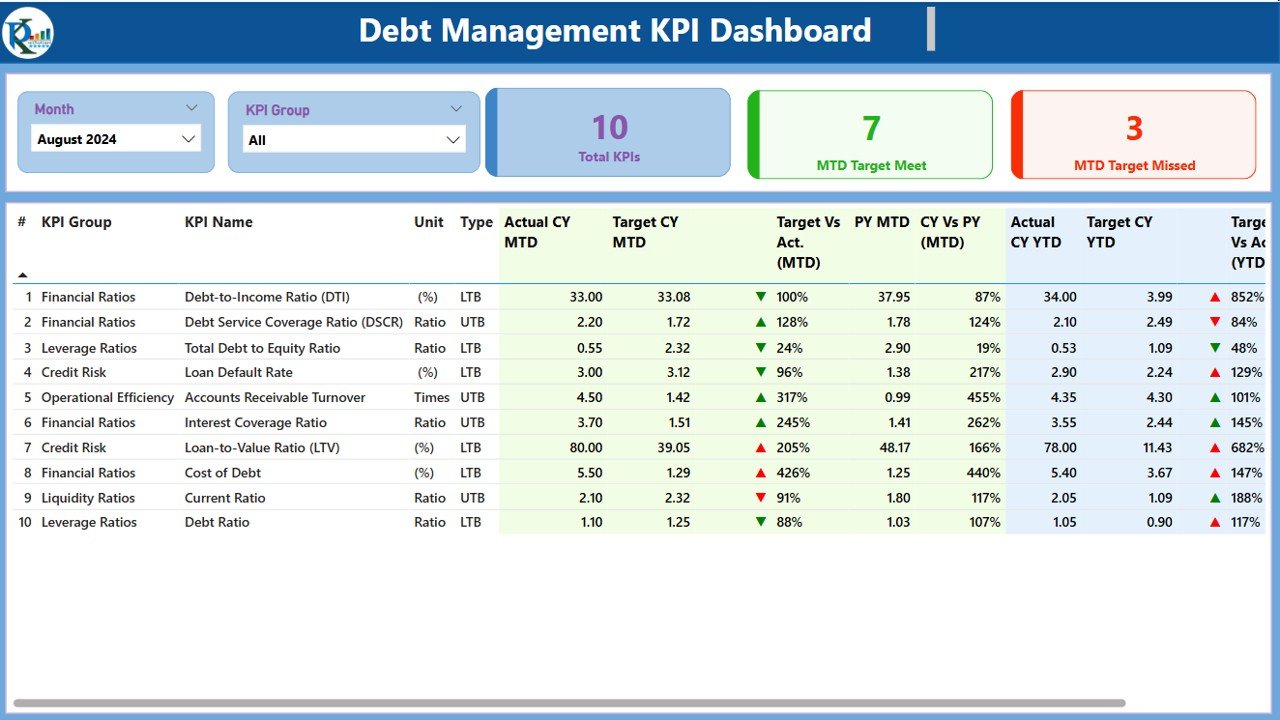
The dashboard includes key metrics such as outstanding debt, overdue amounts, and collection success rates. Track and monitor the status of debts, understand how long payments are taking, and identify problematic accounts quickly.
🛠 Interactive and Dynamic Visualizations
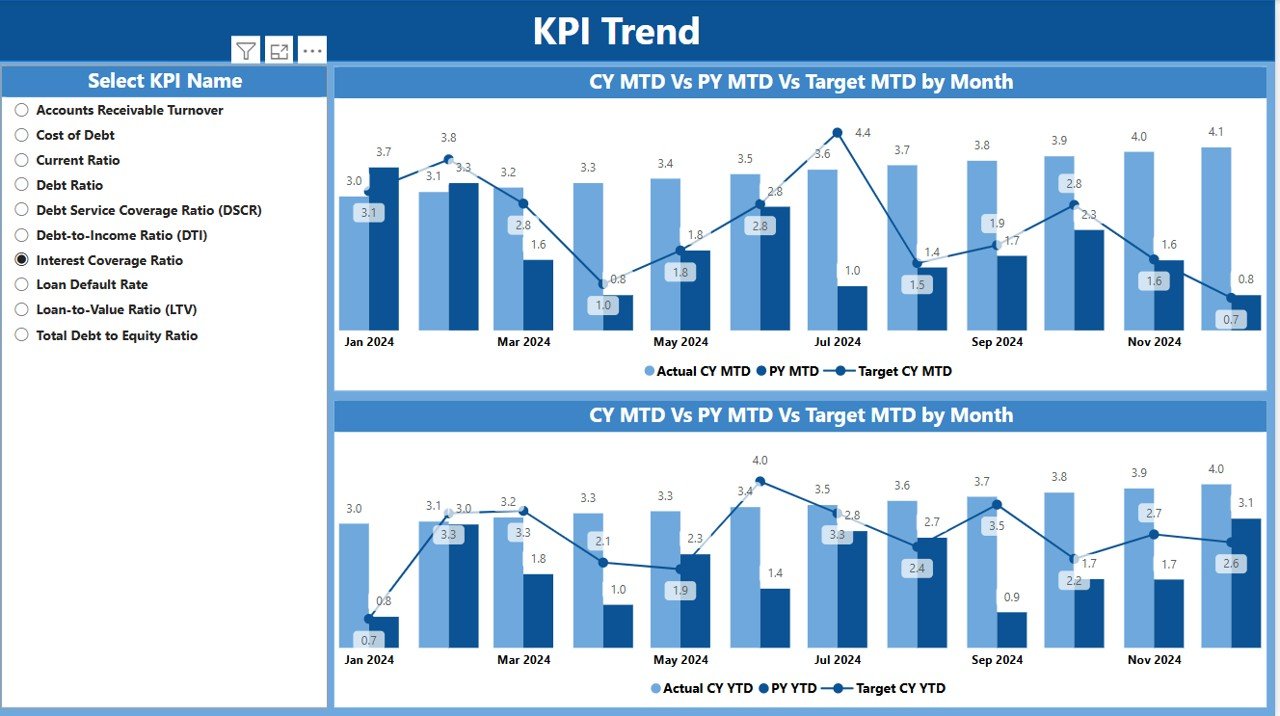
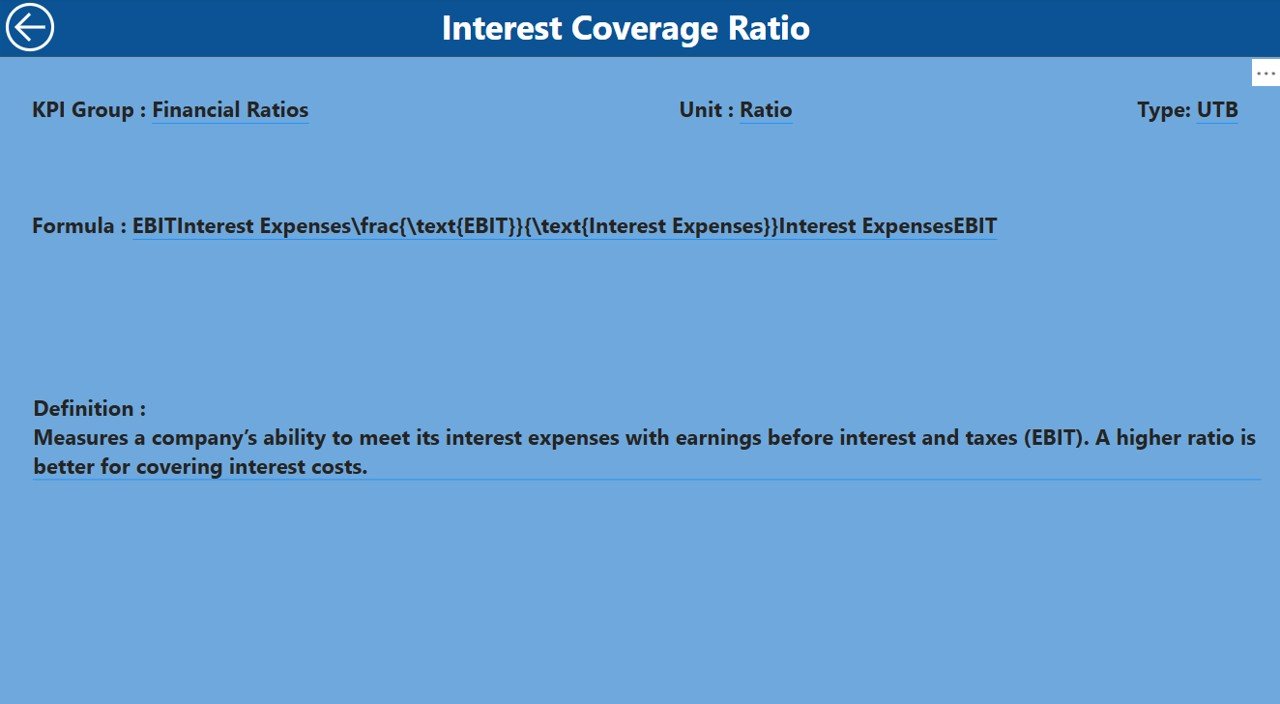
The dashboard features interactive charts, including bar charts, line graphs, and pie charts, allowing you to drill down into specific data points. You can click on different data segments to explore the details behind the numbers, giving you greater control over your analysis.
💡 Real-Time Data Updates
As new data is entered or updated, the dashboard automatically refreshes, ensuring that you’re always working with the most current and accurate information. This real-time functionality allows for faster decision-making and improved operational efficiency.
🔢 Customizable Filters and Segments
Use custom filters to focus on specific data sets. Whether you want to analyze debts by client, by region, or by account age, the filters allow you to view data from different perspectives, making it easier to pinpoint trends and areas of concern.
🚀 Debt Aging Analysis
The dashboard includes a debt aging analysis, which breaks down outstanding debts based on how long they’ve been overdue. This feature helps prioritize collection efforts, ensuring that your team focuses on the most urgent accounts first.
📊 Visual Performance Tracking
Track debt collection performance with clear visual indicators, such as progress bars and KPI meters. Easily measure your success in recovering outstanding amounts and monitor key targets.
⚙ Simple Setup and Customization
Setting up the Debt Management KPI Dashboard in Power BI is easy, even for those with basic experience. With clear instructions and customizable options, you can tailor the dashboard to your specific debt management needs.
🚀 Why You’ll Love the Debt Management KPI Dashboard in Power BI
✅ Track Debt Metrics – Monitor outstanding debts, overdue amounts, and payments. ✅ Interactive and Dynamic Visualizations – Drill down into data with interactive charts and graphs. ✅ Real-Time Updates – The dashboard refreshes automatically as new data is added. ✅ Customizable Filters – Focus on specific data segments with custom filters. ✅ Debt Aging Analysis – Prioritize overdue accounts with aging analysis. ✅ Clear Performance Tracking – Use visual indicators to track debt collection success.
📂 What’s Inside the Debt Management KPI Dashboard in Power BI?
- Debt Collection Metrics: Track outstanding debts, overdue amounts, and payments.
- Interactive Dashboards: Dynamic visualizations that allow you to drill down into data.
- Customizable Filters: Filter data by client, region, or account type to focus on specific areas.
- Debt Aging Analysis: Visualize how long debts have been outstanding and prioritize collections.
- Real-Time Data: The dashboard automatically updates with the latest data.
🔍 How to Use the Debt Management KPI Dashboard in Power BI
1️⃣ Download the Template – Instant access to the Power BI file upon purchase. 2️⃣ Input Your Data – Enter debt-related data into the dashboard template. 3️⃣ Customize Filters – Adjust filters to view data from specific perspectives. 4️⃣ Track and Monitor – Use the interactive charts to track debt performance and overdue amounts. 5️⃣ Present and Share – Share the dashboard with stakeholders for data-driven decision-making.
🎯 Who Can Benefit from the Debt Management KPI Dashboard in Power BI? 🔹 Financial Managers
🔹 Debt Collection Agencies
🔹 CFOs and Finance Teams
🔹 Business Owners
🔹 Credit Managers
🔹 Anyone involved in managing debt and cash flow
Gain complete control over your debt management efforts with the Debt Management KPI Dashboard in Power BI. Track debt collection performance, analyze overdue amounts, and make informed decisions with this interactive, real-time dashboard.
Click here to read the Detailed blog post
https://www.pk-anexcelexpert.com/debt-management-kpi-dashboard-in-power-bi/


Reviews
There are no reviews yet.