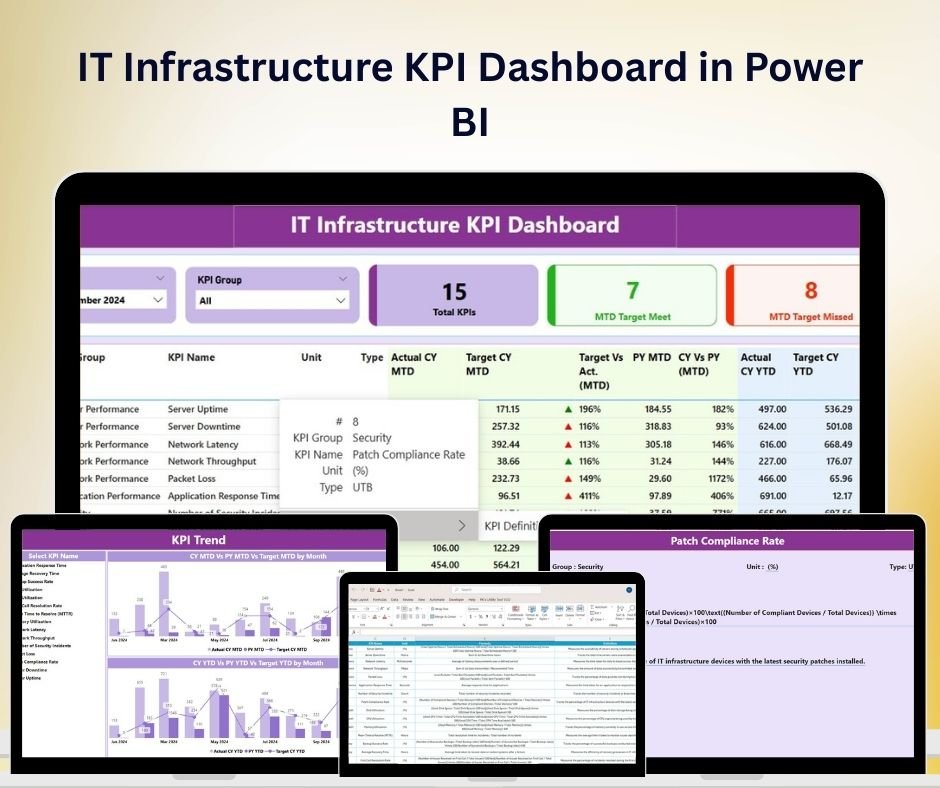
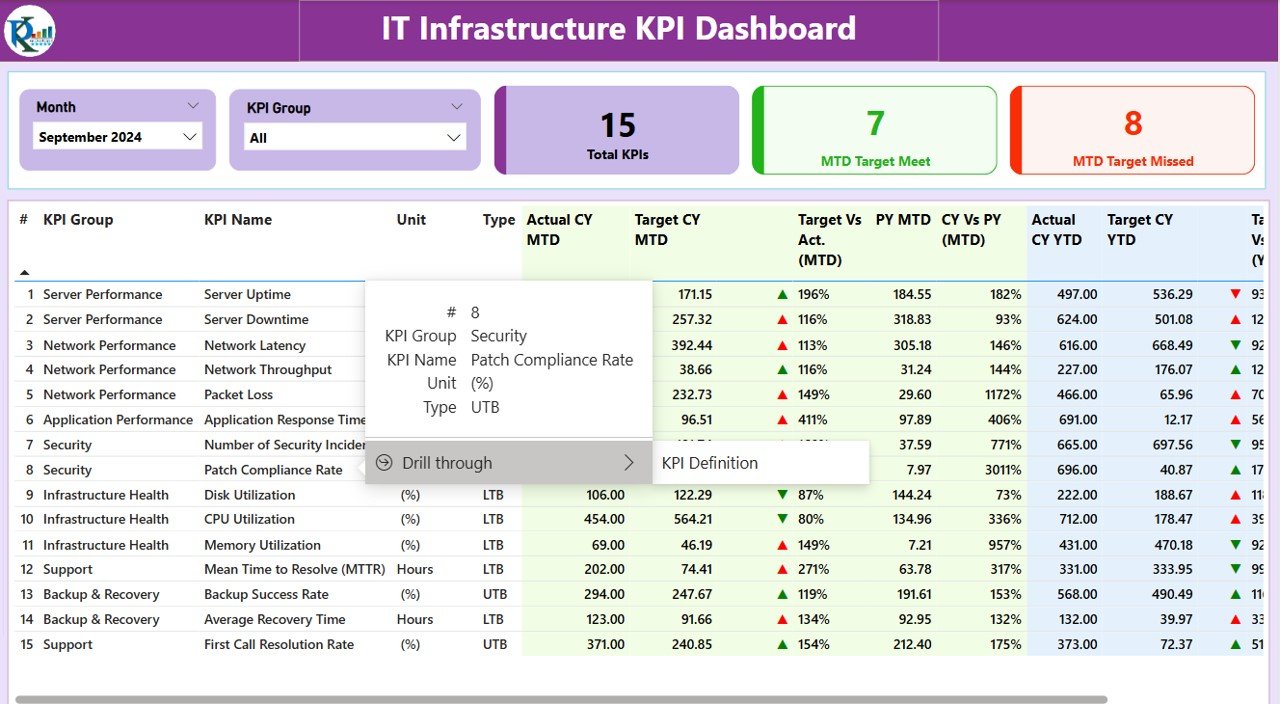
The IT Infrastructure KPI Dashboard in Power BI is a comprehensive tool designed to help IT managers, system administrators, and business owners track and optimize the performance of their IT infrastructure. This Power BI-based dashboard offers real-time insights into key metrics such as system uptime, network performance, server health, and resource utilization, enabling you to identify potential issues and improve overall infrastructure efficiency.
By monitoring these critical KPIs, businesses can ensure optimal performance, minimize downtime, and improve the reliability of their IT systems. Whether you’re managing a small business IT setup or overseeing large-scale enterprise infrastructure, this customizable dashboard offers powerful insights that are easy to interpret and act upon.
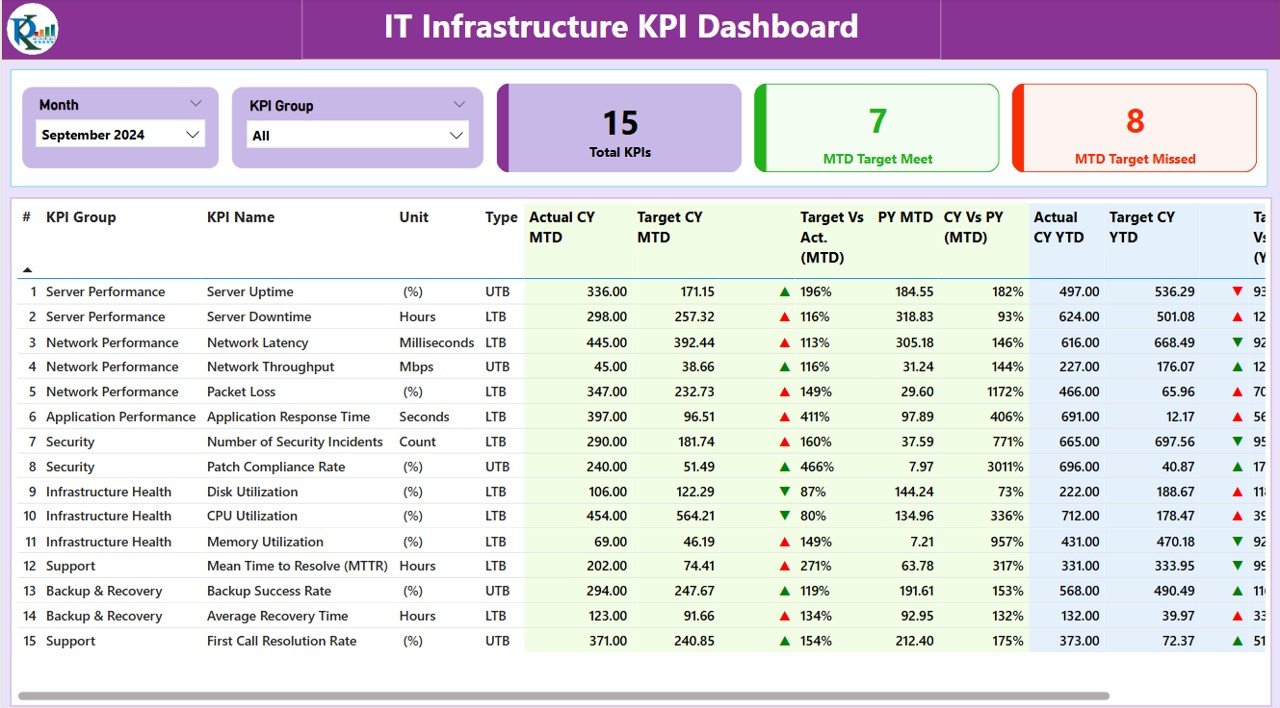
Key Features of the IT Infrastructure KPI Dashboard in Power BI
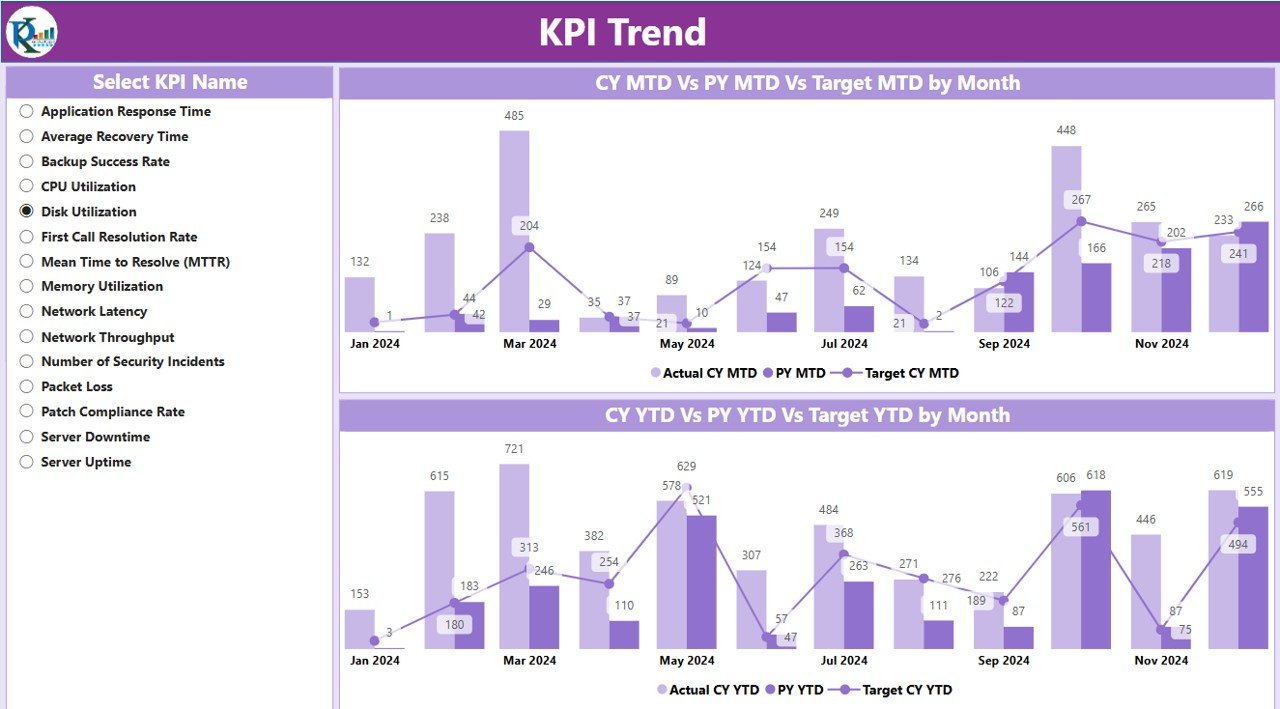
📊 System Uptime Monitoring
Track the uptime and availability of your systems, ensuring minimal downtime. Quickly identify if any system or service is unavailable and take immediate corrective actions.
💻 Network Performance Analysis
Monitor network performance, including latency, bandwidth usage, and packet loss. This helps ensure seamless connectivity and reliable communication across your IT systems.
⚙️ Server Health Monitoring
Keep an eye on server performance by tracking CPU usage, memory usage, and disk space. Identify potential issues before they cause service disruptions and proactively manage system resources.
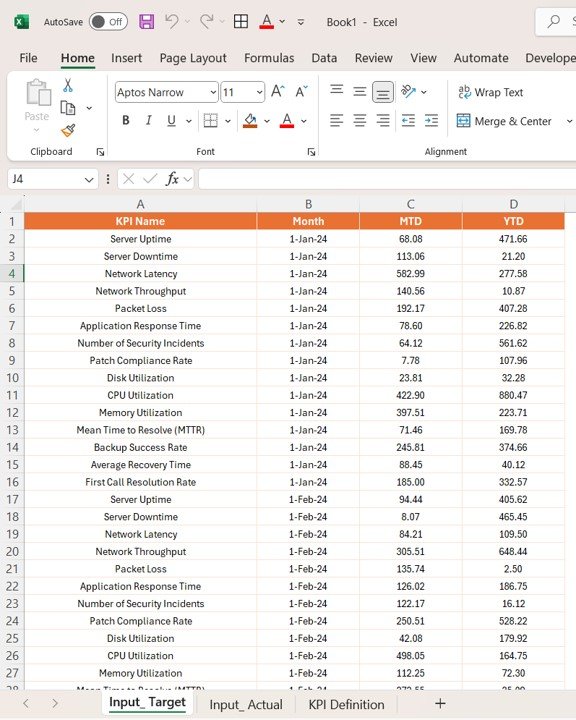
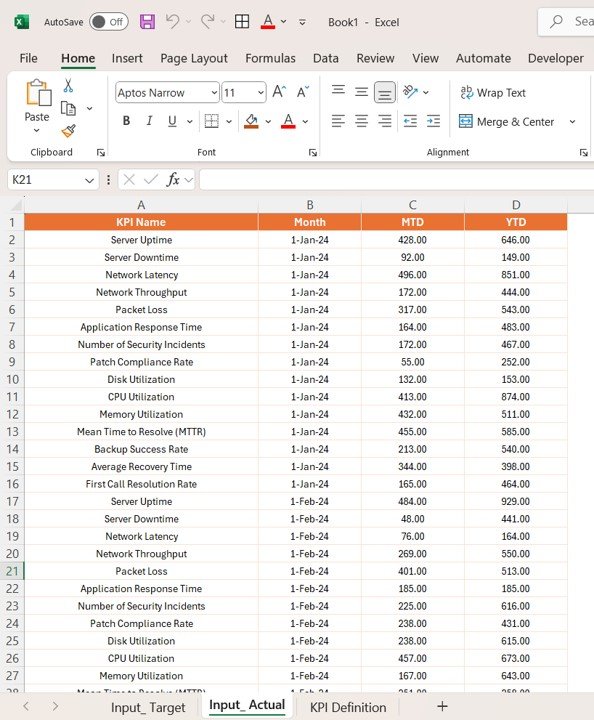
📅 Resource Utilization Tracking
Track resource utilization for critical IT infrastructure components, including storage, processing power, and network bandwidth. Optimize usage and ensure resources are allocated efficiently.
📉 Incident & Downtime Reporting
Monitor incidents, outages, and downtimes in real-time. Generate reports to track how much downtime occurred and identify patterns that need to be addressed.
🔄 Customizable & Scalable Dashboard
Customize the dashboard to reflect your IT department’s specific KPIs. Add new metrics, adjust visualizations, and scale the dashboard to fit your organization’s needs.
Why You’ll Love the IT Infrastructure KPI Dashboard in Power BI
✅ Track IT System Performance in Real Time
Monitor key infrastructure components like uptime, resource usage, and server health in real time to ensure optimal system performance.
✅ Minimize Downtime & Improve Efficiency
Identify potential issues early and take corrective action to minimize system downtimes. Proactively manage your IT resources and avoid costly interruptions.
✅ Optimize Network & Resource Utilization
Track network performance and resource utilization to optimize bandwidth and system resources. Improve efficiency by identifying underutilized resources.
✅ Data-Driven Decision Making
Leverage the insights from the dashboard to make informed decisions that improve your IT infrastructure. Use historical data to spot trends and plan for future system upgrades.
✅ Customizable to Fit Your Needs
Whether you’re managing a small or large-scale IT infrastructure, the dashboard can be customized to suit your needs, giving you control over which metrics are tracked and how they’re displayed.
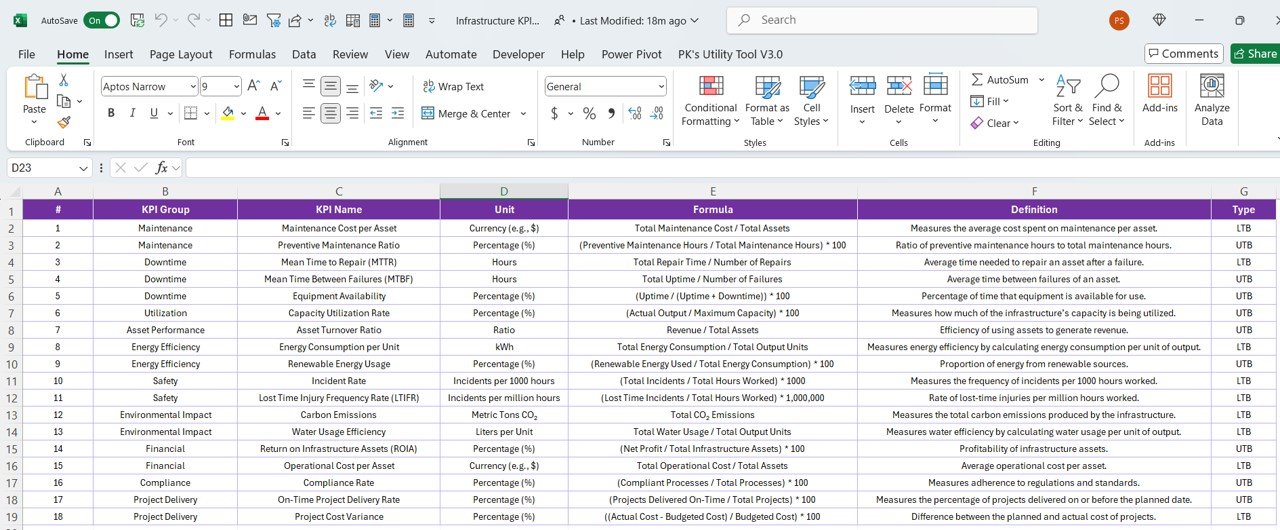
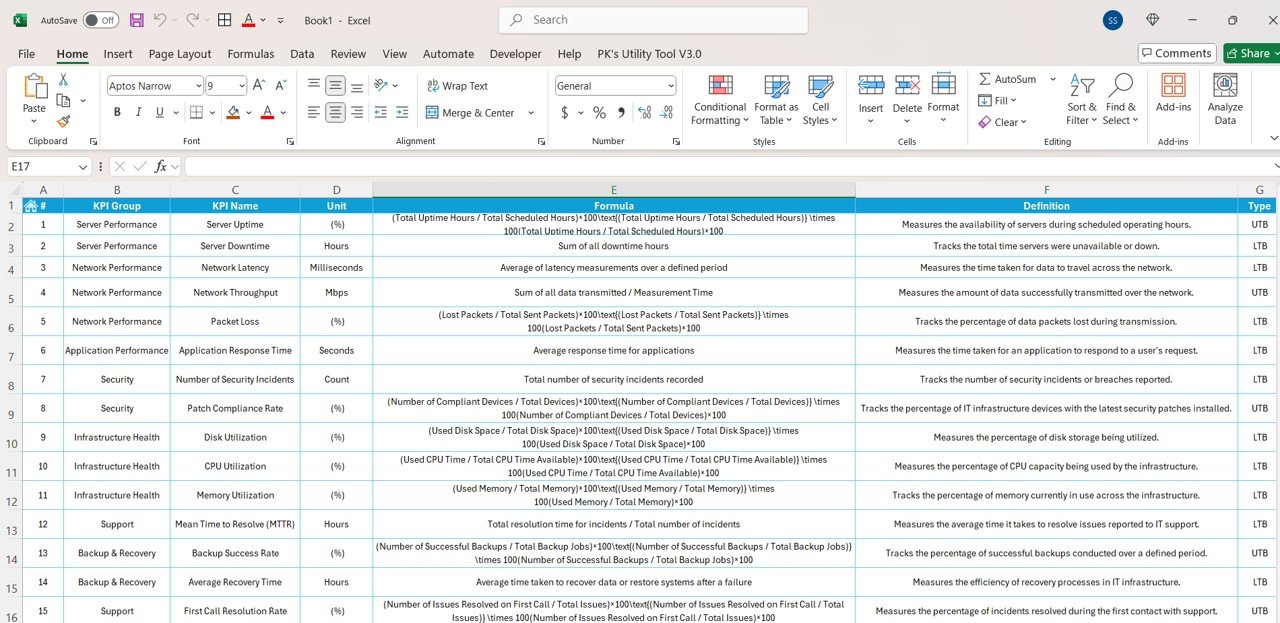
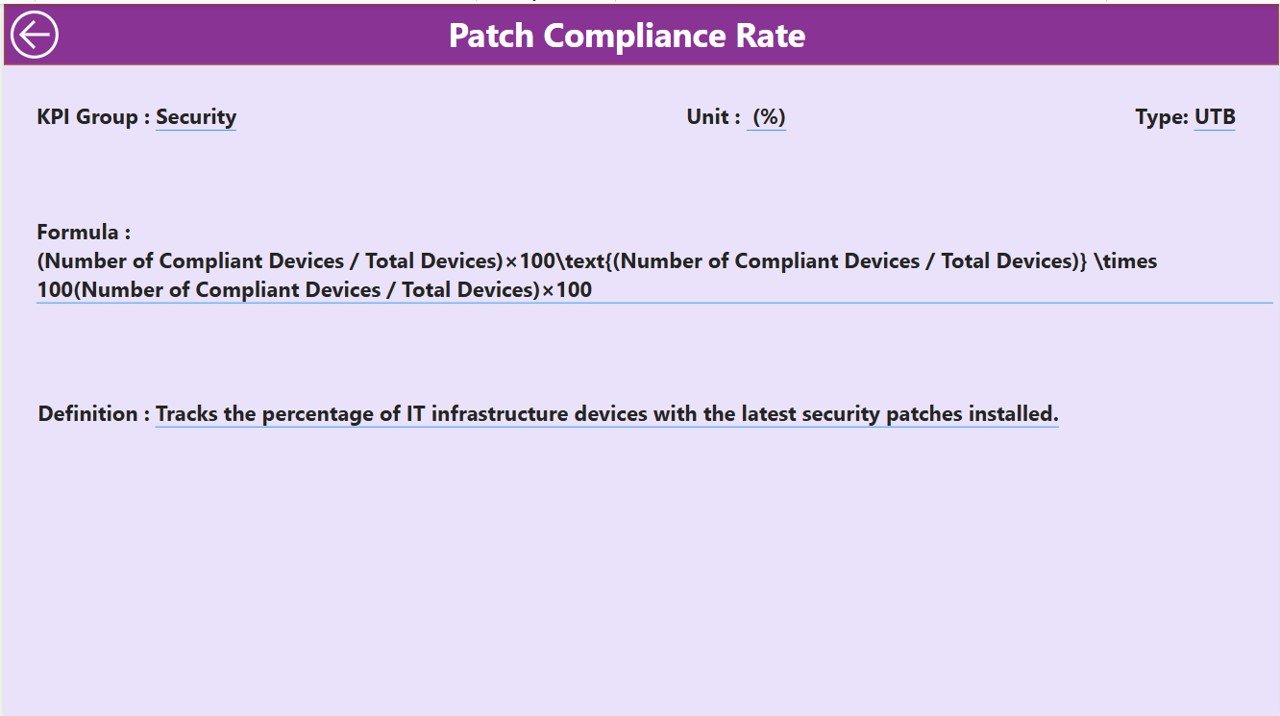
What’s Inside the IT Infrastructure KPI Dashboard in Power BI?
-
System Uptime Monitoring: Track the availability of critical systems and services.
-
Network Performance Analysis: Monitor network latency, bandwidth, and packet loss.
-
Server Health Monitoring: Track server performance metrics like CPU, memory, and disk usage.
-
Resource Utilization Tracking: Monitor the allocation of IT resources across your infrastructure.
-
Incident & Downtime Reporting: Track downtime incidents and generate detailed reports.
-
Customizable Features: Adjust the dashboard to suit your infrastructure needs.
How to Use the IT Infrastructure KPI Dashboard in Power BI
1️⃣ Download the Template: Get access to the IT Infrastructure KPI Dashboard in Power BI instantly.
2️⃣ Integrate Your Data Sources: Connect your system monitoring tools and data sources to the dashboard.
3️⃣ Track Performance Metrics: Monitor real-time performance, uptime, and resource usage of your IT infrastructure.
4️⃣ Analyze & Optimize Resources: Use the resource utilization data to optimize system performance and resource allocation.
5️⃣ Generate Reports & Improve Efficiency: Generate downtime and incident reports to identify areas for improvement and reduce future issues.
Who Can Benefit from the IT Infrastructure KPI Dashboard in Power BI?
🔹 IT Managers & System Administrators
🔹 Network & Server Administrators
🔹 Business Owners & Executives
🔹 IT Infrastructure Teams
🔹 Small & Medium Enterprises (SMBs)
🔹 Large Corporations with Complex IT Infrastructure
🔹 Managed Service Providers (MSPs)
Optimize your IT infrastructure and improve the efficiency of your IT systems with the IT Infrastructure KPI Dashboard in Power BI. Track key performance metrics, minimize downtime, and make informed decisions to ensure your systems run smoothly.
Click here to read the Detailed blog post
Visit our YouTube channel to learn step-by-step video tutorials
Youtube.com/@PKAnExcelExpert


Reviews
There are no reviews yet.