

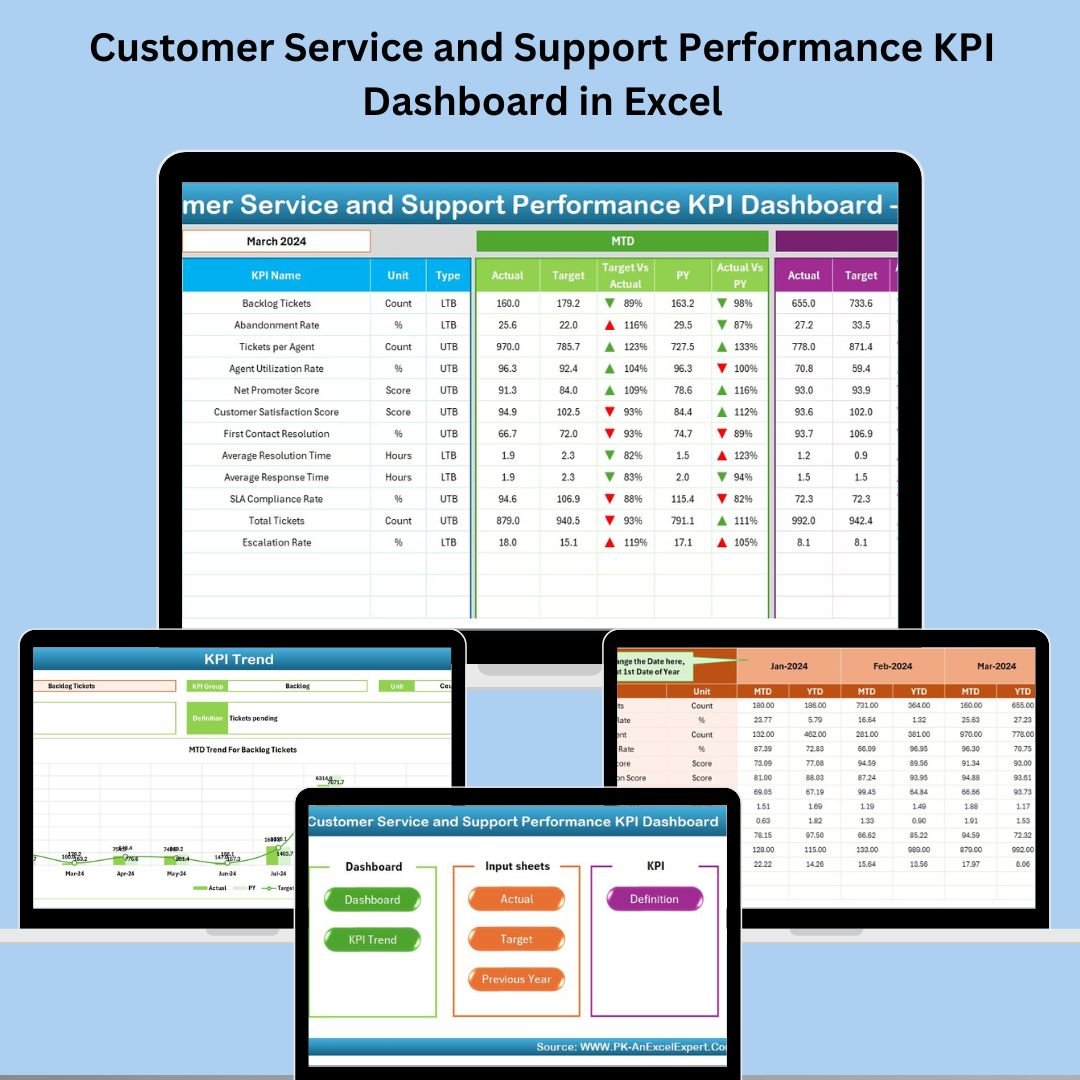
In a world where every second counts and customer loyalty hinges on timely support, you can’t afford to manage service quality based on gut feelings or outdated reports. That’s why the Customer Service and Support Performance KPI Dashboard in Excel is a game-changer.
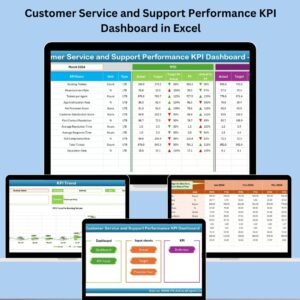
Built entirely in Microsoft Excel, this dynamic dashboard helps you monitor MTD and YTD KPIs, compare them with targets and previous years, and instantly identify bottlenecks—all with no coding or subscription required.
✨ Key Features of the Dashboard
🏠 Home Sheet
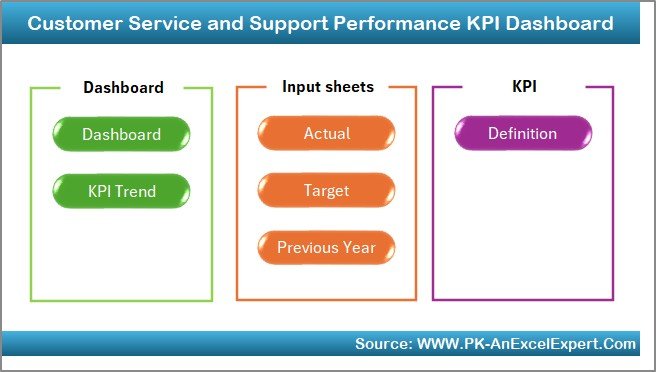
Launchpad with 6 buttons to quickly navigate to relevant sheets
Clean interface for users of any skill level
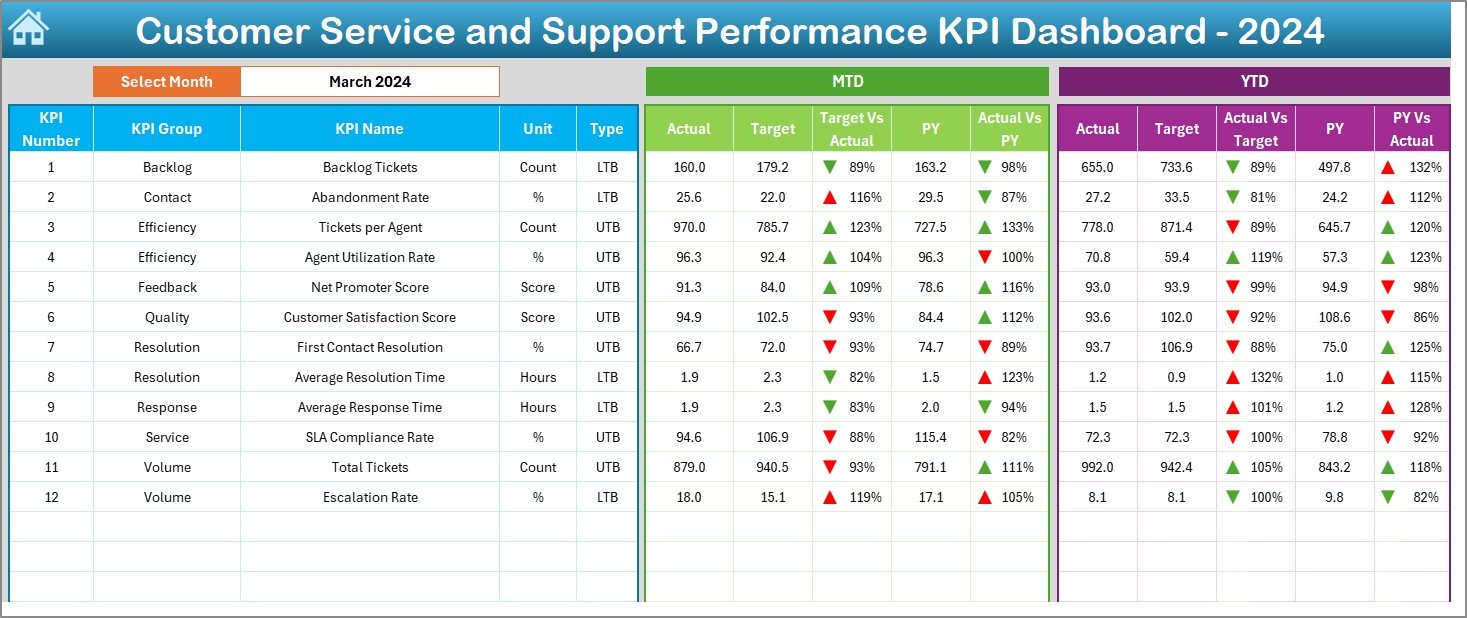
📊 Dashboard Sheet
Visual hub of all KPIs
Select a month in cell D3 to auto-refresh charts and indicators
See:
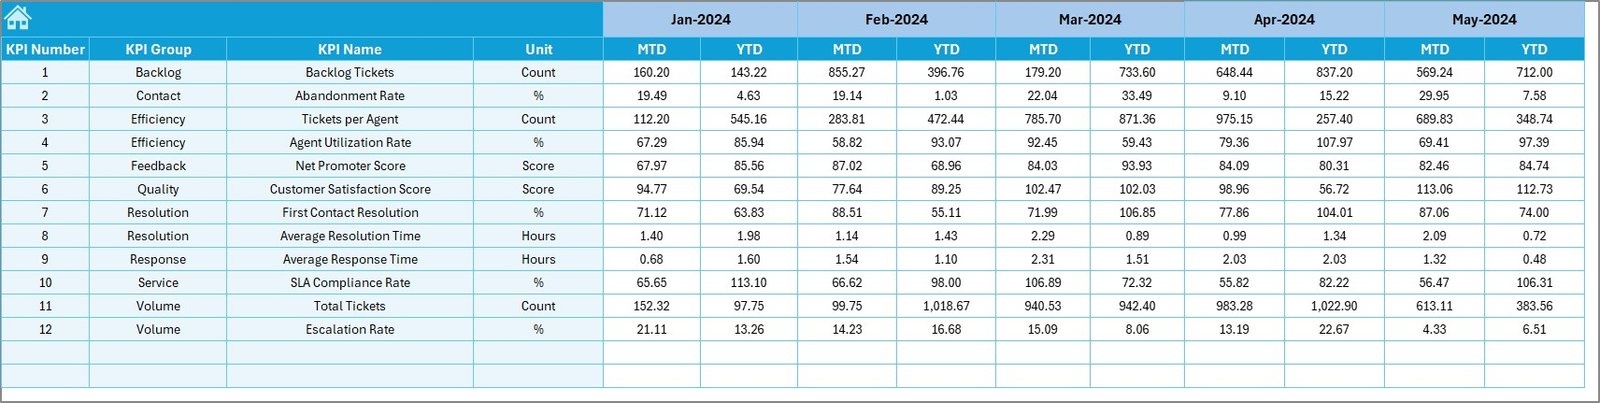
MTD Actual, Target, Previous Year
YTD Actual, Target, Previous Year
Arrows and color indicators showing trends and performance status
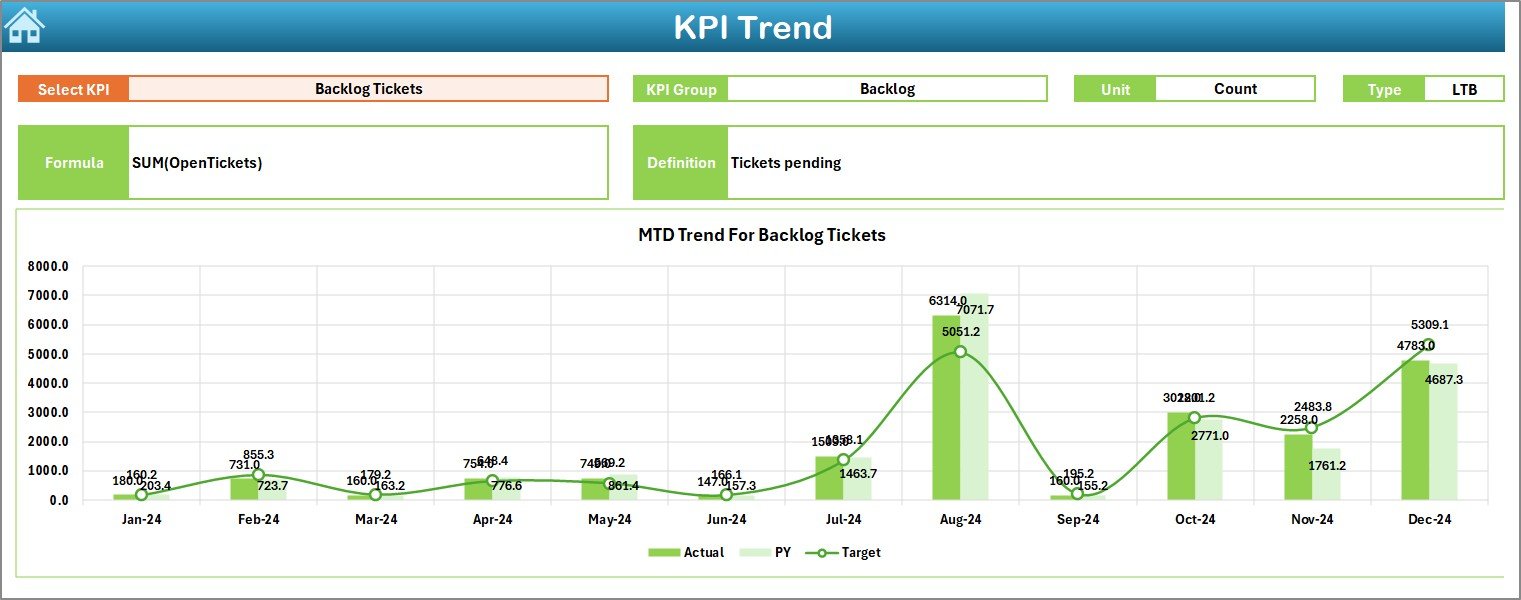
📈 KPI Trend Sheet
Select KPI from dropdown in cell C3
View details like Group, Unit, Formula, and Type (LTB/UTB)
Trend charts comparing MTD/YTD with Target and Previous Year
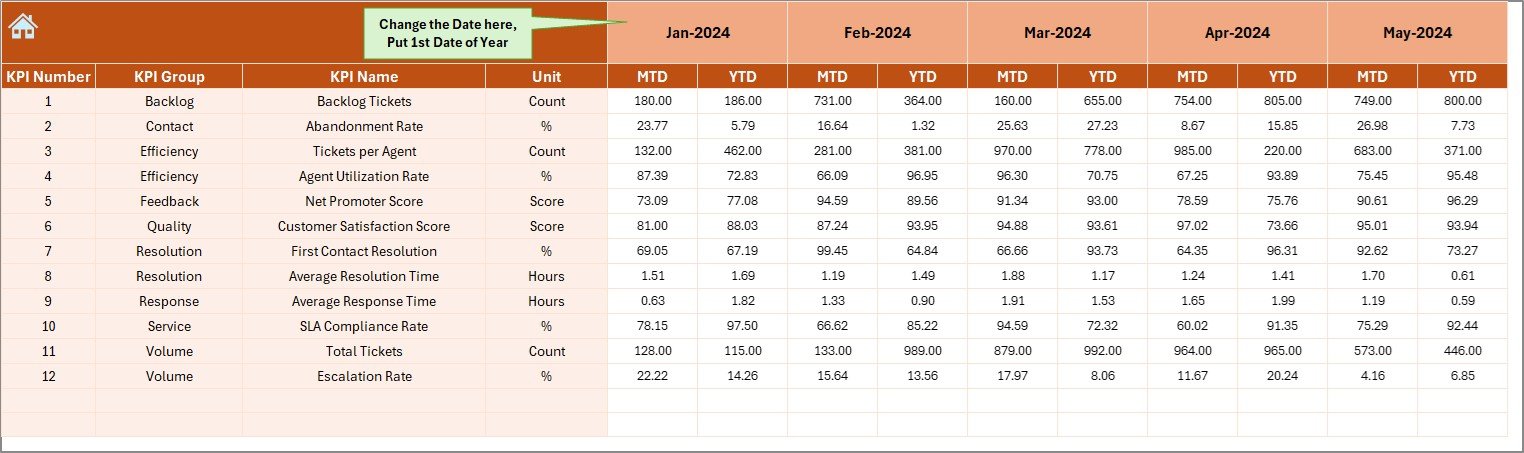
📥 Actual Numbers Input Sheet
Enter performance data per month
Set fiscal year start in cell E1
Seamless format for consistent tracking
🎯 Target Sheet
Input monthly targets for all KPIs
Fields for both MTD and YTD targets
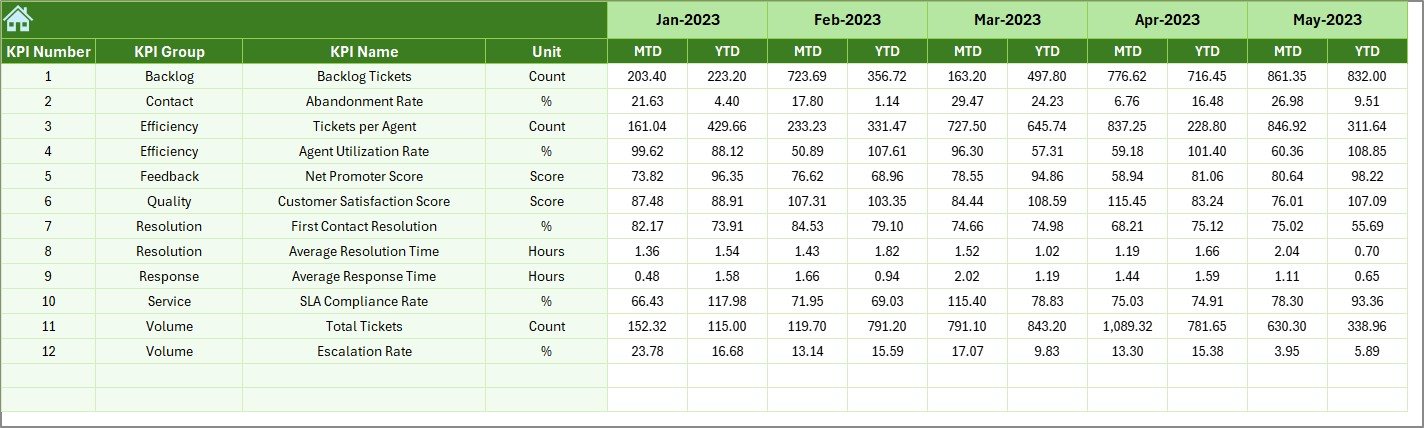
📉 Previous Year Numbers Sheet
Enter historical data for accurate comparison
Mirrors actuals layout for quick updates
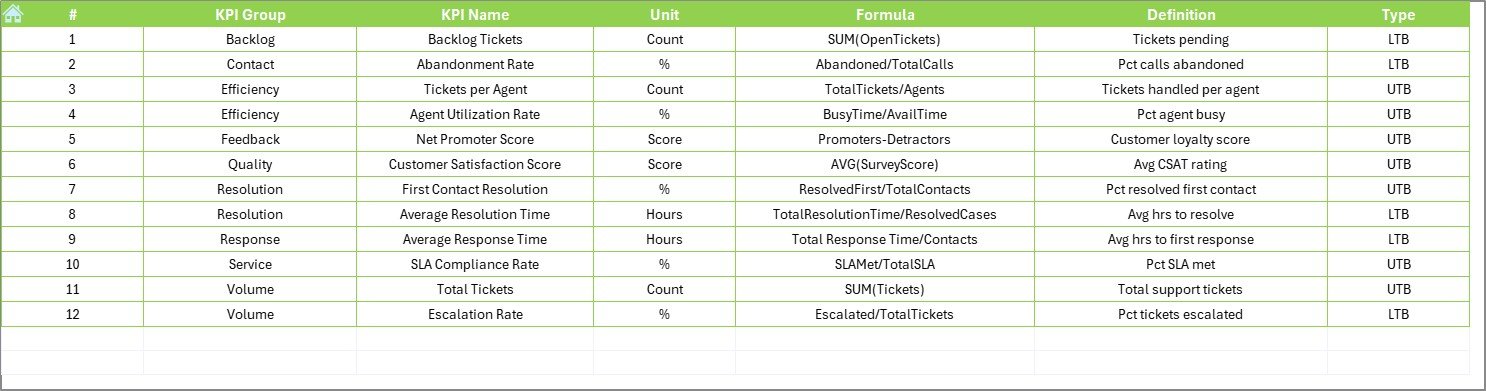
📘 KPI Definition Sheet
Maintain centralized list of all KPI details
Fields include:
KPI Name
KPI Group
Unit
Formula
Type (Lower or Upper the Better)
🧠 Why Use This Excel-Based Dashboard?
Real-Time Performance Monitoring – Instantly visualize how your team is performing
Identify and Fix Gaps – Spot negative trends before they hurt service quality
Data-Driven Decisions – Use facts, not assumptions, to improve processes
Improve Team Accountability – Share dashboard visuals with staff to drive ownership
📈 KPIs Tracked in the Dashboard
| KPI Name | Description | Type |
|---|---|---|
| First Response Time | Time from ticket creation to first reply | LTB |
| Average Resolution Time | Total time to resolve tickets | LTB |
| CSAT Score | Customer satisfaction rating | UTB |
| Ticket Volume | Total tickets received | Monitoring |
| Escalation Rate | Percentage of escalated tickets | LTB |
| Repeat Contact Rate | % of repeated queries by same customer | LTB |
| SLA Compliance | Tickets resolved within agreed SLA | UTB |
All KPIs are fully editable via the KPI Definition Sheet.
✅ Advantages of Using This Excel KPI Dashboard
✅ No Additional Software Needed – Runs on Excel 2016 or later
✅ Customizable and Expandable – Add/remove KPIs or change formulas easily
✅ One-Click Analysis – Select a month and see the whole dashboard update
✅ Highly Visual – Arrows and conditional formatting tell a story at a glance
✅ Offline & Portable – Share over email or use on a cloud platform
🔧 How to Use the Template
Download & Open the file
Set Your Fiscal Start Month (in Actual Numbers Input – Cell E1)
Input Actual Results, month by month
Enter Targets on the Target Sheet
Fill Previous Year Data for benchmark comparison
Select a Month on Dashboard and watch everything update automatically
Analyze KPI Trends with dropdown in KPI Trend Sheet
Customize Definitions or KPIs as per your operations
📌 Best Practices
🔄 Update Monthly – Keep your dashboard current for accurate insights
📚 Define Clear KPIs – Ensure everyone agrees on what’s being measured
🟢🔴 Use Conditional Formatting – Red for declining, green for improving
🧑🤝🧑 Share with Support Teams – Transparency improves accountability
🗂️ Review Trends Quarterly – Schedule regular check-ins for long-term tracking
👥 Who Should Use This?
Customer Support Managers – To track team effectiveness
Call Center Leaders – For measuring SLA compliance and agent KPIs
Operations Directors – For executive-level performance summaries
Small Businesses – With no access to costly CRM analytics tools
Business Analysts – To find patterns and optimize support workflows
💬 Conclusion
The Customer Service and Support Performance KPI Dashboard in Excel is not just another spreadsheet—it’s a complete performance management system. From tracking KPIs and analyzing performance gaps to improving service delivery, this tool empowers your team to act with confidence.
Fully customizable, visually rich, and simple to use—get started today and transform your support outcomes.
📺 Visit our YouTube Channel for step-by-step video tutorials!
🔗 Click here to read the Detailed blog post

























Reviews
There are no reviews yet.