Elevate Your Customer Experience Strategy with Real-Time Performance Insights.
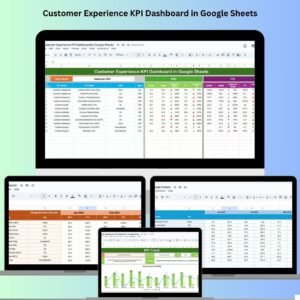
In today’s fast-paced, customer-driven world, measuring and improving the customer journey is critical. The Customer Experience KPI Dashboard in Google Sheets empowers your team to track, analyze, and improve customer satisfaction with real-time metrics.
This interactive, ready-to-use template lets you monitor essential KPIs such as Net Promoter Score (NPS), Customer Satisfaction Score (CSAT), Churn Rate, First Response Time, and more. Whether you’re leading a support team or a CX department, this dashboard provides the clarity and visibility needed to make customer-focused decisions faster and smarter.
Built in Google Sheets, it’s cloud-based, collaborative, and fully customizable.
✨ Key Features of the Customer Experience KPI Dashboard
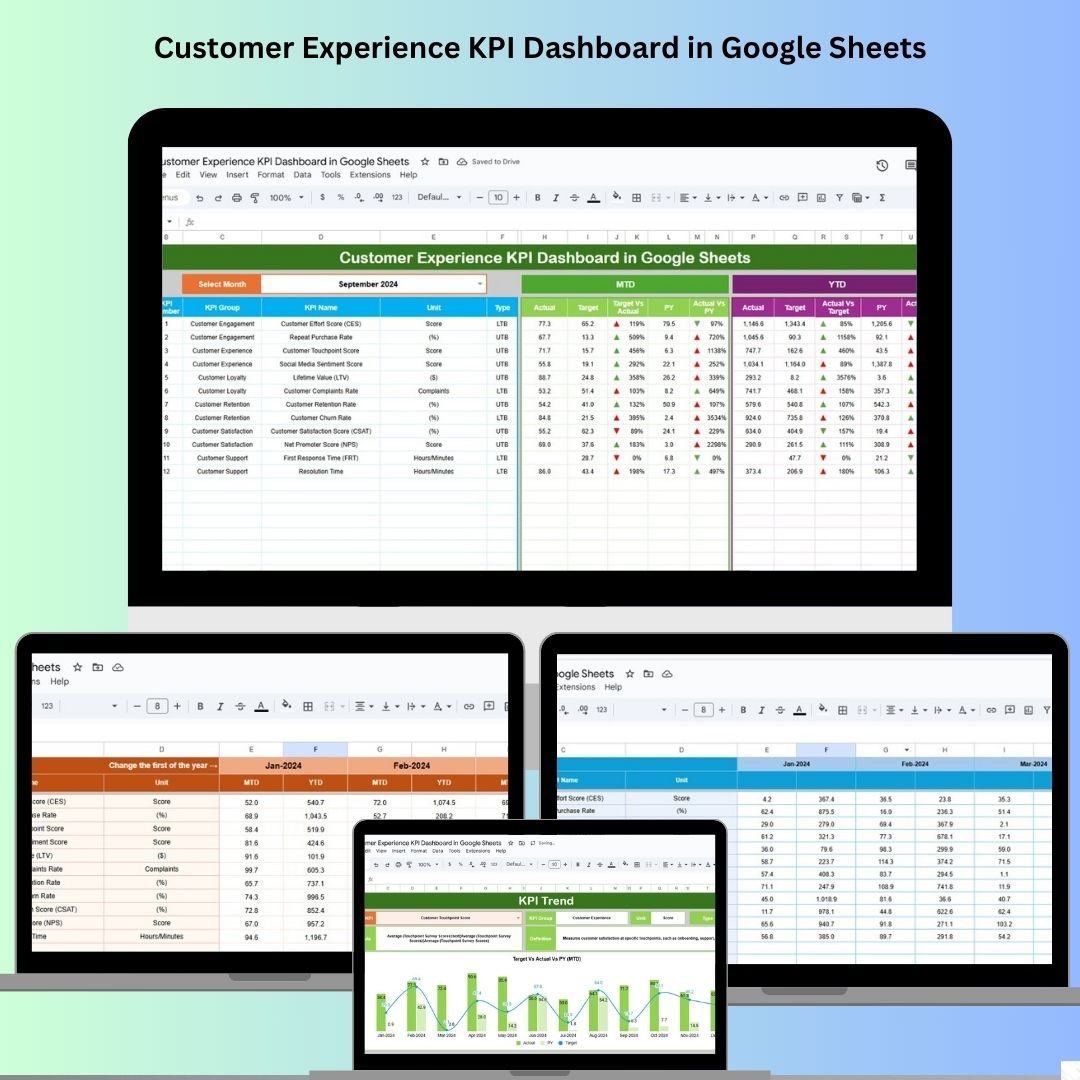
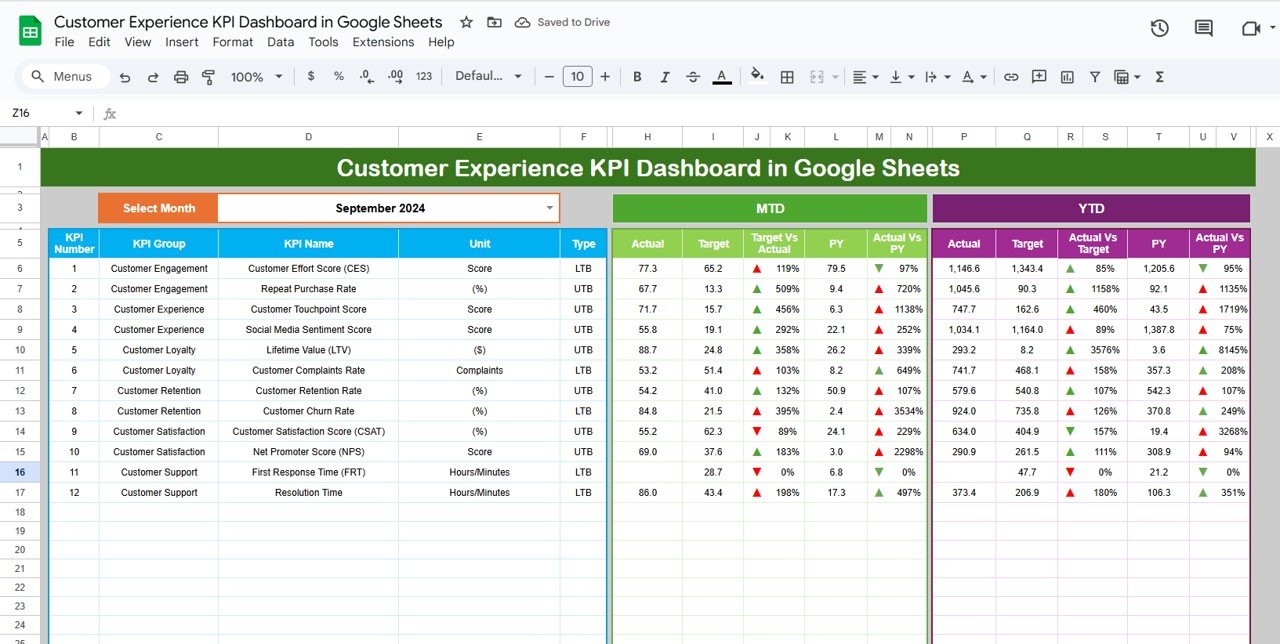
📊 Centralized Dashboard Sheet
Gain quick access to MTD, YTD, and Previous Year comparisons with automated arrows that highlight target achievement and performance drops.
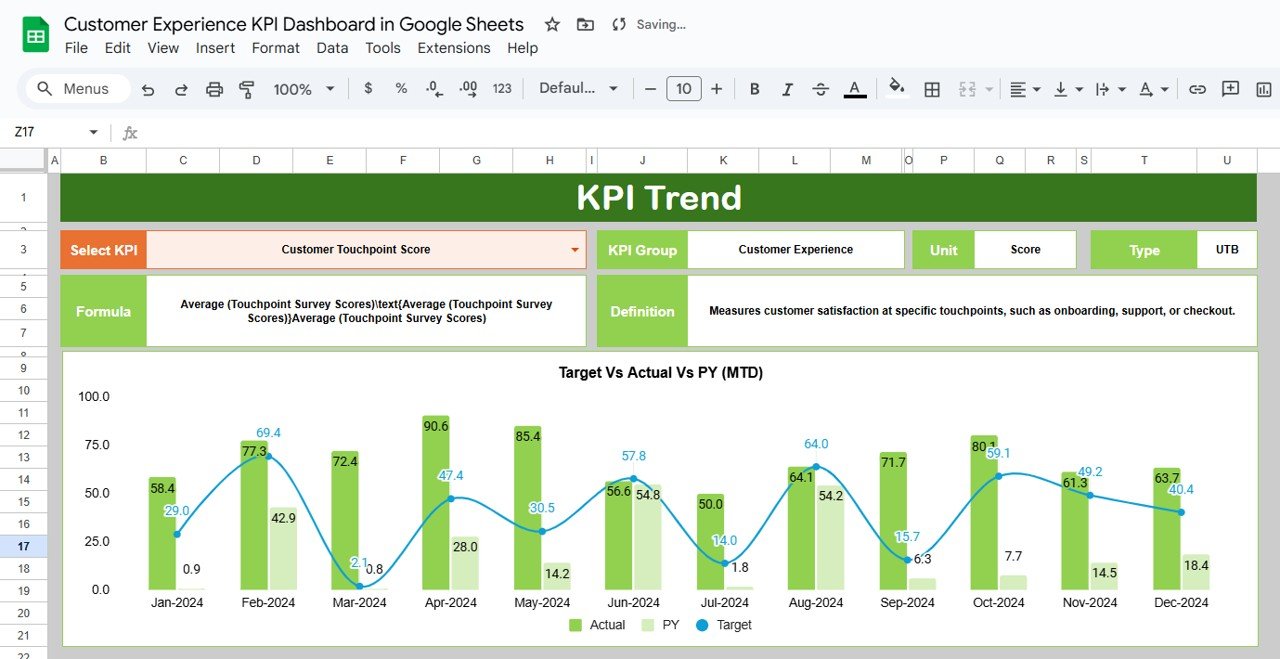
📈 KPI Trend Analysis Sheet
Use the dropdown to select any KPI and view its definition, unit, type (LTB/UTB), and automated MTD/YTD trend charts for deeper insight.
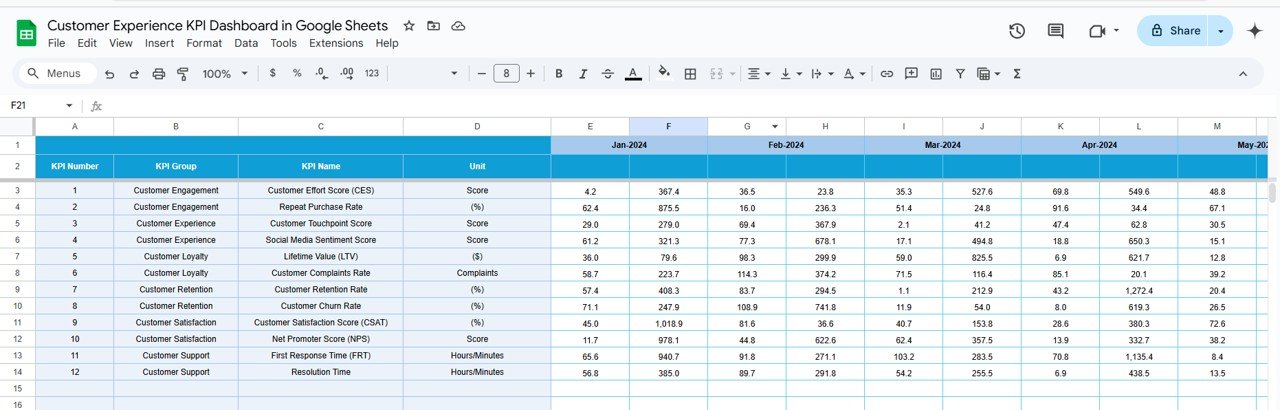
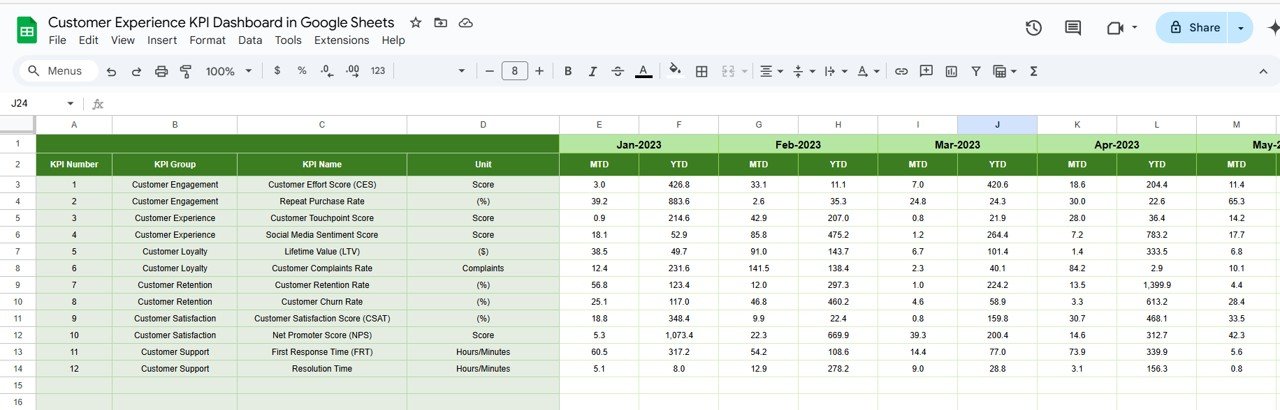
📥 Actual Numbers Input Sheet
Monthly input sheet to add performance values—everything gets reflected on the dashboard without needing formulas or coding.
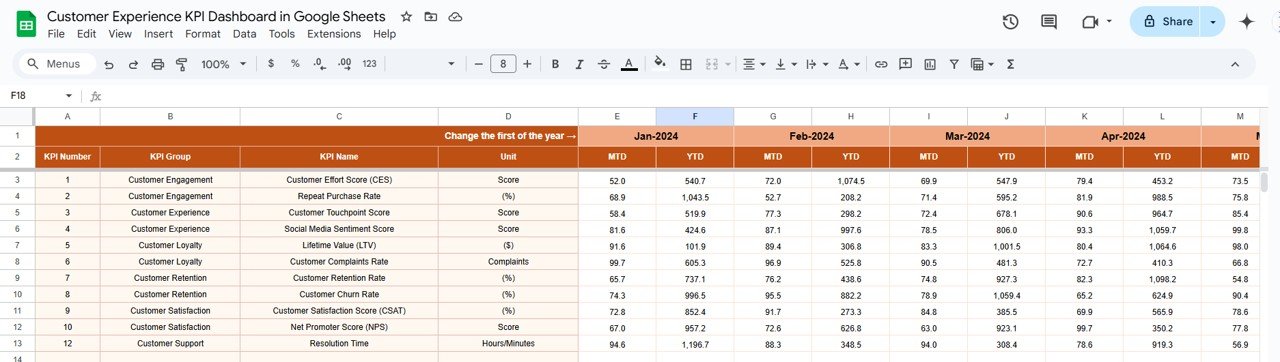
🎯 Target and Previous Year Input
Set your monthly and annual targets and add past-year figures for easy year-over-year analysis.
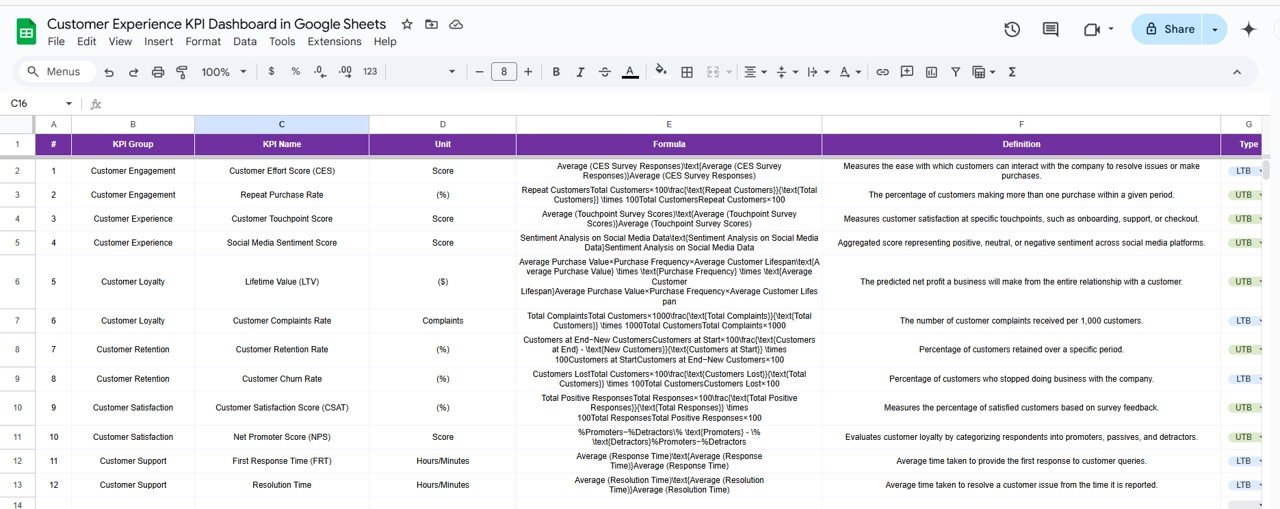
📘 KPI Definition Sheet
Includes all metric details—KPI Name, Group, Formula, Type, and Meaning—to ensure consistency across your team.
✅ Conditional Formatting
Green and red arrows instantly show whether you’re on target, above or below expectations.
📦 What’s Included in the Template?
-
6 Smartly Structured Worksheets:
-
Dashboard Sheet
-
KPI Trend Sheet
-
Actual Numbers Sheet
-
Target Sheet
-
Previous Year Data Sheet
-
KPI Definition Sheet
-
-
Pre-formatted with Charts, Tables, and Drop-downs
-
Fully Editable for Custom KPIs
-
No Add-ons Required—Pure Google Sheets Functionality
-
Collaborate Online in Real-Time
📊 Sample KPIs You Can Track
-
Net Promoter Score (NPS)
-
Customer Satisfaction Score (CSAT)
-
First Response Time
-
Average Resolution Time
-
Customer Retention Rate
-
Churn Rate
-
Ticket Volume
-
Customer Effort Score (CES)
-
Support Request Escalation Rate
-
Service Level Agreement (SLA) Compliance
Each metric can be configured as UTB (Upper the Better) or LTB (Lower the Better) depending on the target outcome.
👥 Who Can Use This Dashboard?
👨💼 CX Managers – Track satisfaction and service efficiency
📞 Support Teams – Improve ticket handling and SLA compliance
📢 Marketing Teams – Evaluate brand perception and loyalty
🏢 Business Leaders – Align team actions with customer-centric goals
📈 SaaS Companies & Startups – Monitor churn, engagement, and retention
💬 Call Centers & Helpdesks – Reduce wait times and increase satisfaction
🔥 Advantages of Using This Dashboard
✅ Real-Time Monitoring – Stay updated with dynamic visuals and charts
✅ 100% Customizable – Add KPIs, rename tabs, or change colors easily
✅ Team Collaboration in Google Sheets – Access anywhere, share with ease
✅ Visual Feedback – Arrows, charts, and color codes offer quick insights
✅ Data-Driven Improvements – Drive better decisions and CX strategies
🧠 Best Practices
✔️ Update Monthly – Maintain data freshness for accurate insights
✔️ Focus on Trends – Use the KPI Trend tab to identify long-term issues or wins
✔️ Train Teams – Align your team with KPI definitions to ensure consistency
✔️ Monitor High-Impact Metrics – Prioritize metrics like NPS, FRT, and Retention
✔️ Collaborate Across Teams – Share insights across support, sales, and marketing
🔗 Read the Full Blog Post
Customer Experience KPI Dashboard in Google Sheets – Complete Guide


Reviews
There are no reviews yet.