



In the fast-paced world of consumer electronics, tracking production efficiency, sales performance, and customer satisfaction is critical for sustained growth. The Consumer Electronics KPI Dashboard in Google Sheets offers a ready-to-use, data-driven solution that helps electronics manufacturers, retailers, and distributors monitor performance in real time. ⚡📊
This interactive Google Sheets template consolidates key metrics — from production output to warranty claims and market sales — into one automated dashboard. It empowers business leaders to make informed decisions, improve product quality, and enhance profitability without complex BI tools or coding knowledge.

🔑 Key Features of the Consumer Electronics KPI Dashboard in Google Sheets
📋 Dashboard Sheet Tab (Main Dashboard)
The main sheet gives a bird’s-eye view of all performance metrics with dynamic visualizations and KPI cards.
Features:
🔽 Month Selector (D3): Choose any month to instantly refresh all metrics.
📆 MTD/YTD Metrics: Compare current performance with historical trends.
📈 Conditional Formatting: Green ↑ for improvement, Red ↓ for underperformance.
🎯 Automated Targets & Variance: Instantly see where you stand against your goals.
Key KPIs Displayed:
⚙️ Production Efficiency (%): Measures output vs. capacity.
💰 Total Sales Revenue (USD): Tracks overall revenue from electronics sales.
🧾 Warranty Claims Rate (%): Indicates product quality and reliability.
🔋 Return Rate (%): Identifies issues causing customer returns.
⭐ Customer Satisfaction Score (CSAT): Reflects customer happiness and brand perception.
Visual Charts:
📊 Sales Trend by Month
🏭 Production Efficiency by Product Line
🔧 Warranty Claims by Product Category
💸 Revenue vs. Target Performance
🧍 Customer Satisfaction by Region
All charts auto-update when new data is entered, ensuring real-time visibility across all business functions.
📈 KPI Trend Sheet Tab (Performance Analytics)
Select any KPI from the dropdown (cell C3) to visualize its monthly performance over time.
Includes:
KPI Group
Unit of Measurement
Formula
Definition
Type (UTB/LTB – Upper/Lower the Better)
This helps analysts detect long-term trends, seasonal fluctuations, and improvement areas.
📘 Actual Number Sheet Tab (Performance Entry)
Enter your actual MTD and YTD performance data for each KPI.
You can also set your fiscal start month (cell E1), and all related calculations update automatically.
🎯 Target Sheet Tab (Goal Setting)
Define monthly and annual targets for each KPI.
The dashboard compares these with actuals to show percentage achievement and color-coded results.
📉 Previous Year Number Sheet Tab (Benchmarking)
Enter historical data here to analyze year-over-year growth and improvements.
📚 KPI Definition Sheet Tab (Reference Guide)
Every KPI is defined clearly with its formula, definition, unit, and performance type — ensuring clarity for all users.
📦 What’s Inside the Dashboard
✅ Fully automated dashboard with real-time updates
✅ MTD, YTD, Target, and Previous Year comparisons
✅ Dynamic KPI trend charts
✅ Color-coded performance indicators
✅ Built-in dropdown selectors and data validation
✅ Cloud collaboration for multiple users
✅ Completely editable structure
🧑💼 Who Can Use This Dashboard
🏭 Manufacturers – Track production performance, cost efficiency, and defect rates.
🏬 Retailers & Distributors – Monitor sales performance and regional profitability.
💼 Operations Teams – Manage warranty claims and customer returns effectively.
📈 Executives – Gain visibility into key performance trends for strategic decisions.
Whether you’re a large electronics manufacturer or a mid-sized retailer, this dashboard provides clarity, speed, and control over your business metrics.
⚙️ Opportunities for Improvement
Enhance your dashboard by adding:
🧠 AI-Driven Forecasting: Predict future sales or production output.
🗺️ Regional Analysis: Track KPIs by geography or market segment.
📩 Customer Feedback Forms: Integrate with Google Forms for real-time input.
🛠️ Automated Maintenance Logs: Link product defect data for preventive analysis.
📧 Performance Alerts: Use Google Apps Script to send automatic updates to teams.
🧠 Best Practices
✅ Keep KPI naming consistent across all sheets.
✅ Protect formulas and chart ranges from accidental edits.
✅ Update data monthly to maintain accurate trends.
✅ Review targets quarterly to align with business objectives.
✅ Backup your file periodically for historical reference.
🌟 Why Choose the Consumer Electronics KPI Dashboard
⚙️ End-to-end visibility across production, sales, and service metrics
📊 Real-time analytics powered by Google Sheets automation
💻 100% cloud-based, no additional software needed
🎯 Auto-calculated MTD/YTD comparisons and trend visuals
🧩 Ideal for electronics manufacturers, distributors, and retailers
The Consumer Electronics KPI Dashboard in Google Sheets is your all-in-one solution for tracking performance, improving quality, and increasing profitability — with simplicity, automation, and precision. ⚡
🔗 Click here to read the Detailed blog post
Watch the step-by-step video Demo:
🔗 Visit our YouTube channel for step-by-step tutorials
Compatibility and Requirements
- Works in Google Sheets. You need a free Google account and a web browser.
- You pick the month on the Dashboard sheet and the KPI on the KPI Trend sheet from dropdowns. Google explains dropdowns in Create an in-cell dropdown list.
Frequently Asked Questions
Which sheets are included?
Six sheets: Dashboard, KPI Trend, Actual Number, Target, Previous Year Number and KPI Definition.
How do I update the dashboard?
Enter your MTD and YTD figures in the Actual Number sheet and your goals in the Target sheet. Then select a month in cell D3 of the Dashboard sheet and the KPI cards and charts refresh.
Which KPIs does it track?
Production Efficiency (%), Total Sales Revenue (USD), Warranty Claims Rate (%), Return Rate (%) and Customer Satisfaction Score (CSAT).
Can I compare this year with last year?
Yes. Enter last year’s figures in the Previous Year Number sheet to compare them with your actuals and targets.
Is there an Excel version?
Yes. See the Consumer Electronics KPI Dashboard in Excel.
Related Electronics Templates
- Consumer Electronics KPI Dashboard in Excel: the same dashboard for Excel
- Electronics KPI Dashboard in Google Sheets: another electronics KPI view in Google Sheets
- Electronics KPI Scorecard in Google Sheets: a scorecard layout for electronics KPIs
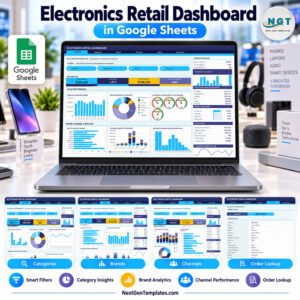
- Electronics Retail Dashboard in Google Sheets: a retail view for electronics sales
- Google Sheets Business Pack (Pro): 14 business templates in one download
Browse all Google Sheets KPI dashboards.













Reviews
There are no reviews yet.