
In today’s fast-moving financial markets, commodities trading demands speed, precision, and data-driven decision-making. Traders, brokers, and financial analysts must continuously monitor trade values, brokerage costs, settlement progress, and profit & loss performance to remain competitive. However, many trading organizations still rely on scattered spreadsheets and manual reporting systems, which often result in delayed insights and inefficient performance tracking.
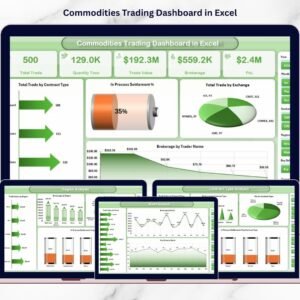
The Commodities Trading Dashboard in Excel is a ready-to-use analytical solution designed to transform raw trading data into meaningful visual insights. Built entirely in Microsoft Excel, this dashboard enables users to analyze commodity trading performance through interactive charts, KPI indicators, and dynamic filters — all within a centralized reporting environment.
Instead of reviewing lengthy transaction reports manually, users can instantly evaluate trading outcomes, profitability trends, brokerage expenses, and settlement status. Consequently, traders gain better control over operations while improving decision-making speed and accuracy.
This dashboard leverages Excel’s powerful capabilities such as Pivot Tables, slicers, structured tables, and automated calculations. Because Excel is widely used across financial organizations, implementation becomes quick and cost-effective without requiring additional software investments.
The dashboard organizes trading analytics into multiple structured pages connected through an intuitive Page Navigator. Each analytical page focuses on a specific trading dimension, allowing users to move seamlessly from high-level summaries to detailed performance analysis.
Whether managing commodity futures, spot contracts, or forward trading activities, this dashboard provides complete visibility into trading performance. As a result, organizations improve profitability tracking, reduce operational risks, and optimize trading strategies.
📊 Key Features of Commodities Trading Dashboard in Excel
📈 Centralized Trading Performance Monitoring
Track all commodity trading metrics in one dashboard.
🎯 Interactive KPI Cards
Quickly understand trading performance at a glance.
🔎 Dynamic Slicers & Filters
Analyze data instantly by trader, region, or contract type.
💰 Profit & Loss Analysis
Monitor profitability across counterparties and markets.
📅 Monthly Trend Analysis
Identify seasonal trading patterns and performance trends.
🤝 Counterparty Performance Insights
Evaluate trading partner profitability and exposure.
📊 Settlement Monitoring
Track in-progress settlement percentages easily.
⚡ Automatic Dashboard Updates
Charts refresh automatically after data updates.
📦 Dashboard Structure – What’s Inside
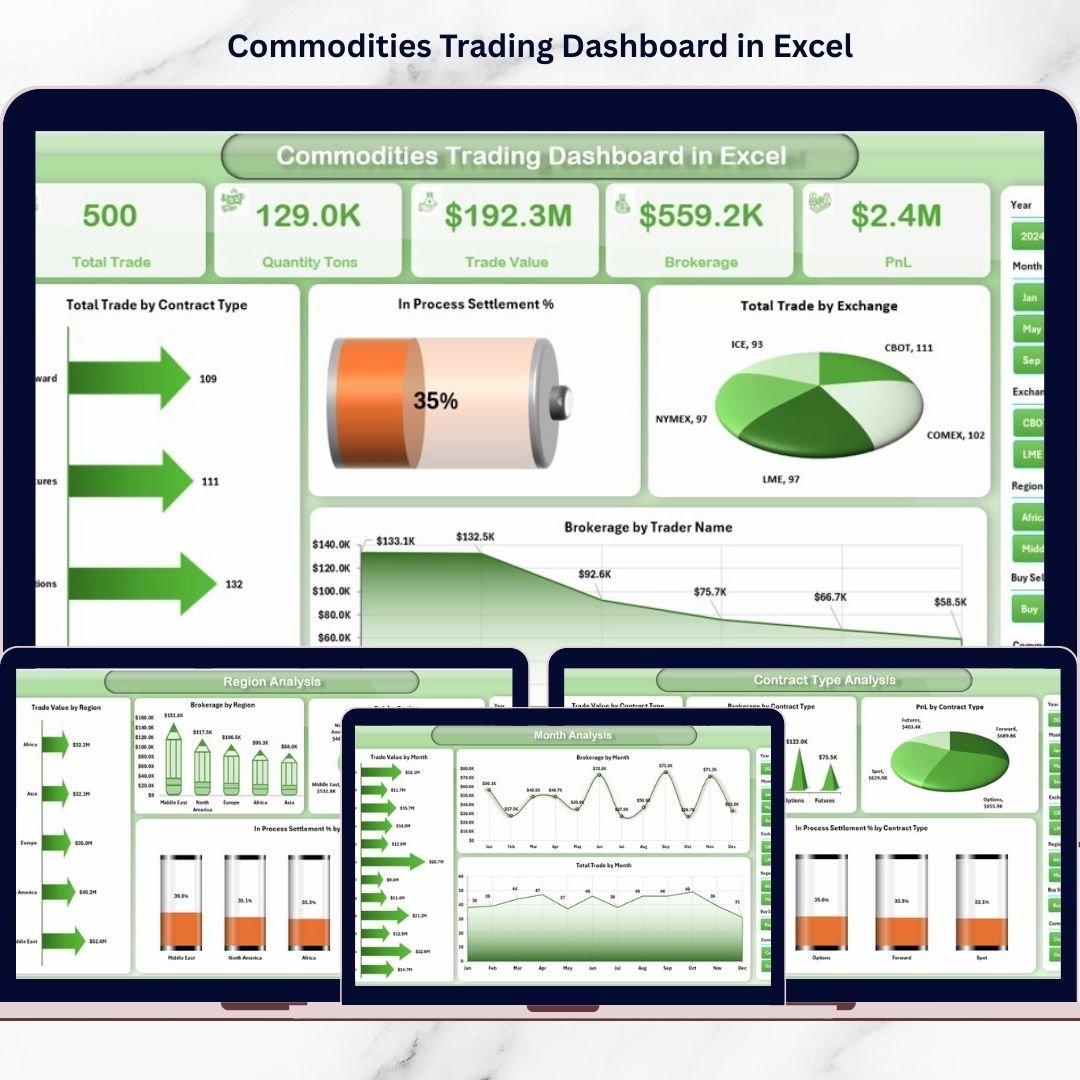
The Commodities Trading Dashboard includes five analytical pages along with supporting sheets.
🔹 1. Overview Page – Central Trading Control Panel
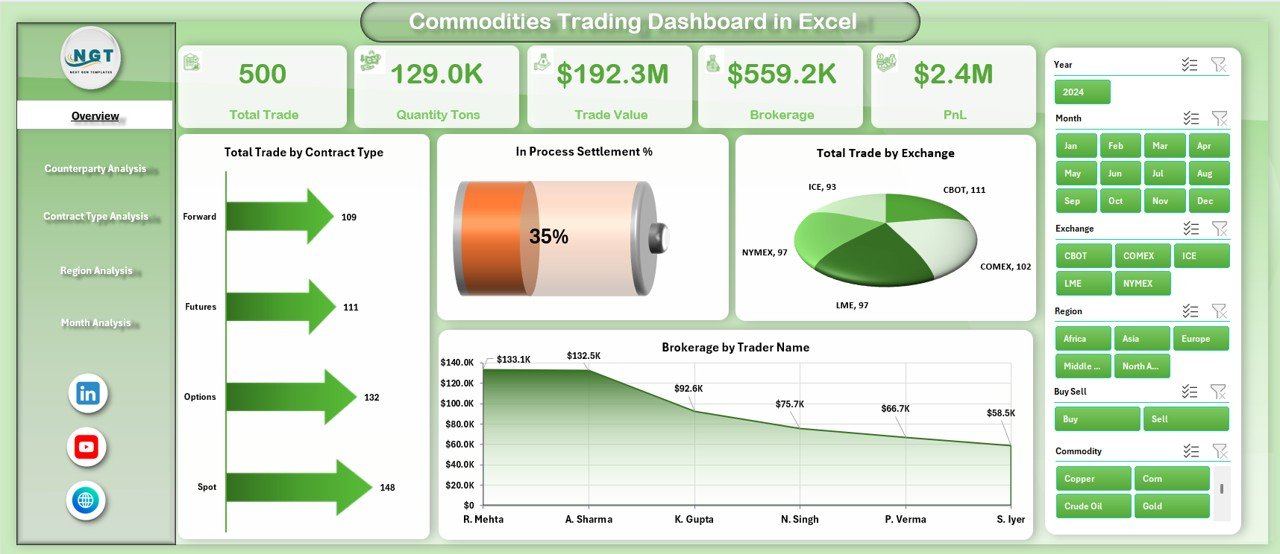
The Overview page provides a complete snapshot of trading performance.
Key Elements
Right-side slicers for dynamic filtering
Four KPI cards
Interactive charts
Charts Included
Total Trade by Contract Type
In-Progress Settlement %
Total Trade by Exchange
Brokerage by Trader Name
This page allows traders to quickly assess overall trading activity and operational health.
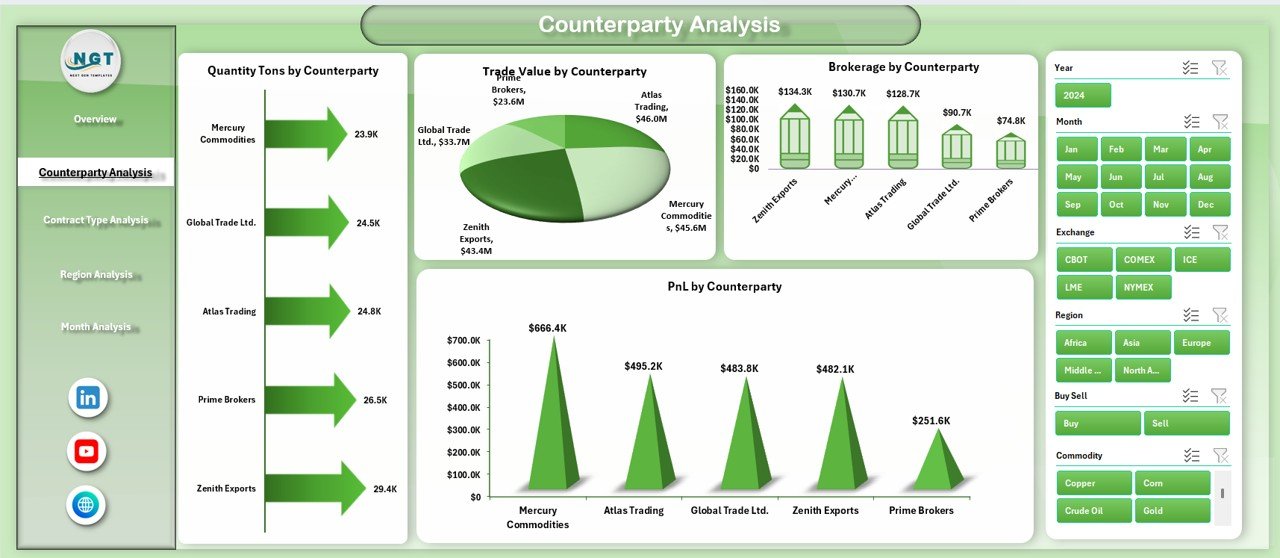
🔹 2. Counterparty Analysis – Trading Relationship Insights
Analyzes performance across trading partners.
Charts Included
Quantity (Tons) by Counterparty
Trade Value by Counterparty
Brokerage by Counterparty
Profit & Loss by Counterparty
Helps identify profitable counterparties and risk exposure levels.
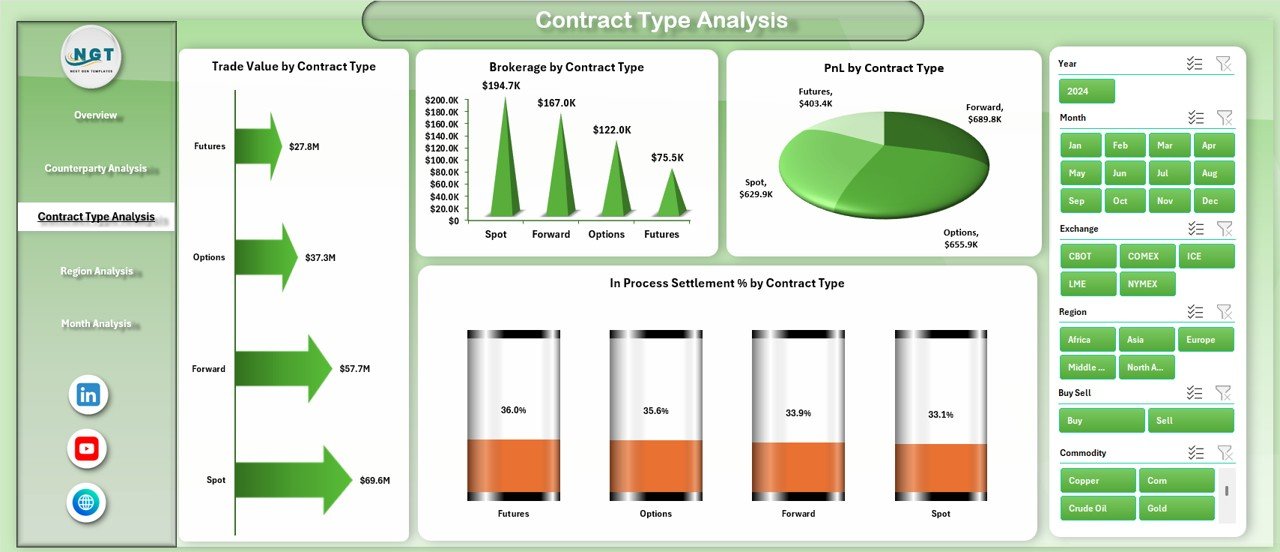
🔹 3. Contract Type Analysis – Strategy Evaluation
Evaluates performance across contract structures.
Charts Included
Trade Value by Contract Type
Brokerage by Contract Type
PnL by Contract Type
Settlement % by Contract Type
Supports optimization of trading strategies based on contract performance.
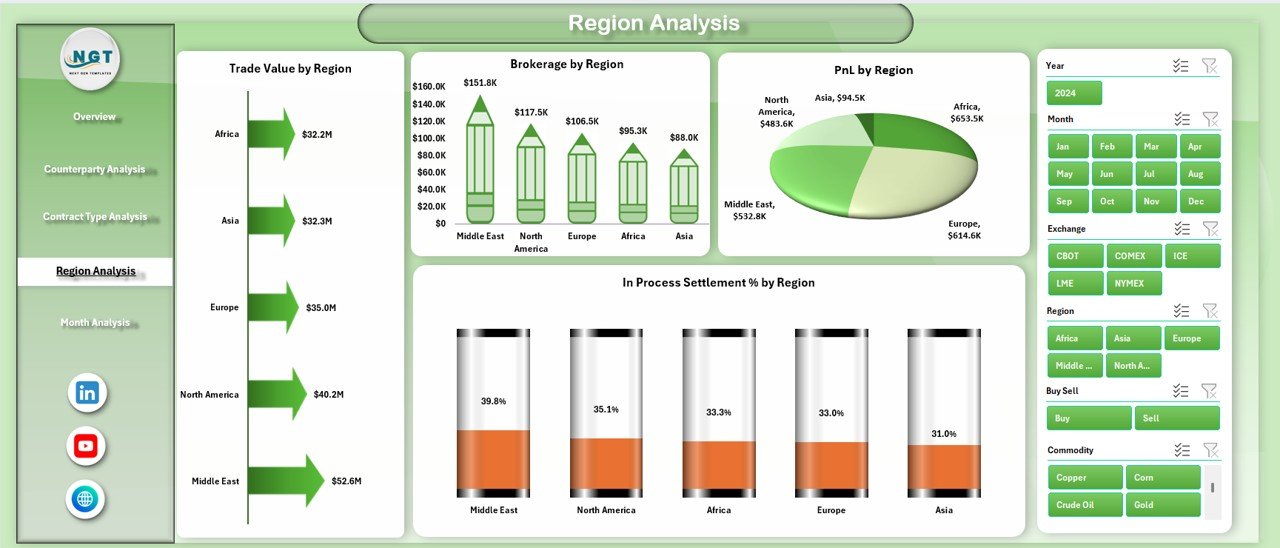
🔹 4. Region Analysis – Geographic Profitability
Compares trading outcomes across regions.
Charts Included
Trade Value by Region
Brokerage by Region
Profit & Loss by Region
Settlement % by Region
Enables regional market comparison and performance evaluation.
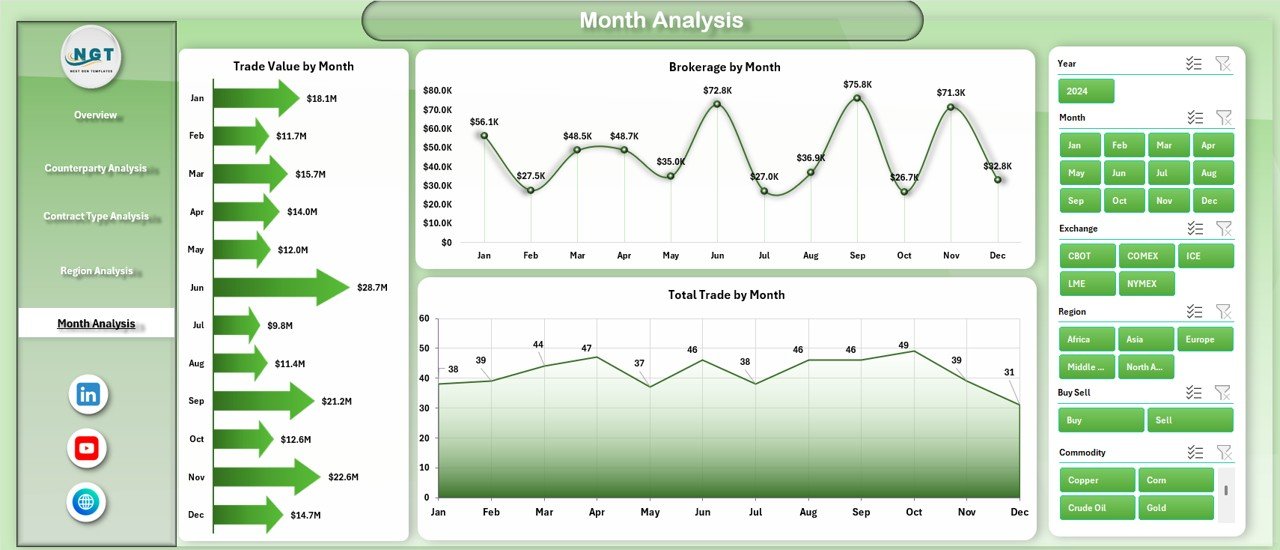
🔹 5. Month Analysis – Time-Based Performance Trends
Tracks trading performance over time.
Charts Included
Trade Value by Month
Brokerage by Month
Total Trade by Month
Helps detect seasonal trends and forecast trading performance.
🧾 Supporting Sheets
✅ Data Sheet
Primary input area where users enter:
Trade transactions
Brokerage details
Settlement status
Trader and counterparty information
✅ Support Sheet
Handles backend calculations, lookup tables, and automation logic.
🛠️ How to Use the Dashboard
1️⃣ Enter trading data into the Data Sheet.
2️⃣ Update trading dimensions (contract, region, trader, etc.).
3️⃣ Refresh Pivot Tables if required.
4️⃣ Use slicers to filter analysis.
5️⃣ Review KPI cards and charts for insights.
No advanced Excel expertise is required.
👥 Who Can Use This Dashboard
Ideal for:
✔ Commodity Traders
✔ Brokerage Firms
✔ Trading Analysts
✔ Financial Institutions
✔ Risk Managers
✔ Commodity Trading Companies
✔ Investment & Trading Teams
🚀 Business Benefits
Organizations using this dashboard can:
✅ Monitor trading profitability instantly
✅ Control brokerage expenses effectively
✅ Track settlement risks proactively
✅ Improve trading strategy decisions
✅ Reduce manual reporting effort
✅ Gain centralized trading visibility
Ultimately, the dashboard helps traders shift from reactive reporting to proactive performance management.
### Click here to read the Detailed blog post
Visit our YouTube channel to learn step-by-step video tutorials
👉 https://youtube.com/@PKAnExcelExpert