

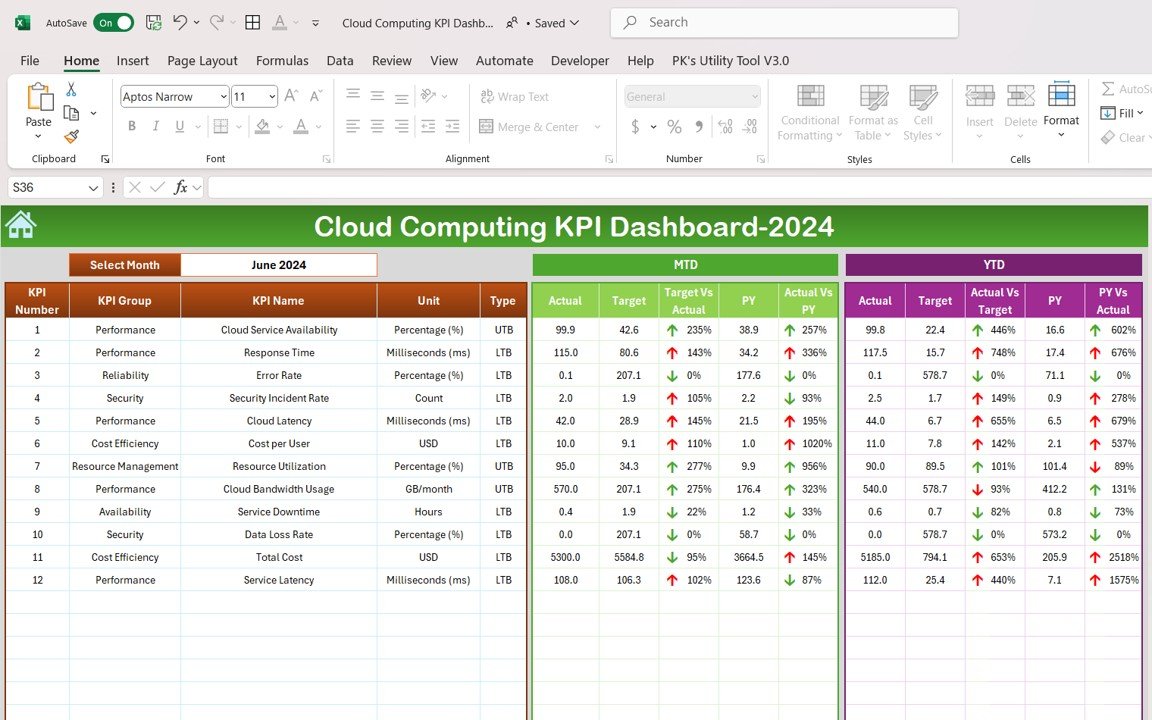
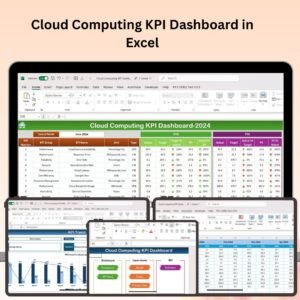
The Cloud Computing KPI Dashboard in Excel is an essential tool for businesses and IT professionals managing cloud-based services and infrastructure. This Excel-based dashboard provides real-time insights into key performance indicators (KPIs) like uptime, cost efficiency, resource utilization, and system performance, helping you monitor and optimize cloud services.
With easy-to-read tracking, interactive charts, and real-time reporting, this dashboard empowers you to analyze your cloud computing operations, reduce costs, improve system efficiency, and ensure service reliability. Whether you’re managing cloud storage, computing power, or SaaS applications, this tool helps you get the most out of your cloud investments.
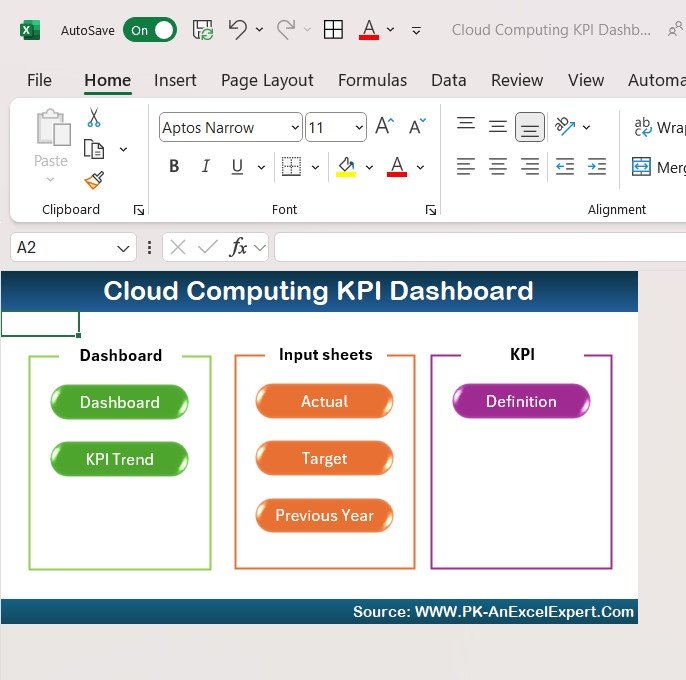
Key Features of the Cloud Computing KPI Dashboard in Excel:
🌐 Comprehensive Cloud Performance Monitoring
Track important cloud metrics such as uptime, system latency, resource allocation, and availability to ensure your cloud systems are performing optimally.
💸 Cost Efficiency Tracking
Monitor cloud service costs and compare them against usage to ensure you’re staying within budget while maximizing the value of your cloud resources.
📈 Resource Utilization Analytics
Analyze the utilization of cloud resources (such as CPU, memory, storage) to identify underutilized or over-provisioned services and optimize resource allocation.
🖥 Service Level Agreement (SLA) Compliance
Track SLA compliance with metrics like uptime percentage, response times, and incident resolution to ensure you’re meeting customer expectations and contractual obligations.
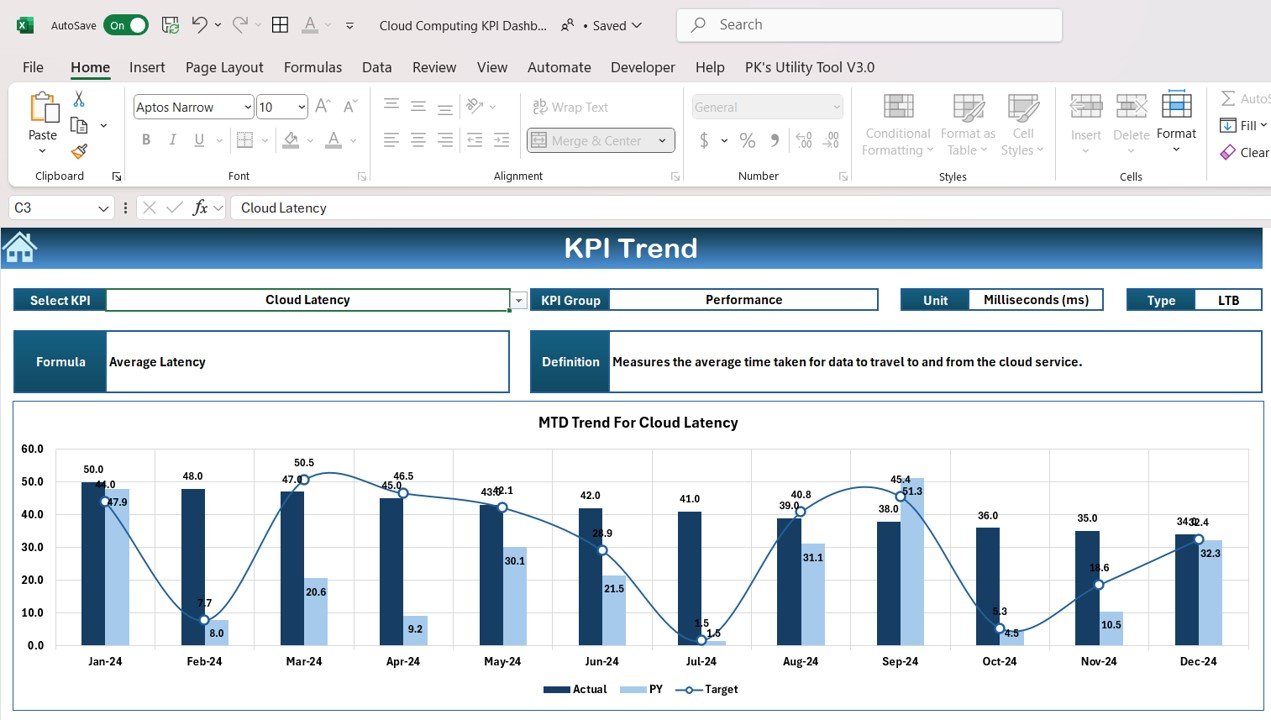
📊 Real-Time Reporting and Visualization
Use interactive charts and graphs to visualize your cloud computing metrics and generate real-time performance reports that highlight key insights and areas for improvement.
🚀 Why You’ll Love the Cloud Computing KPI Dashboard in Excel:
✅ Track Cloud Service Efficiency – Monitor cloud resource usage and service availability in real-time to ensure systems run efficiently.
✅ Optimize Cloud Costs – Analyze service costs and resource utilization to ensure you’re getting the most value from your cloud services.
✅ Ensure Service Reliability – Track key uptime and SLA metrics to ensure reliable service delivery and meet customer expectations.
✅ Improve System Performance – Identify performance bottlenecks and underutilized resources to optimize cloud performance and reduce waste.
✅ Customizable and User-Friendly – Tailor the dashboard to suit your specific cloud service needs and make adjustments as necessary.
✅ Make Data-Driven Decisions – Use real-time data to make informed decisions about scaling, resource allocation, and cloud service management.
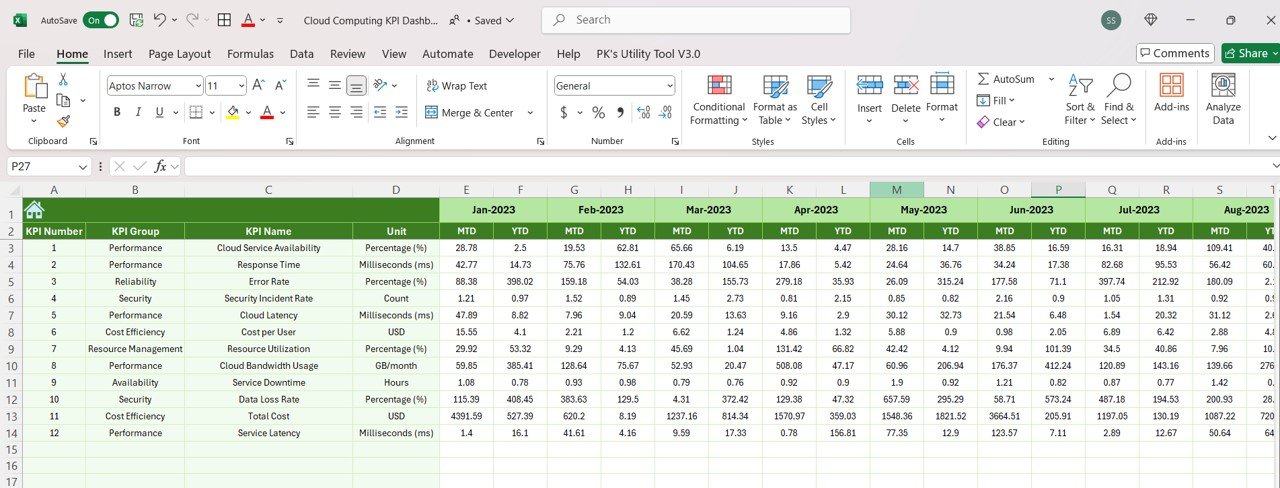
What’s Inside the Cloud Computing KPI Dashboard in Excel:
- Uptime and System Availability: Track uptime percentage, availability, and service interruptions to ensure the reliability of your cloud systems.
- Cost Efficiency: Monitor the cost of cloud services and ensure you’re operating within budget while optimizing resource usage.
- Resource Utilization: Analyze CPU, memory, storage, and network usage to ensure you’re efficiently managing your cloud resources.
- SLA Compliance: Track service-level compliance with KPIs such as downtime, incident resolution times, and overall service performance.
- Performance Monitoring: Visualize cloud service performance with real-time updates on latency, response times, and other key metrics.
- Customizable Reports: Create tailored reports for stakeholders or IT teams to provide a clear view of cloud performance and optimization efforts.
How to Use the Cloud Computing KPI Dashboard in Excel:
1️⃣ Download the Template – Instantly access your Excel file upon purchase.
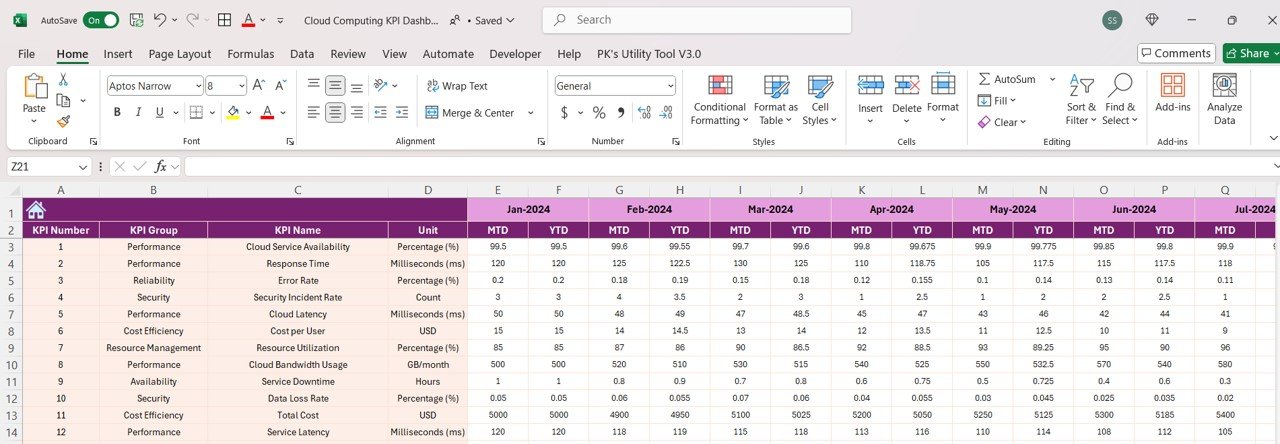
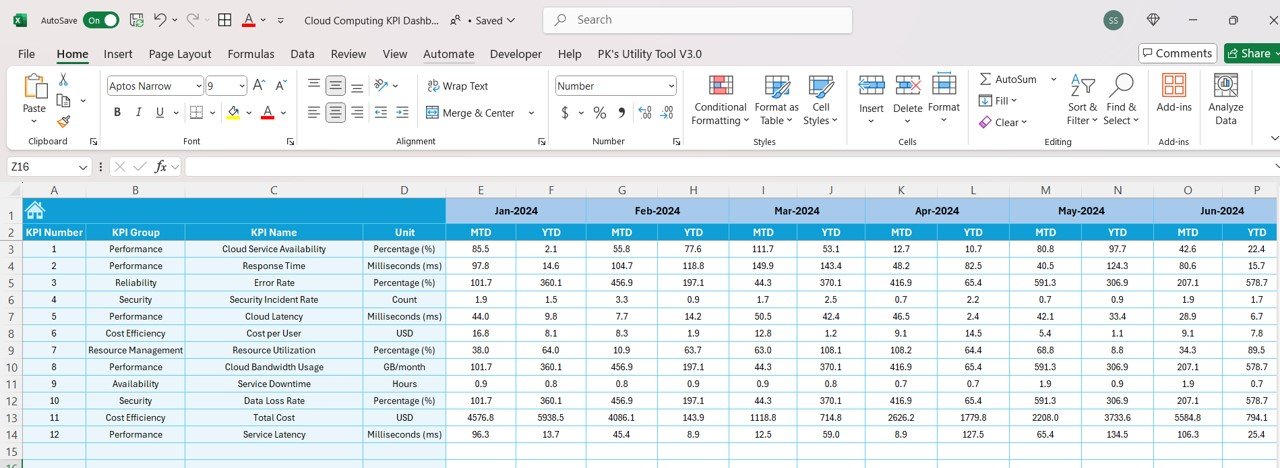
2️⃣ Input Cloud Data – Enter data such as cloud service costs, uptime, resource usage, and SLA compliance into the dashboard.
3️⃣ Monitor Cloud Performance – Track KPIs like uptime, response time, resource utilization, and cost efficiency to ensure cloud systems are running optimally.
4️⃣ Analyze Cost and Utilization – Review cost vs. resource utilization to identify areas for cost-saving and performance improvement.
5️⃣ Generate Reports – Create customized, real-time reports to showcase cloud service performance to stakeholders or internal teams.
Who Can Benefit from the Cloud Computing KPI Dashboard in Excel:
- Cloud Administrators
- IT Managers
- Cloud Service Providers
- DevOps Teams
- System Architects
- Cloud Solution Architects
- Business Owners
- Data Analysts
The Cloud Computing KPI Dashboard in Excel is a must-have tool for anyone managing cloud services or infrastructure. It helps you optimize resource usage, monitor costs, and ensure that your cloud services meet performance standards and SLAs. Whether you’re in charge of internal cloud services or working with external cloud providers, this dashboard provides the insights you need to drive efficiency and performance.
Click here to read the Detailed blog post
https://www.pk-anexcelexpert.com/cloud-computing-kpi-dashboard-in-excel/
Visit our YouTube channel to learn step-by-step video tutorials
Youtube.com/@PKAnExcelExpert


Reviews
There are no reviews yet.