
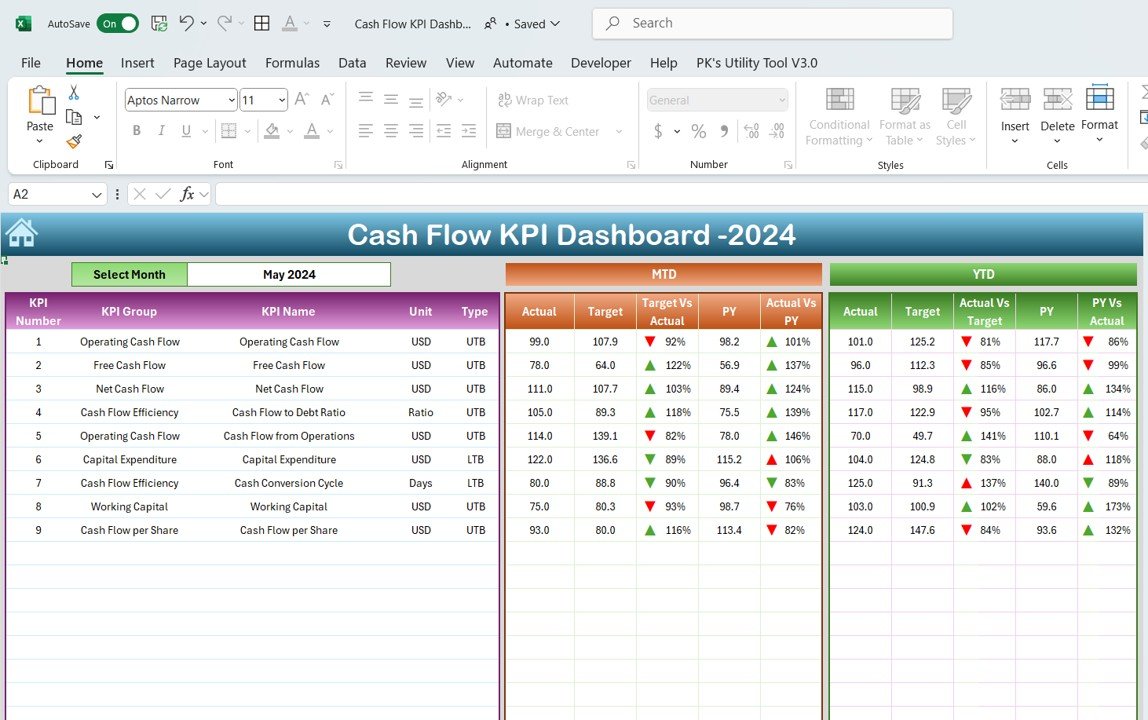
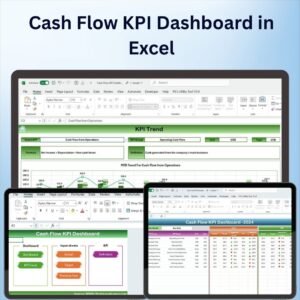
The Cash Flow KPI Dashboard in Excel is a powerful tool designed to help businesses monitor and manage their cash flow in real-time. This dashboard offers a comprehensive overview of key financial metrics, making it easier to track income, expenses, and overall cash flow. It provides a visual representation of your financial health, allowing business owners, financial analysts, and CFOs to make data-driven decisions and improve their cash flow management.
The dashboard features dynamic charts, automated calculations, and clear financial summaries. Whether you are managing a small business or a larger enterprise, this template helps you keep track of your cash flow and financial KPIs in an organized and efficient way.
Key Features of the Cash Flow KPI Dashboard in Excel
📌 Comprehensive Cash Flow Overview
The dashboard provides a visual breakdown of your cash flow, tracking both incoming and outgoing cash. You’ll be able to see at a glance how your income and expenses affect your overall financial health.
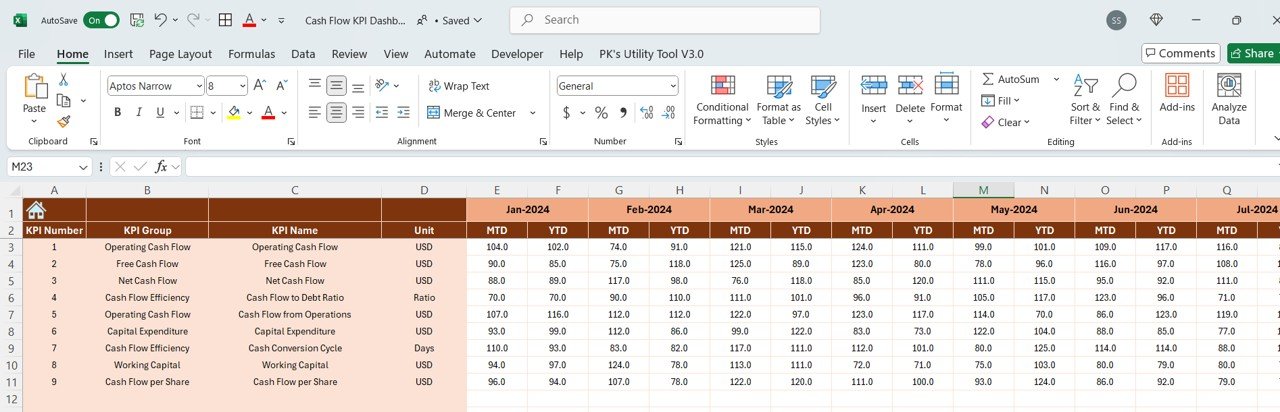
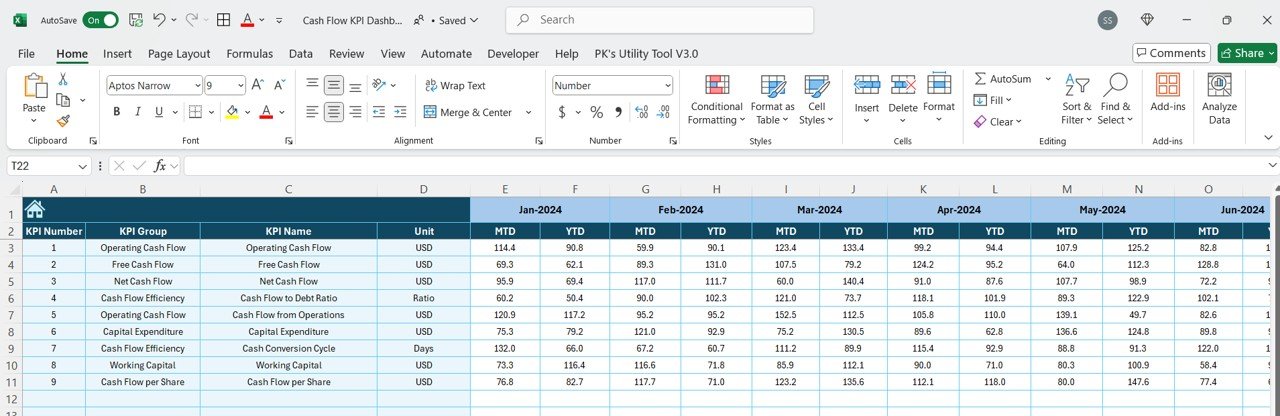
🛠 Customizable Key Performance Indicators (KPIs)
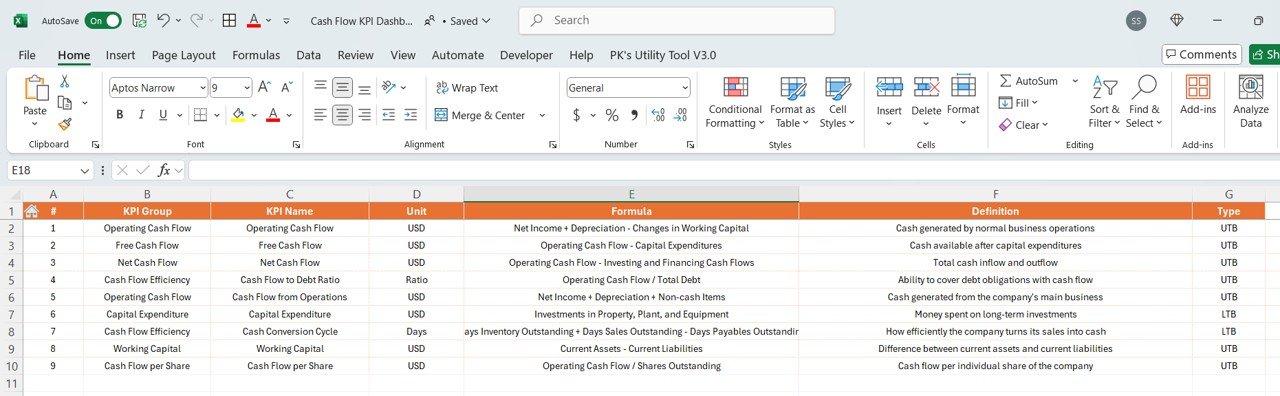
Track a variety of financial KPIs such as cash flow from operations, total expenses, net cash, and working capital. You can easily add or remove KPIs based on your specific needs.
💡 Real-Time Updates
As you enter new data, the dashboard automatically updates to reflect changes in your cash flow and financial status. This ensures that you always have up-to-date information to make informed decisions.
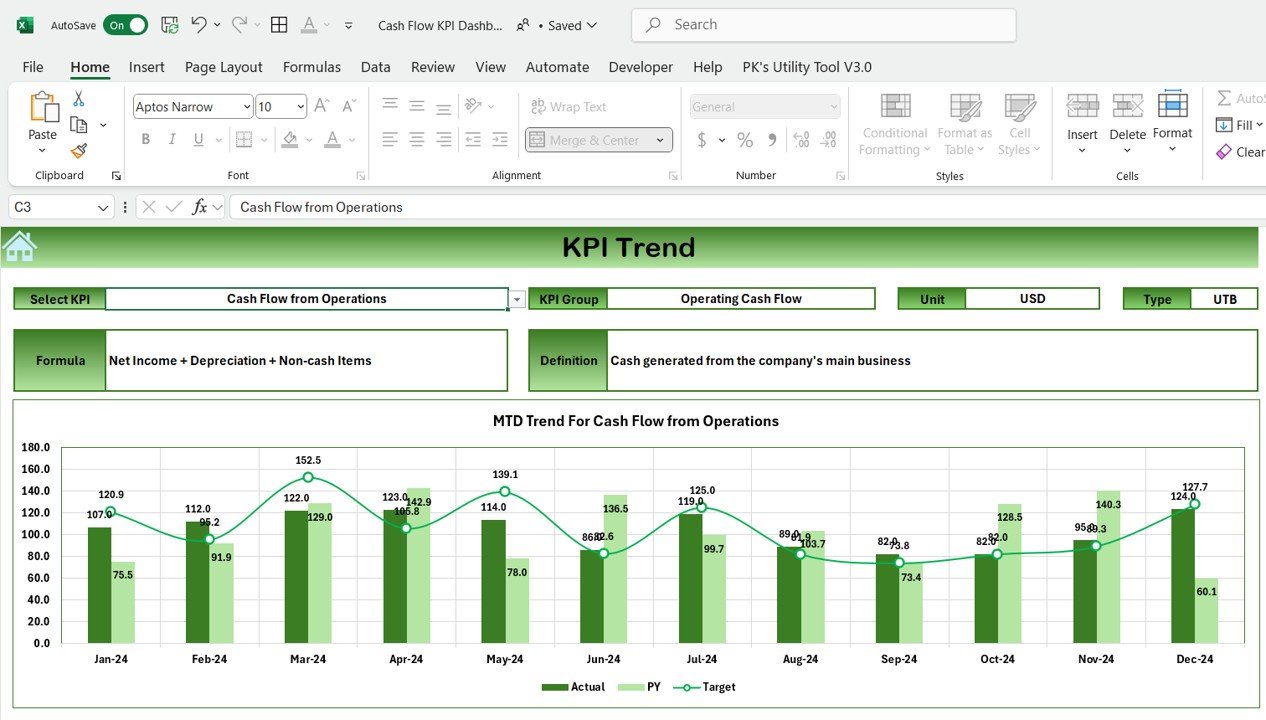
🔢 Dynamic Financial Charts
The dashboard features interactive charts that make it easier to visualize your cash flow, income, expenses, and net cash over time. These charts help you spot trends and understand your financial situation with ease.
🚀 Automated Calculations
All calculations are automated, which means no manual entries are required for cash flow totals or KPI calculations. This saves you time and reduces the risk of errors in your financial reporting.
📊 Clear Financial Summary
The dashboard includes a financial summary that highlights the most important metrics, such as total income, total expenses, and net cash flow. This summary provides a quick snapshot of your financial health.
⚙ Easy Customization
Customize the template to fit your specific needs. You can adjust the categories, add new KPIs, and modify the chart formats to suit your business model.
🚀 Why You’ll Love the Cash Flow KPI Dashboard in Excel
✅ Track Cash Flow Effortlessly – Keep a close eye on income, expenses, and cash flow with ease. ✅ Automated and Real-Time – Stay up-to-date with real-time updates and automated calculations. ✅ Visual and Interactive – Use dynamic charts and graphs to visualize your financial data. ✅ Customizable KPIs – Adjust KPIs to track the most relevant financial metrics for your business. ✅ Professional Financial Reporting – Make better decisions with clear financial summaries and reports.
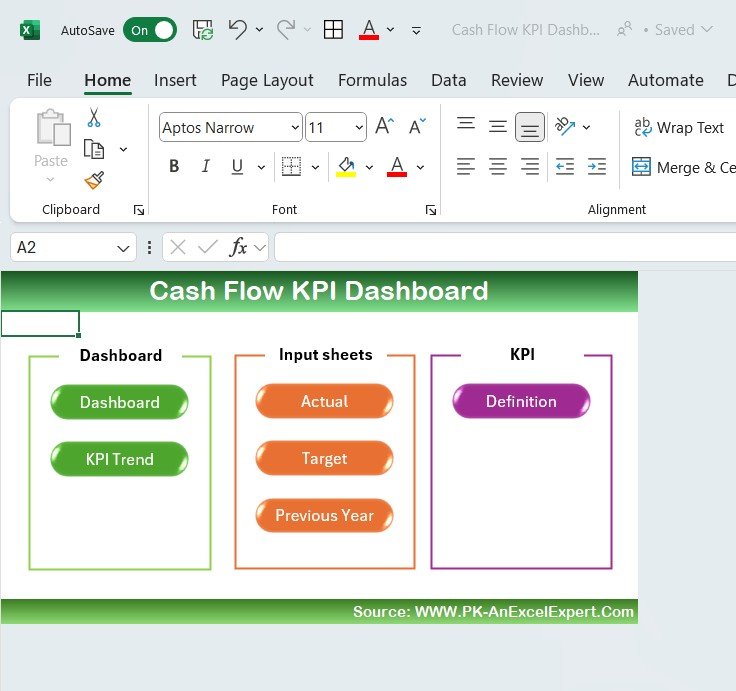
📂 What’s Inside the Cash Flow KPI Dashboard in Excel?
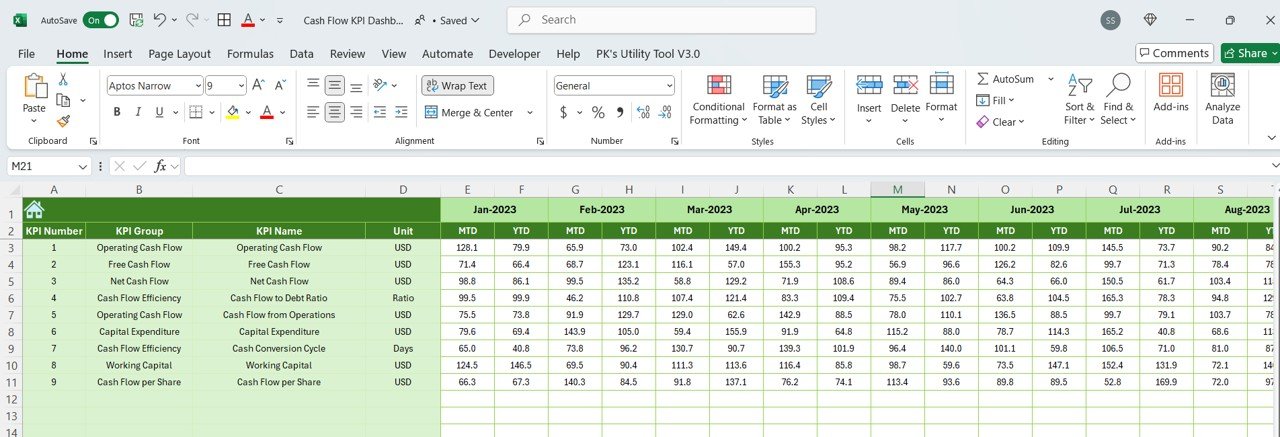
- Dynamic Cash Flow Overview: A clear, visual representation of cash flow from operations and other sources.
- Customizable KPIs: Track multiple financial KPIs such as expenses, income, and working capital.
- Automated Calculations: Calculate totals and KPIs automatically for accurate reporting.
- Financial Charts: Visualize your cash flow and trends with interactive charts and graphs.
- Financial Summary: View a snapshot of your financial health with key metrics.
🔍 How to Use the Cash Flow KPI Dashboard in Excel
1️⃣ Download the Template – Instant access to the Excel file upon purchase. 2️⃣ Enter Your Data – Input your income and expenses into the template to begin tracking your cash flow. 3️⃣ Review Your KPIs – The dashboard will automatically update with your financial KPIs, including net cash flow, total income, and expenses. 4️⃣ Visualize with Charts – Use the interactive charts to get a clear picture of your financial trends and progress. 5️⃣ Make Data-Driven Decisions – Use the information in the dashboard to optimize cash flow, reduce expenses, and improve profitability.
🎯 Who Can Benefit from the Cash Flow KPI Dashboard in Excel? 🔹 Business Owners 🔹 Financial Analysts 🔹 CFOs 🔹 Accountants 🔹 Project Managers 🔹 Anyone looking to monitor and manage cash flow in real-time
Take control of your finances and improve decision-making with the Cash Flow KPI Dashboard in Excel. Whether you’re tracking day-to-day cash flow or monthly expenses, this template gives you the insights you need to optimize your financial management.
Click here to read the Detailed blog post
https://www.pk-anexcelexpert.com/cash-flow-kpi-dashboard-in-excel/
Visit our YouTube channel to learn step-by-step video tutorials


Reviews
There are no reviews yet.