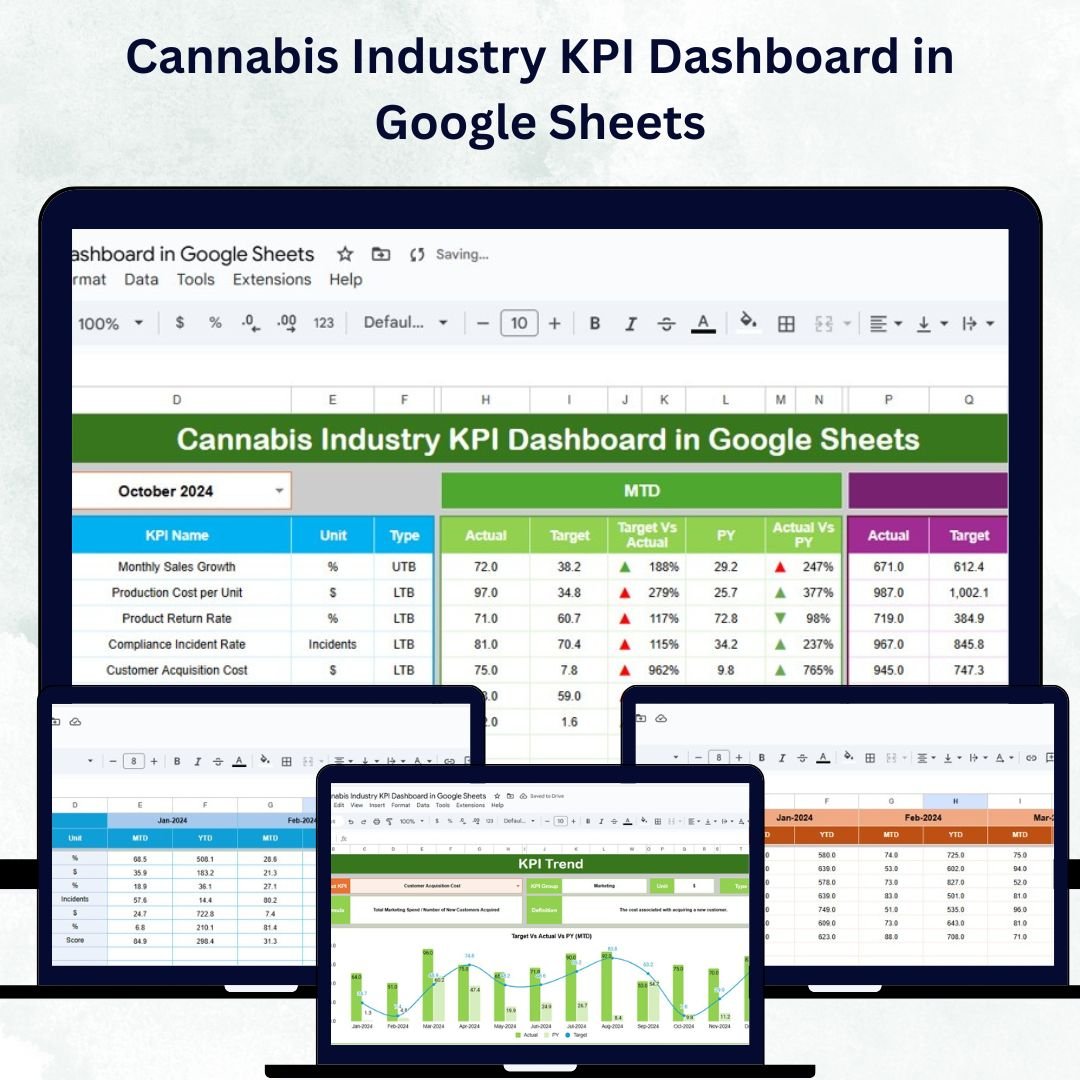


In today’s fast-growing cannabis industry, businesses must track performance across cultivation, production, sales, and compliance to stay competitive and compliant. The Cannabis Industry KPI Dashboard in Google Sheets is a ready-to-use, interactive solution designed to monitor key performance indicators (KPIs) for cannabis operations efficiently. 🚀
Built for cultivators, processors, dispensaries, and distributors, this dashboard provides real-time insights into operational efficiency, profitability, and regulatory adherence — all in a single, easy-to-manage Google Sheet. Whether you’re overseeing one facility or multiple locations, this dashboard empowers data-driven decisions across your entire business. 🌱💼

🔑 Key Features of the Cannabis Industry KPI Dashboard in Google Sheets
📊 Dashboard Sheet Tab
The main dashboard page brings together all your KPIs into one visual summary:
-
Month Selection Dropdown (Range D3): Auto-updates all data by selected month
-
MTD Metrics: View Actual, Target, and Previous Year data side by side
-
YTD Metrics: Monitor cumulative results and compare performance across years
-
Conditional Formatting: Green/red arrows to indicate improvement or decline
-
Comparison Views: Instantly see Target vs Actual and Previous Year vs Actual performance
This sheet provides a comprehensive view of business performance, from cultivation metrics to revenue and compliance indicators.
📈 KPI Trend Sheet Tab
Track and analyze KPI performance trends over time:
-
Select KPI via dropdown (Range C3)
-
Displays KPI Group, Unit, Formula, and Definition
-
Classifies KPIs as Upper-the-Better (UTB) or Lower-the-Better (LTB)
-
View month-to-month patterns through dynamic trend charts
Perfect for identifying bottlenecks and measuring growth initiatives.
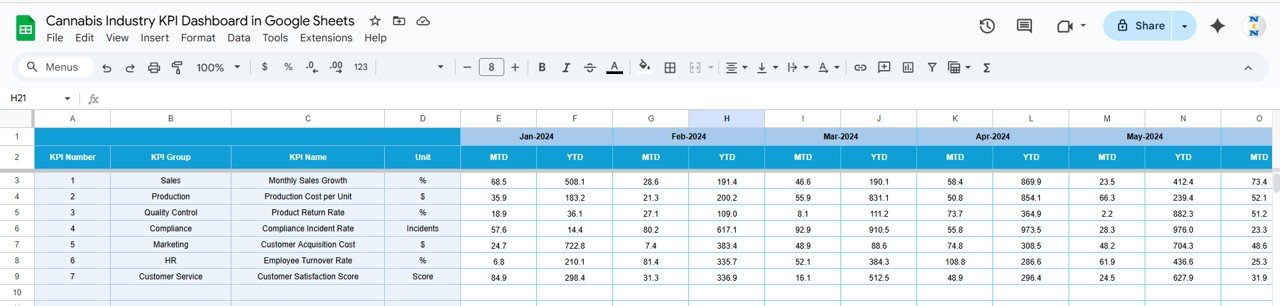
🧾 Actual Numbers Sheet Tab
-
Input MTD and YTD actuals for each KPI
-
Update the current month in Range E1 for automated recalculations
-
Reflects instant updates on dashboard visuals
🎯 Target Sheet Tab
-
Record KPI targets for MTD and YTD performance
-
Supports comparison between planned vs achieved goals
-
Enables performance tracking across cultivation, compliance, and retail
📅 Previous Year Numbers Sheet Tab
-
Store last year’s data for accurate year-over-year analysis
-
Evaluate long-term business improvements and seasonal trends
📖 KPI Definition Sheet Tab
-
Document KPI details including Name, Group, Formula, and Unit
-
Ensures consistent understanding across departments
-
Reduces reporting discrepancies with clear “Lower-the-Better” or “Upper-the-Better” classification
📦 What’s Inside the Cannabis Industry KPI Dashboard?
✅ Dashboard Sheet – Visual summary of all business KPIs
✅ KPI Trend Sheet – Analyze performance trends over time
✅ Actual Numbers Sheet – Input current performance values
✅ Target Sheet – Set and monitor business goals
✅ Previous Year Sheet – Compare past vs current performance
✅ KPI Definition Sheet – Reference guide for metrics and formulas
All sheets are interconnected, ensuring seamless data flow and automatic updates without complex setups. 💡
🧑💼 Who Can Benefit from This Dashboard?
🌿 Cultivation Managers – Monitor yield, plant health, and production cycles
💼 Executives & Founders – Track high-level KPIs like revenue and compliance rates
📊 Finance Teams – Compare costs, margins, and sales against targets
🧑🔬 Operations Managers – Identify inefficiencies and track corrective actions
🏪 Retail & Sales Teams – Monitor store sales, conversion rates, and inventory performance
This dashboard supports both single-site and multi-location cannabis operations and can be customized to meet diverse business needs.
🧪 How to Use the Cannabis Industry KPI Dashboard
-
Enter Actual Data – Update MTD and YTD numbers in the Actual Sheet
-
Set Monthly Targets – Input targets in the Target Sheet for accurate comparisons
-
Add Previous Year Data – Track progress with historical benchmarking
-
Review Trends – Select specific KPIs in the Trend Sheet to analyze fluctuations
-
Make Data-Driven Decisions – Use insights to improve efficiency, compliance, and profitability
No technical expertise required — this Google Sheets-based dashboard is completely plug-and-play, supporting collaboration, updates, and live reporting. ✅
🌟 Why Choose This Dashboard?
-
Built specifically for the cannabis industry
-
Monitors cultivation, production, sales, and compliance in one place
-
Tracks MTD, YTD, and year-over-year performance
-
Customizable for any cannabis business size or model
-
Instant data visualization via dynamic charts
-
100% Google Sheets – no installation or coding required
With the Cannabis Industry KPI Dashboard in Google Sheets, you can turn data into insight and insight into growth. 🌿📈
🔗 Click here to read the Detailed blog post
Watch the step-by-step video Demo:


Reviews
There are no reviews yet.