



In the fast-growing world of Agri Tech, success depends on data. From monitoring crop yields and equipment efficiency to tracking sustainability goals and revenue growth — every decision counts. That’s why the Agri Tech Startups KPI Dashboard in Excel is the ultimate tool for agricultural entrepreneurs and data-driven teams.
This ready-to-use Excel-based dashboard empowers Agri Tech startups to track, visualize, and analyze KPIs in real time. It consolidates all key operational, financial, and sustainability metrics into one smart, interactive system — giving you actionable insights for smarter farming, better investment decisions, and sustainable growth.
Built entirely in Microsoft Excel, it’s easy to use, fully customizable, and designed to help founders, analysts, and field managers make informed, data-backed decisions.
⚙️ Key Features of the Agri Tech Startups KPI Dashboard in Excel
📊 Seven Interactive Sheets: Home, Dashboard, KPI Trends, Actuals, Targets, Previous Year, and KPI Definitions.
🧭 Quick Navigation Buttons: Jump between pages instantly — no scrolling or searching.
📅 Dynamic Month Selector: Choose a month in cell D3 and watch the entire dashboard update automatically.
📈 MTD & YTD Analysis: Compare performance Month-to-Date and Year-to-Date against targets and previous years.
🎯 Color Indicators: Conditional formatting with up/down arrows (▲▼) shows trends instantly.
📘 KPI Definition Sheet: Acts as your KPI library — complete with formulas, units, and clear definitions.
💡 Historical Comparison: Track progress and improvement using Previous Year data.
✅ Fully Editable: Add new KPIs, categories, or visuals as your Agri Tech business grows.
📊 What’s Inside the Dashboard
🏠 1️⃣ Home Sheet – Smart Navigation Hub
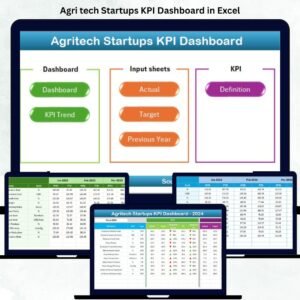
Quickly move across all pages using clickable buttons for Dashboard, Trends, Targets, Inputs, and more. Ideal for non-technical users who want simplicity and speed.
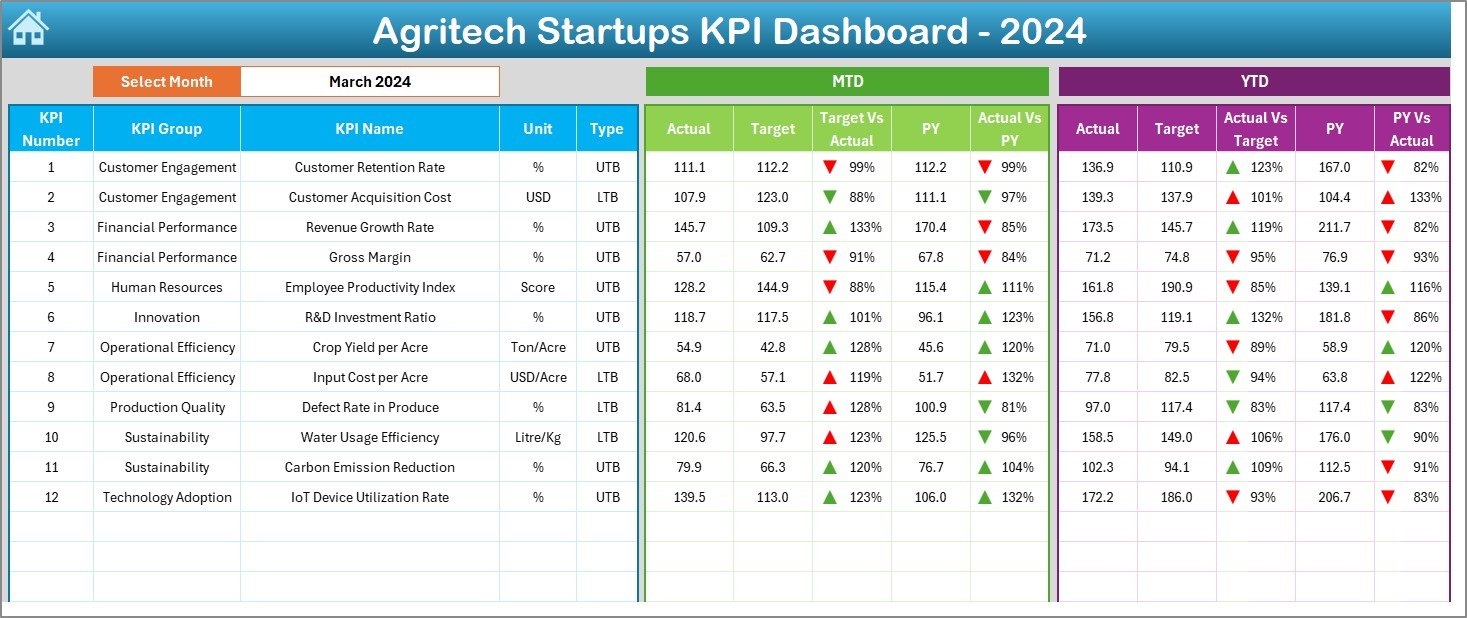
📈 2️⃣ Dashboard Sheet – Performance Command Center
View all your KPIs in one visual page.
Select month → dashboard refreshes instantly.
See Actual vs Target vs Previous Year metrics for both MTD and YTD.
Visual indicators and charts show performance strengths and weaknesses.
💡 Purpose: Evaluate farm performance, revenue, and efficiency at a glance.
📉 3️⃣ KPI Trend Sheet – Analyze KPI Progress
Choose any KPI from the drop-down (cell C3) to view detailed charts and KPI information.
Displays KPI Group, Unit, Formula, and Definition.
Trend charts show Actual vs Target vs Previous Year values for MTD and YTD.
📊 Purpose: Identify seasonal patterns or data drifts in crop, cost, or yield metrics.
🧾 4️⃣ Input Sheets – Real-Time Data Entry
Actual Numbers Sheet: Enter monthly data for each KPI.
Target Sheet: Define MTD and YTD goals for performance benchmarking.
Previous Year Sheet: Store last year’s values for accurate year-over-year comparison.
📚 5️⃣ KPI Definition Sheet – The Knowledge Base
List of every KPI with its group, formula, definition, and measurement unit. Ensures accuracy and alignment across the organization.
🌿 Key KPI Categories for Agri Tech Startups
🌾 Crop Production & Efficiency – Yield per Acre, Water Use Efficiency, Fertilizer Utilization Rate.
🤖 Technology Adoption – IoT Devices Deployed, AI Prediction Accuracy, Equipment Utilization Rate.
👨🌾 Farmer Engagement – Active Farmers, Training Sessions Conducted, Retention Rate, Feedback Score.
💰 Financial Performance – Revenue per Farm, Profit Margin %, ROI, Cost per Hectare.
🌍 Sustainability Metrics – CO₂ Reduction %, Waste Recycled %, Energy Usage Efficiency.
🚜 Operational Logistics – Equipment Downtime, On-Time Deliveries, Order Fulfillment Accuracy.
🌟 Advantages of Using This Dashboard
✅ Centralized Control: All Agri Tech KPIs in one easy-to-manage file.
✅ Visual Clarity: Charts and indicators highlight key performance instantly.
✅ Real-Time Tracking: MTD & YTD insights for accurate decision-making.
✅ Simple Customization: Add or edit KPIs without complex coding.
✅ Cost-Effective: Advanced analytics using only Excel — no expensive BI tools.
✅ Historical Context: Compare results with previous years for long-term insights.
✅ Investor-Ready Reports: Generate visual, professional reports for presentations.
💡 Best Practices for Effective Use
📌 Update your Actual and Target data monthly for accurate trends.
📌 Keep KPI definitions simple and standardized.
📌 Use the Trend Sheet to monitor seasonal impacts on yields or costs.
📌 Review sustainability KPIs regularly to align with ESG goals.
📌 Leverage conditional formatting for quick visual cues.
📌 Conduct monthly performance meetings using dashboard visuals.
🧠 Why Excel Is Perfect for Agri Tech Analytics
Universally accessible and cost-efficient.
Integrates with IoT and ERP data via Power Query.
No coding required — suitable for beginners.
Fully offline, portable, and presentation friendly.
Can evolve later into Power BI dashboards.
🧩 Conclusion
The Agri Tech Startups KPI Dashboard in Excel turns raw agricultural data into actionable intelligence. It empowers startups to measure performance, analyze growth, and manage sustainability — all within a familiar Excel environment.
Whether you’re improving yield, optimizing logistics, or monitoring financial health, this dashboard helps you make smarter, faster, and greener business decisions.
🌾 Empower your Agri Tech venture with data-driven clarity today!






























Reviews
There are no reviews yet.