


The After-Sales Service KPI Dashboard in Excel is a powerful and dynamic tool designed to help businesses monitor and improve their after-sales service performance. Whether you’re in retail, manufacturing, or any service-oriented industry, this dashboard allows you to track key performance indicators (KPIs) such as customer satisfaction, service resolution time, warranty claims, and more. With its easy-to-use interface and data visualization features, you can gain valuable insights into the effectiveness of your after-sales services and take actionable steps to improve customer experience and loyalty.
By tracking these KPIs, businesses can identify areas of improvement, reduce service-related costs, and enhance customer satisfaction. This Excel-based dashboard integrates data from various sources, enabling businesses to make data-driven decisions that foster long-term customer retention and brand loyalty.

Key Features of the After-Sales Service KPI Dashboard in Excel
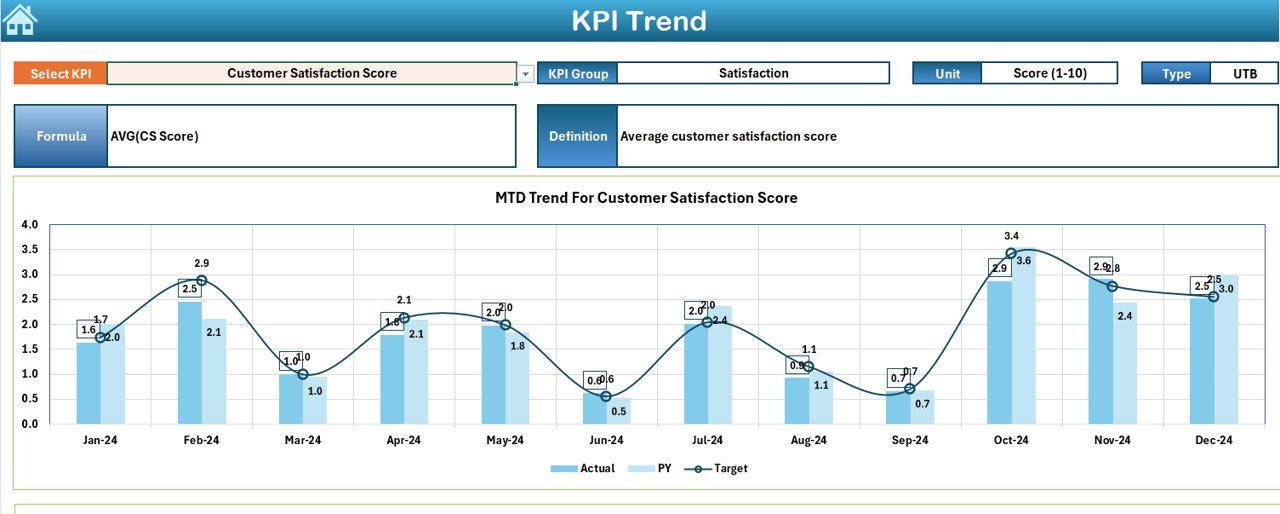
📊 Customer Satisfaction Monitoring
Track customer satisfaction scores with metrics such as Net Promoter Score (NPS), customer feedback ratings, and service quality surveys. Measure the effectiveness of your after-sales interactions and identify areas for improvement.
🛠 Service Resolution Time
Monitor the time taken to resolve customer issues or service requests. This KPI is essential for evaluating the efficiency of your after-sales support team and optimizing service delivery times.
💡 Warranty & Claims Tracking
Track warranty claims and service requests to ensure timely resolution and customer satisfaction. Monitor claims data to identify trends and areas for process improvement.
📉 Service Quality Performance
Evaluate the quality of after-sales services with key metrics such as resolution rates, customer issue recurrence, and the number of service callbacks. Improve service quality and minimize repeat issues.
📅 Time-Based Reporting & Analysis
Analyze KPIs over different periods (daily, weekly, monthly, and yearly) to track performance trends and improvements. Generate time-based reports for deeper insights into service efficiency and performance.
⚙️ Customizable Dashboard
Tailor the dashboard to your organization’s specific after-sales service needs. Add custom KPIs, modify categories, and adjust visualizations to reflect your unique goals.
Why You’ll Love the After-Sales Service KPI Dashboard in Excel
✅ Comprehensive Service Monitoring
Track all critical aspects of your after-sales service, including customer satisfaction, service resolution time, and warranty claims, all in one place.
✅ Boost Customer Satisfaction & Loyalty
Measure and improve the quality of your after-sales services with real-time feedback and performance insights, helping you build stronger customer relationships.
✅ Optimize Service Delivery & Efficiency
Monitor service resolution times and identify bottlenecks to optimize service delivery, reducing costs and improving operational efficiency.
✅ Improve Service Quality
Track repeat service issues, customer complaints, and callbacks, using the data to improve the overall service quality and reduce future issues.
✅ Customizable & Scalable
The dashboard is flexible and scalable, suitable for businesses of all sizes. It can be customized to suit your organization’s specific KPIs and performance goals.
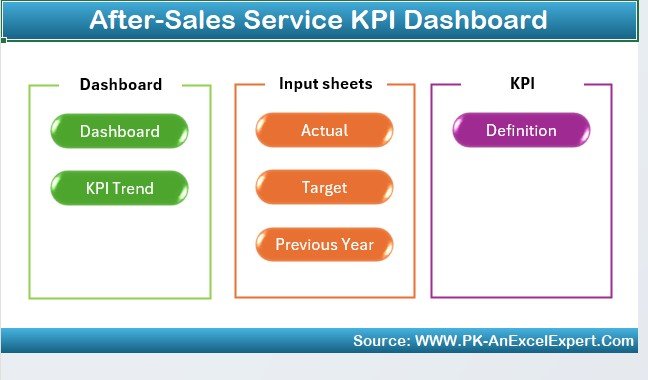
What’s Inside the After-Sales Service KPI Dashboard in Excel?
- Customer Satisfaction Monitoring: Track NPS, customer feedback, and satisfaction ratings.
- Service Resolution Time: Measure the time taken to resolve service requests and issues.
- Warranty & Claims Tracking: Monitor warranty claims and service-related requests.
- Service Quality Performance: Analyze resolution rates and repeat service issues.
- Time-Based Reporting & Analysis: Track KPIs over different periods for performance analysis.
- Customizable Features: Adjust the dashboard to reflect your business’s after-sales service needs.
How to Use the After-Sales Service KPI Dashboard in Excel
1️⃣ Download the Template: Instantly access the After-Sales Service KPI Dashboard in Excel.
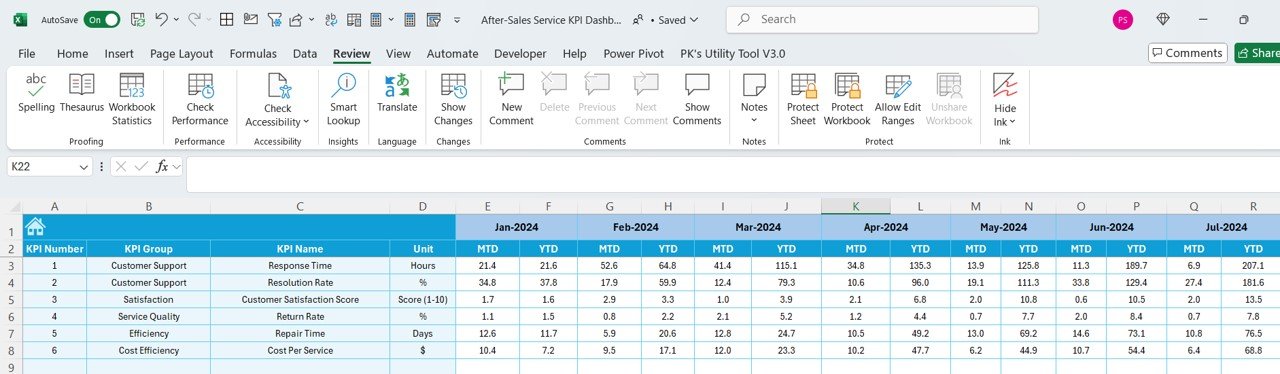
2️⃣ Input Data: Enter data related to customer feedback, service resolution times, and warranty claims.
3️⃣ Monitor KPIs: Track key performance metrics such as customer satisfaction, resolution times, and service quality.
4️⃣ Analyze Trends & Data: Use time-based analysis to track trends and identify areas for improvement.
5️⃣ Optimize Your Service Process: Use insights from the dashboard to streamline your after-sales processes and improve service delivery.
Who Can Benefit from the After-Sales Service KPI Dashboard in Excel?
🔹 Customer Service Teams
🔹 After-Sales Service Managers
🔹 Operations & Support Teams
🔹 Retail & E-commerce Businesses
🔹 Manufacturers & Service Providers
🔹 Business Owners & Executives
🔹 Enterprises with After-Sales Service Departments
Optimize your after-sales service operations with the After-Sales Service KPI Dashboard in Excel. Track customer satisfaction, monitor service performance, and make data-driven decisions that improve service efficiency and customer retention.
Click here to read the Detailed blog post
Visit our YouTube channel to learn step-by-step video tutorials
Youtube.com/@PKAnExcelExpert


Reviews
There are no reviews yet.