


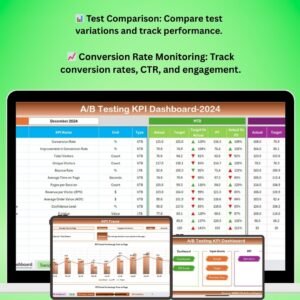
The A/B Testing KPI Dashboard in Excel is a powerful tool designed to help businesses optimize their digital marketing strategies and campaigns. This Excel-based dashboard allows you to track and analyze the results of A/B tests, providing key insights into which variations of your content, design, or marketing strategies are performing best.
A/B testing is crucial for understanding user behavior, improving conversion rates, and making data-driven decisions. With this dashboard, you can easily compare two versions of a webpage, email campaign, or ad, and track critical KPIs such as conversion rate, bounce rate, engagement, and more. The dashboard’s intuitive layout ensures you can measure the success of your tests in real-time, identify winning strategies, and refine your approach for maximum impact.
Key Features of the A/B Testing KPI Dashboard in Excel
📊 Test Comparison Tracking
Compare different variations of your tests, whether it’s a webpage, email, or advertisement. Track metrics like clicks, conversions, and engagement, and determine which variation is performing best.
📈 Conversion Rate & Performance Monitoring
Monitor key performance metrics such as conversion rate, bounce rate, click-through rate (CTR), and engagement for each variation. Quickly identify the most successful versions of your tests.
⚙️ Customizable KPIs & Metrics
Track the most relevant KPIs for your A/B tests. Customize the dashboard to include specific metrics like revenue, average order value, or any other test-specific performance indicators.
🔄 Real-Time Data Analysis & Updates
As you input new data from your tests, the dashboard updates automatically to reflect the most current results. This real-time tracking helps you make quick adjustments to your campaigns.
📅 Time-Based Test Performance
Analyze the performance of your A/B tests over different time periods. View results on a daily, weekly, or monthly basis to better understand trends and test effectiveness over time.
📉 Data Visualization & Reporting
Easily visualize the results of your A/B tests with dynamic charts and graphs. The dashboard makes it simple to communicate performance insights to your team, stakeholders, or clients.
Why You’ll Love the A/B Testing KPI Dashboard in Excel

✅ Quick & Easy Test Comparison
Effortlessly compare test variations and determine which version is performing best. Use data-driven insights to optimize your content, design, or marketing strategy.
✅ Track Key Performance Metrics
Monitor essential KPIs like conversion rate, CTR, and bounce rate in real time. Make adjustments to your tests and campaigns based on accurate, up-to-date data.
✅ Customizable for Your Needs
Tailor the dashboard to suit your specific A/B testing needs. Track the metrics that matter most to your campaigns and refine your strategy accordingly.
✅ Improve Conversion Rates & ROI
Optimize your digital marketing efforts by focusing on the most successful test variations. Use the insights from this dashboard to drive conversions and maximize your return on investment.
✅ User-Friendly Reporting & Visualization
Generate clear and easy-to-understand reports and visualizations to communicate your test results. Share these insights with your team and stakeholders with ease.
What’s Inside the A/B Testing KPI Dashboard in Excel?
- Test Comparison Tracking: Compare two test variations and monitor key performance metrics.
- Conversion Rate & Engagement Monitoring: Track conversion rates, CTR, bounce rates, and more.
- Customizable KPIs: Tailor the dashboard to track the specific KPIs that are most relevant to your A/B tests.
- Real-Time Data Updates: Track test results and make quick adjustments with real-time data.
- Data Visualization & Reporting: Visualize performance with dynamic charts and generate professional reports.
- Time-Based Performance Analysis: Track test performance over different periods and identify long-term trends.
How to Use the A/B Testing KPI Dashboard in Excel
1️⃣ Download the Template: Get instant access to the A/B Testing KPI Dashboard.
2️⃣ Set Up Your Tests: Input data for your A/B tests, including variations and KPIs.
3️⃣ Track Test Results: Monitor key metrics such as conversion rates, CTR, and engagement in real time.
4️⃣ Analyze Data & Insights: Use data visualizations to understand performance trends and identify the best performing variations.
5️⃣ Optimize Your Strategy: Adjust your marketing campaigns or website content based on the insights gained from the dashboard.
Who Can Benefit from the A/B Testing KPI Dashboard in Excel?
🔹 Digital Marketers & Marketing Teams
🔹 SEO & PPC Specialists
🔹 E-commerce Websites & Online Retailers
🔹 Content Creators & Bloggers
🔹 Conversion Rate Optimization (CRO) Experts
🔹 Data Analysts & Performance Analysts
🔹 Agencies & Consultants
🔹 Small & Medium Businesses (SMBs)
Optimize your A/B testing campaigns with the A/B Testing KPI Dashboard in Excel. Track, compare, and analyze performance to identify winning strategies and improve conversion rates.
Click here to read the Detailed blog post
Visit our YouTube channel to learn step-by-step video tutorials
Youtube.com/@PKAnExcelExpert


Reviews
There are no reviews yet.