

The best bookkeeper templates cover four jobs: planning payment dates, tracking the daily ledger and expenses, reporting monthly KPIs and presenting the numbers to owners or clients. This stack of 8 Excel, Google Sheets, Power BI and web app templates does all four for $174.93 in one-time payments. Start with the Accounting Ledger Pro web app ($39.99).
Last updated: October 2026
Key takeaways
- A bookkeeper or small-business accountant needs templates for four jobs: plan payment dates, track transactions, report KPIs and present results.
- The full 8-template stack costs $174.93 once, with no monthly or per-user fees.
- The Accounting Ledger Pro Management System Web App ($39.99) is the best overall pick because it holds sales, purchases, receipts, payments, ledgers, cashbook and bankbook in one place.
- The best value is the Accounts Payable and Receivable Calendar in Excel at $4.99, which puts every invoice due date on one annual view.
- Templates suit single-entity businesses and small practices; anyone who needs bank feeds, payroll tax filing or multi-entity consolidation should keep accounting software.
Bookkeeper templates compared
Every template in this stack, its format, the job it does in a bookkeeper’s month and its one-time price. The “What it replaces” column names the kind of paid tool a small business or practice can drop once the template is in use.
| Template | Format | Job | Best For | What it replaces | Price |
|---|---|---|---|---|---|
| Accounting Ledger Pro Management System Web App (Best overall) | Web app (Google Apps Script) | Track | Daily ledger: sales, purchases, receipts, payments, cashbook and bankbook | Entry-level QuickBooks or Xero plans for small firms | $39.99 |
| Accounts Payable and Receivable Calendar in Excel (Best value) | Excel | Plan | Invoice due dates and collection deadlines in annual, monthly and daily views | Bill-pay reminder apps and shared Outlook calendars | $4.99 |
| Expense & Petty Cash Management System Web App | Web app (Google Apps Script) | Track | Expense claims, approvals, petty cash floats and cash counts | Expensify-style expense claim apps | $39.99 |
| Cash Flow Analysis Pack | Excel + Google Sheets + Power BI | Plan | 12-month and 13-week cash forecasts and a cash flow statement | Cash forecasting apps such as Float or Fathom | $19.00 |
| Accounts Payable KPI Dashboard in Google Sheets | Google Sheets | Report | AP KPIs month to date and year to date vs target and last year | AP automation dashboards | $9.99 |
| Expense Management KPI Dashboard in Google Sheets | Google Sheets | Report | Expense KPIs against budget and the previous year | Spend-analytics add-ons | $8.99 |
| Finance and Accounting KPI Dashboard in Power BI | Power BI | Present | Interactive finance KPI report for owners and managers | A custom Power BI build by a consultant | $11.99 |
| Accounting Firm Client Management System Web App | Web app (Google Apps Script) | Present | Clients, compliance jobs, timesheets, WIP and billing for a practice | Practice-management tools such as Karbon or TaxDome | $39.99 |
How we picked these
We searched more than 1,000 paid templates in the NextGenTemplates catalogue for anything a bookkeeper or small-business accountant touches between recording the first invoice of the month and sending the month-end report. Each one had to do a real bookkeeping job, have a working dashboard, calendar or data-entry screen, and be sold for a one-time price.
We left out personal-finance files, single invoices and the narrow industry KPI dashboards that suit a CFO better than a bookkeeper. Each template was assigned to one of four jobs (plan, track, report, present) so the stack has no gaps and little overlap. Where the same tool exists in Excel, Google Sheets and Power BI, we picked the edition that best fits a bookkeeper and named the others.
What do bookkeepers and accountants actually need from templates?
A bookkeeper’s month runs on a fixed loop. Bills and customer invoices arrive with due dates, every transaction must land in the right ledger, expense claims and petty cash have to be approved and counted, and at month end the owner wants to know where the cash went. Most small businesses already do this in spreadsheets, which is why searches for bookkeeping templates in Excel and Google Sheets stay steady all year.
The problem is not the spreadsheet. It is that each file is built from scratch, nobody agrees on the formulas, and the numbers are only checked when the accountant asks for them. Good bookkeeper templates fix that by giving every job one agreed file. The numbers a bookkeeper is judged on are simple to state:
| Bookkeeping KPI | Formula | Typical target |
|---|---|---|
| Days sales outstanding (DSO) | Accounts receivable ÷ credit sales × days in period | No more than your payment terms plus 10 days |
| Days payable outstanding (DPO) | Accounts payable ÷ cost of goods sold × days in period | Close to supplier terms, so you neither pay early nor late |
| Invoices paid on time % | Supplier invoices paid by due date ÷ invoices due × 100 | 95% or higher |
| Bank reconciliation completion | Accounts reconciled by day 5 ÷ accounts to reconcile × 100 | 100% every month |
| Expense claim cycle time | Average days from claim submitted to claim paid | Under 7 days |
| Petty cash variance | Counted cash − book balance | Zero, with a written note for any difference |
The eight templates below map to these numbers. The calendar and cash forecast stop late payments and cash surprises, the ledger and expense web apps keep the records clean, and the KPI dashboards turn them into a monthly report. If you also own budgets and board reporting, our CFO dashboard template stack and the financial controller template stack cover the next level up.
The 8 best bookkeeper templates for 2026
The list is ranked by how much of a bookkeeper’s month each template covers. The ledger web app is first because every other tool in the stack reads from the records it keeps.
1. Accounting Ledger Pro Management System Web App — best overall
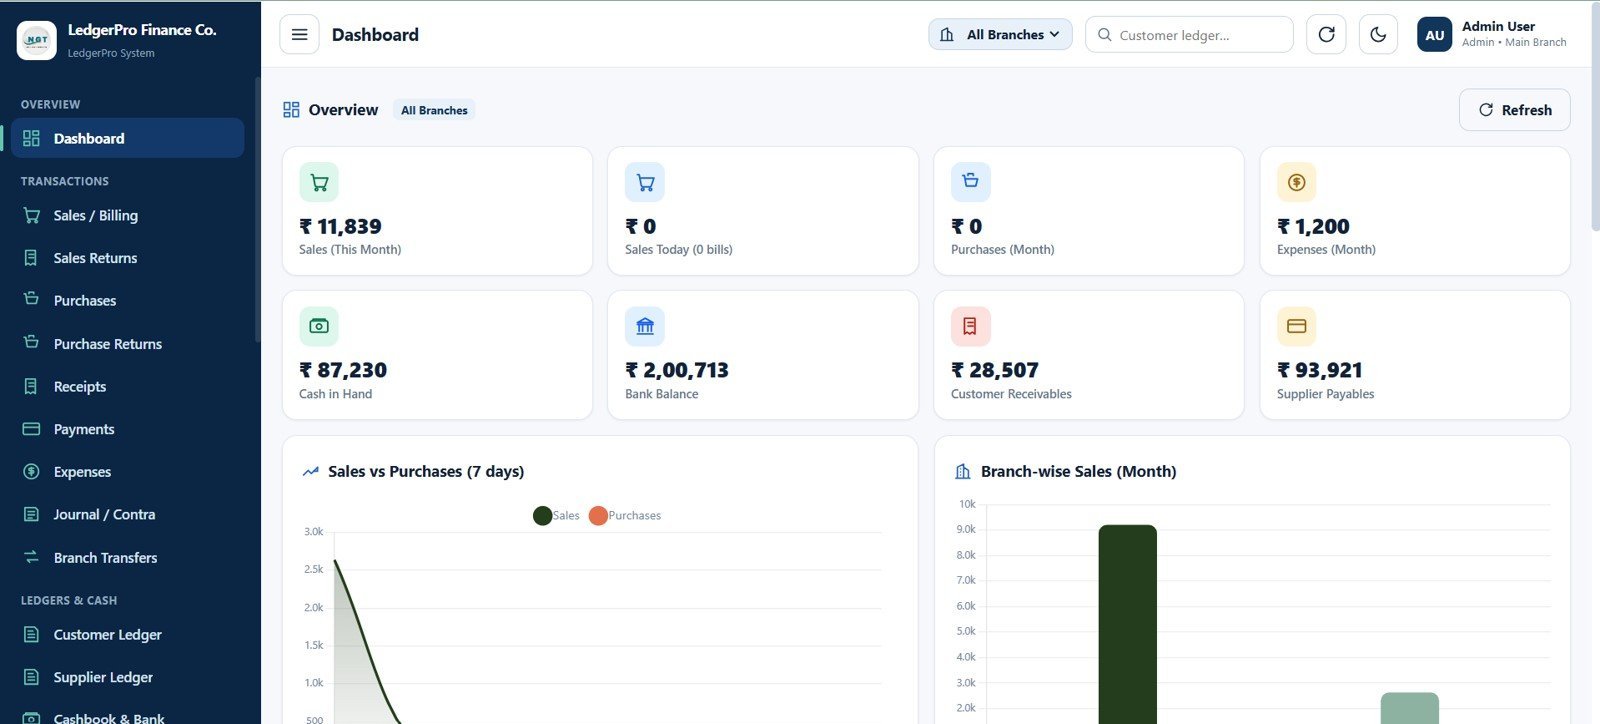
Job in the stack: Track. Format: Web app (Google Apps Script). Price: $39.99 one-time.
What it is: A 30-page Google Apps Script web app that works as a small-business accounting system: sales and billing, purchases, receipts, payments, expenses, journals, customer and supplier ledgers, chart of accounts, cashbook, bankbook and stock.
Who it is for: Bookkeepers and small-business accountants who keep the books in spreadsheets today and want one structured system without a monthly subscription.
What is inside:
- 8 dashboard cards for sales, purchases, expenses, cash, bank, receivables and payables
- Sales invoices and returns with paid amount, balance, approval, print and export
- Supplier bills, purchase returns and supplier payments with payable tracking
- Customer ledger, supplier ledger, chart of accounts, cashbook and bankbook
- 9 role-based logins, including Accountant, Cashier, Approver and Auditor, plus an audit log
How a bookkeeper uses it:
- Record each day’s sales and supplier bills, then read receivables and payables straight from the dashboard cards.
- Give the cashier a login that sees receipts and payments only, while the owner sees everything.
- Pull the customer ledger for any client who disputes a balance, instead of rebuilding it from invoices.
- Hand the auditor a read-only login at year end rather than emailing a folder of spreadsheets.
The live demo on the product page uses sample data, so you can sign in as the Accountant role and test a full invoice-to-payment cycle before you buy. After purchase you deploy your own copy in your Google account in about 15 minutes.
Get the Accounting Ledger Pro Management System Web App for $39.99
Best for: One system for the whole daily ledger, at a one-time price.
2. Accounts Payable and Receivable Calendar in Excel — best value
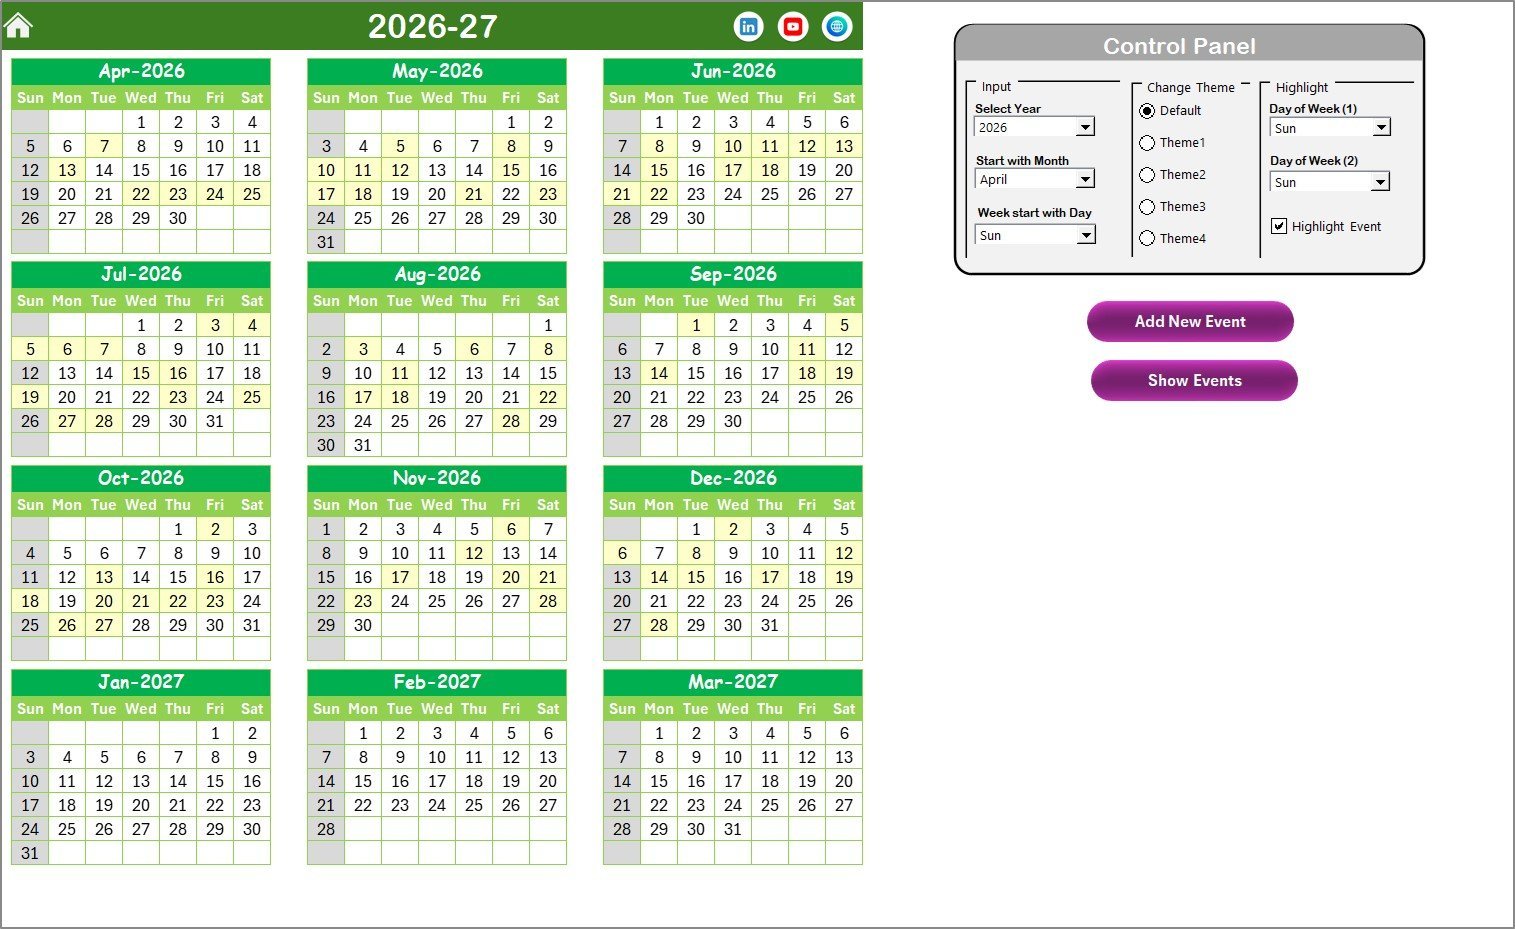
Job in the stack: Plan. Format: Excel. Price: $4.99 one-time.
What it is: An Excel calendar for accounts payable and accounts receivable events, with annual, monthly and daily views and a central events database.
Who it is for: Bookkeepers who miss supplier due dates or forget to chase customer payments because the dates live in emails and sticky notes.
What is inside:
- 5 worksheets: Home, Annual View, Monthly View, Daily View and Events
- A 12-month grid that highlights every payment date
- A daily view that lists all AP and AR events between two dates
- VBA forms to add, update and delete events
- 5 colour themes and weekend highlighting
How a bookkeeper uses it:
- Enter every supplier invoice due date and customer collection date on the day the invoice arrives.
- Run the daily view each Monday for the next 7 days and plan the week’s payments.
- Spot months where large payments cluster and warn the owner before cash runs short.
- Use the annual view to plan quarterly tax and rent dates alongside invoices.
At $4.99 it is the cheapest item in the stack and the fastest win. It works offline in desktop Excel, so it suits bookkeepers who cannot install new software on a client’s machine.
Get the Accounts Payable and Receivable Calendar in Excel for $4.99
Best for: Never missing a payable or receivable date again.
3. Expense & Petty Cash Management System Web App
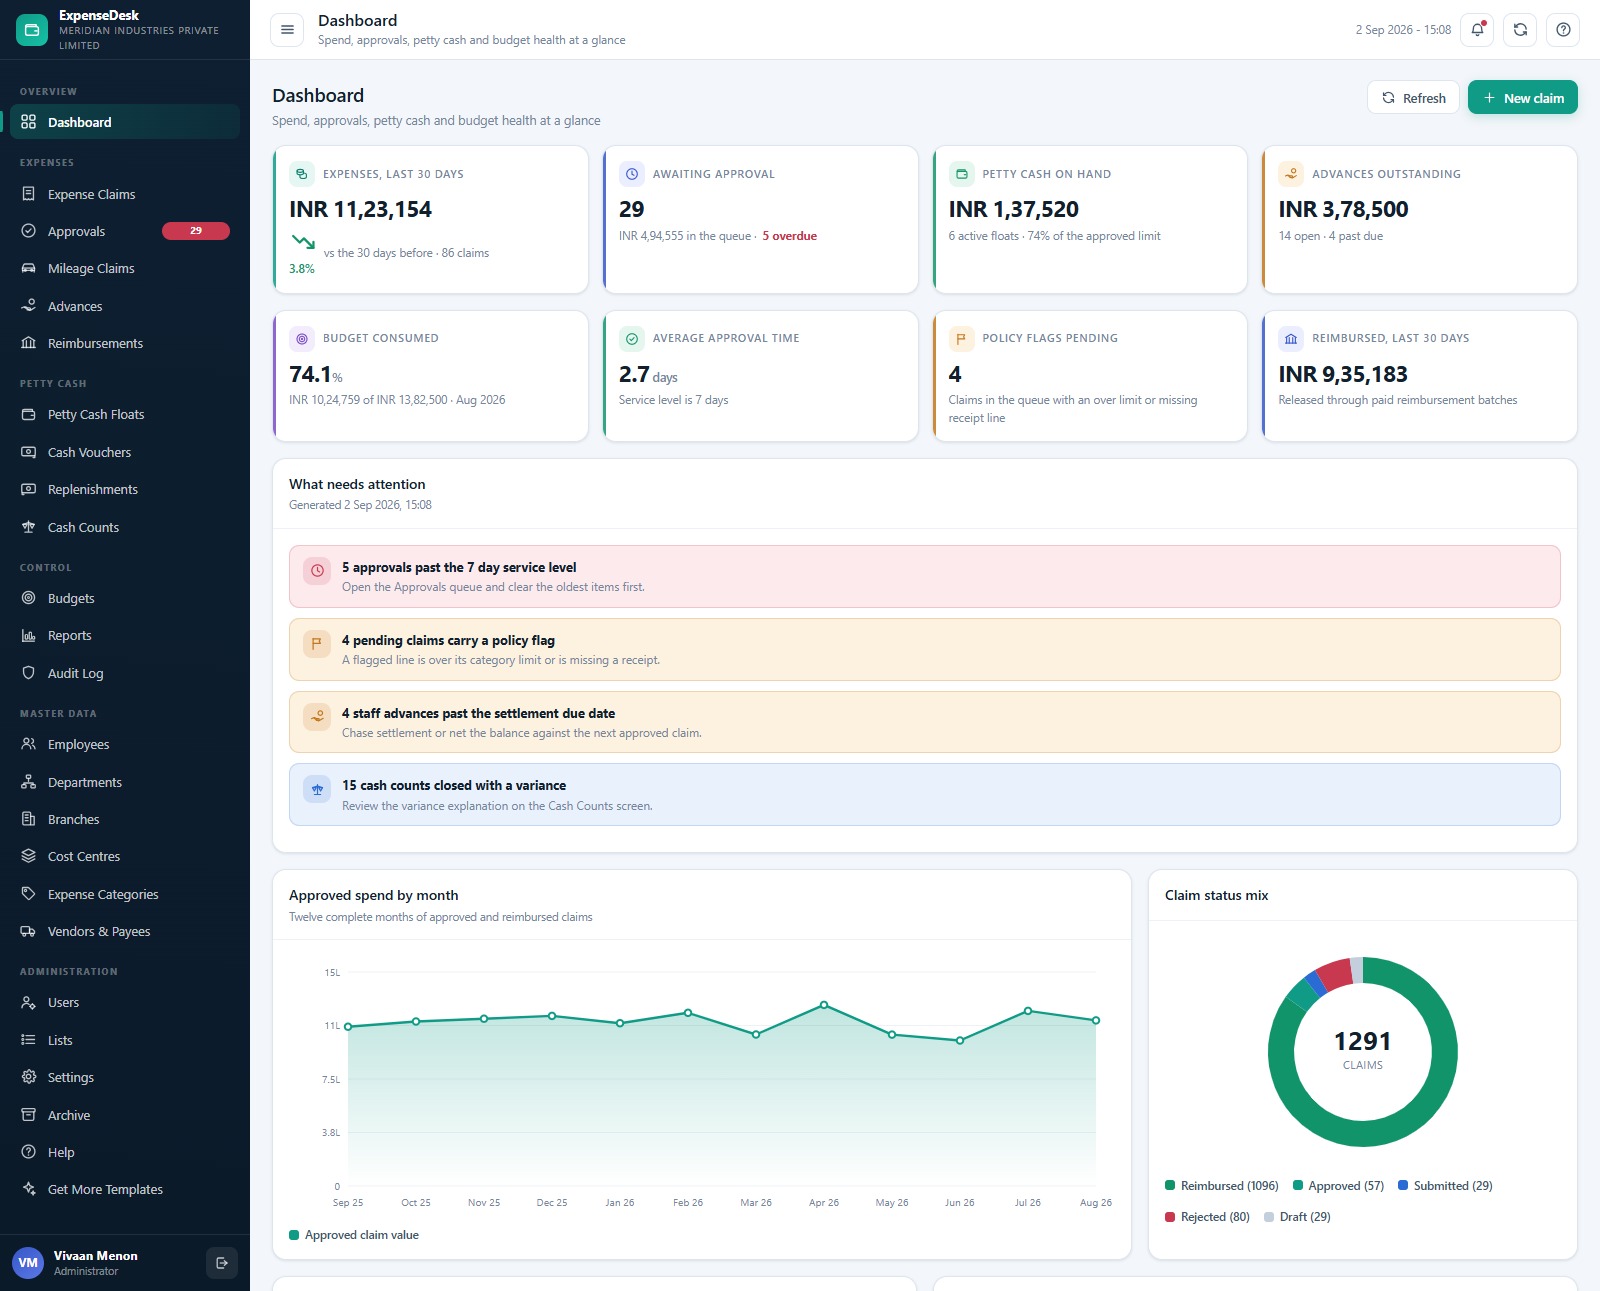
Job in the stack: Track. Format: Web app (Google Apps Script). Price: $39.99 one-time.
What it is: A 25-screen Google Apps Script web app for expense claims, approvals, branch petty cash floats, vouchers, cash counts, advances, mileage and budget vs actual by cost centre.
Who it is for: Bookkeepers who spend hours chasing receipts, approving claims by email and reconciling petty cash boxes that never balance.
What is inside:
- Multi-line expense claims with receipts attached per line and policy limits enforced on save
- A three-tier approval workflow with escalation and a 7-day service level
- One imprest float per branch with a named custodian and a balance that cannot go negative
- Cash counts that require a written explanation for any variance
- 16 finance reports and a full audit trail
How a bookkeeper uses it:
- Have staff submit claims with receipts attached, so nothing reaches the ledger without evidence.
- Run a monthly petty cash count per branch and record the variance with a reason.
- Net employee advances against their next approved claim automatically.
- Compare actual spend by cost centre with budget before the month-end report.
The demo database ships with more than 10,000 sample rows, so every screen and report is populated the first time you open it. Six roles mean employees, custodians and approvers each see only their own screens.
Get the Expense & Petty Cash Management System Web App for $39.99
Best for: Expense claims and petty cash with proper controls.
4. Cash Flow Analysis Pack
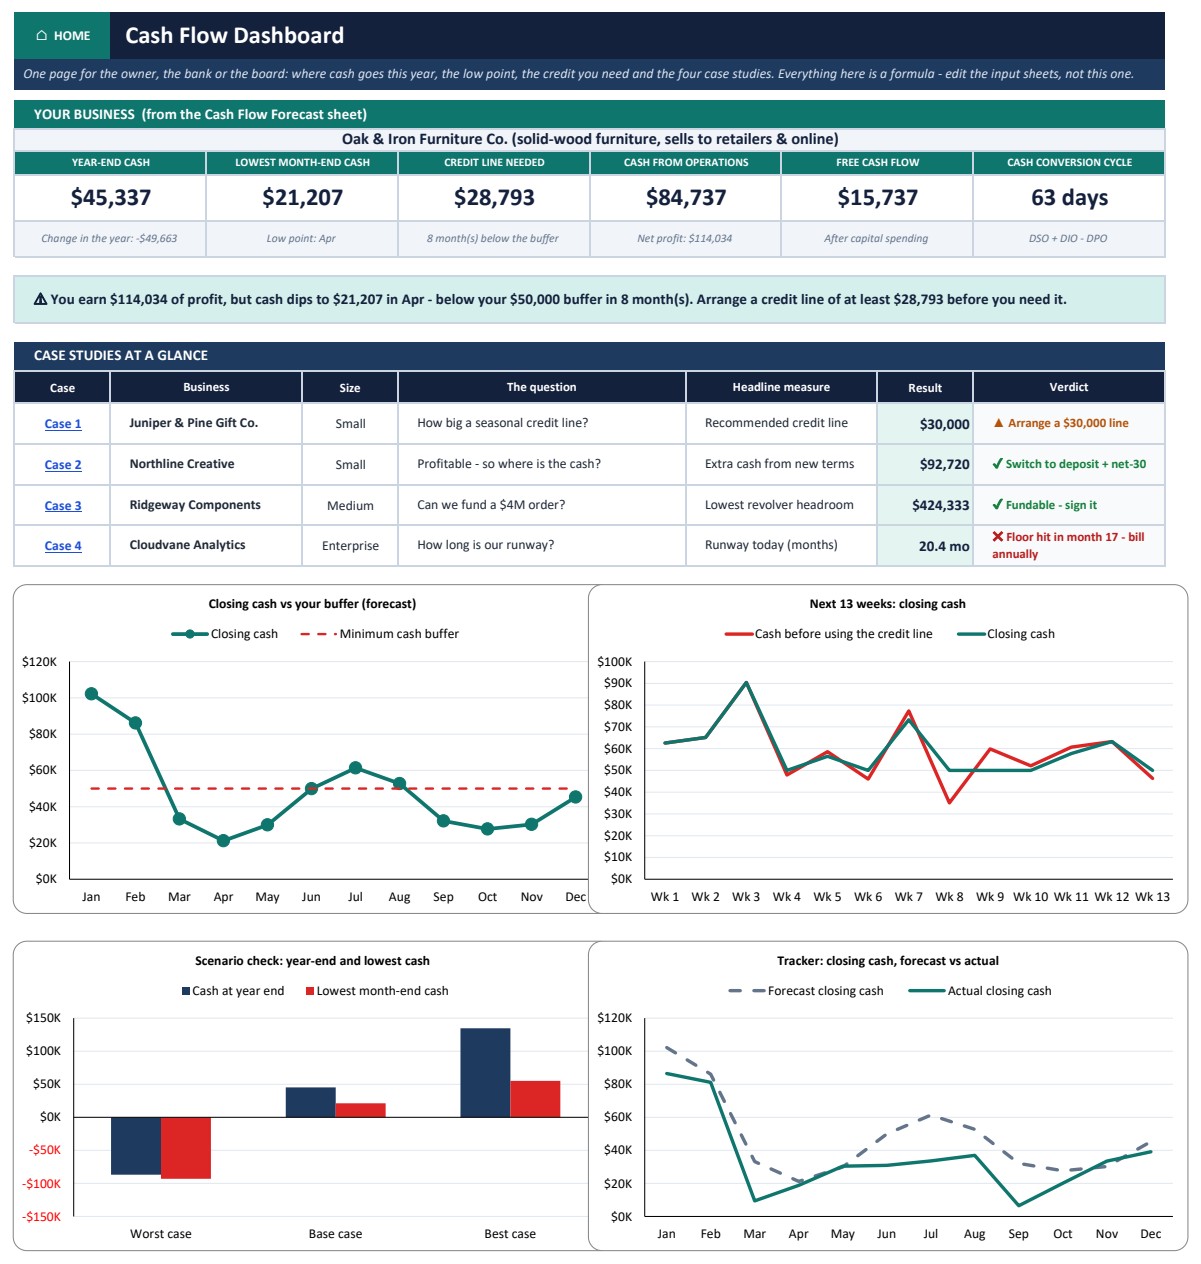
Job in the stack: Plan. Format: Excel + Google Sheets + Power BI. Price: $19.00 one-time.
What it is: A 16-sheet cash flow model with a 12-month forecast, a 13-week cash forecast, a cash flow statement builder, working capital analysis and scenarios, delivered in Excel with Google Sheets and Power BI versions.
Who it is for: Accountants who are asked “we made a profit, so where is the cash?” and need a clear answer for the owner or the bank.
What is inside:
- 12-month cash flow forecast that turns profit into cash month by month
- 13-week cash forecast with weekly receipts, payments and an automatic credit line
- Cash flow statement built from an income statement and two balance sheets, with 6 checks
- Working capital analysis of DSO, DIO and DPO and the cash each lever releases
- Scenario and sensitivity analysis, plus 4 worked case studies
How a bookkeeper uses it:
- Build a 13-week forecast every Monday from the AP and AR calendar dates.
- Show the owner the month when the bank balance hits its low point and how much credit line covers it.
- Test whether offering a 2/10 net 30 early-payment discount is worth the cash it brings in.
- Prepare the cash flow statement for a loan application in under an hour.
The pack also includes a 16-slide PowerPoint deck and a 10-page PDF guide, and every result is a live formula with no macros, so it opens on Excel for Windows or Mac.
Get the Cash Flow Analysis Pack for $19.00
Best for: Cash forecasting and working capital questions.
5. Accounts Payable KPI Dashboard in Google Sheets
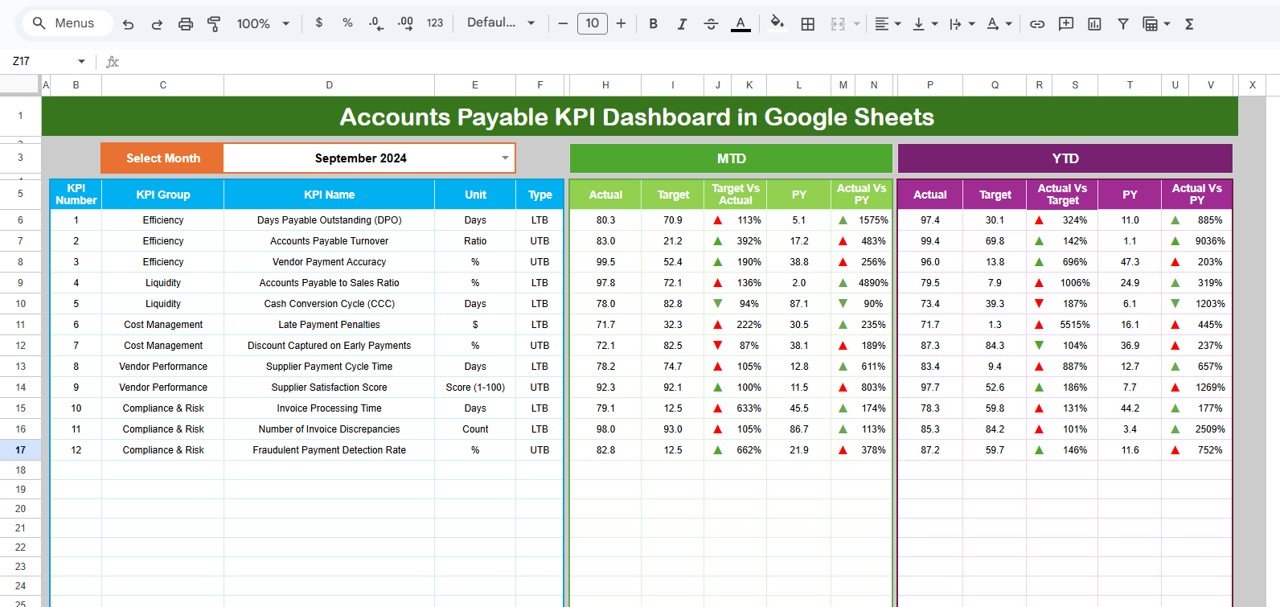
Job in the stack: Report. Format: Google Sheets. Price: $9.99 one-time.
What it is: A Google Sheets KPI dashboard for accounts payable, showing each KPI month to date and year to date against target and the previous year, with a trend sheet for any single KPI.
Who it is for: Bookkeepers who manage supplier payments and need to prove the AP process is getting faster and more accurate.
What is inside:
- MTD and YTD tracking with a one-click month selector
- Target vs actual and previous-year comparisons with up and down arrows
- A KPI trend sheet for month-by-month analysis
- Six structured worksheets for clean data flow
- Real-time sharing through Google Drive
How a bookkeeper uses it:
- Track invoice processing time and on-time payment % each month against a 95% target.
- Share a view-only link with the owner so they can check AP status without asking.
- Spot the months when late payments rise, usually the same months the AP calendar shows clustered due dates.
- Add your own AP KPIs, such as early-payment discounts captured.
The same dashboard is also sold as the Accounts Payable KPI Dashboard in Excel ($12.99) and the Accounts Payable KPI Dashboard in Power BI ($11.99). We picked the Google Sheets edition because bookkeepers often work inside a client’s shared Drive.
Get the Accounts Payable KPI Dashboard in Google Sheets for $9.99
Best for: A monthly AP scorecard that several people can update.
6. Expense Management KPI Dashboard in Google Sheets
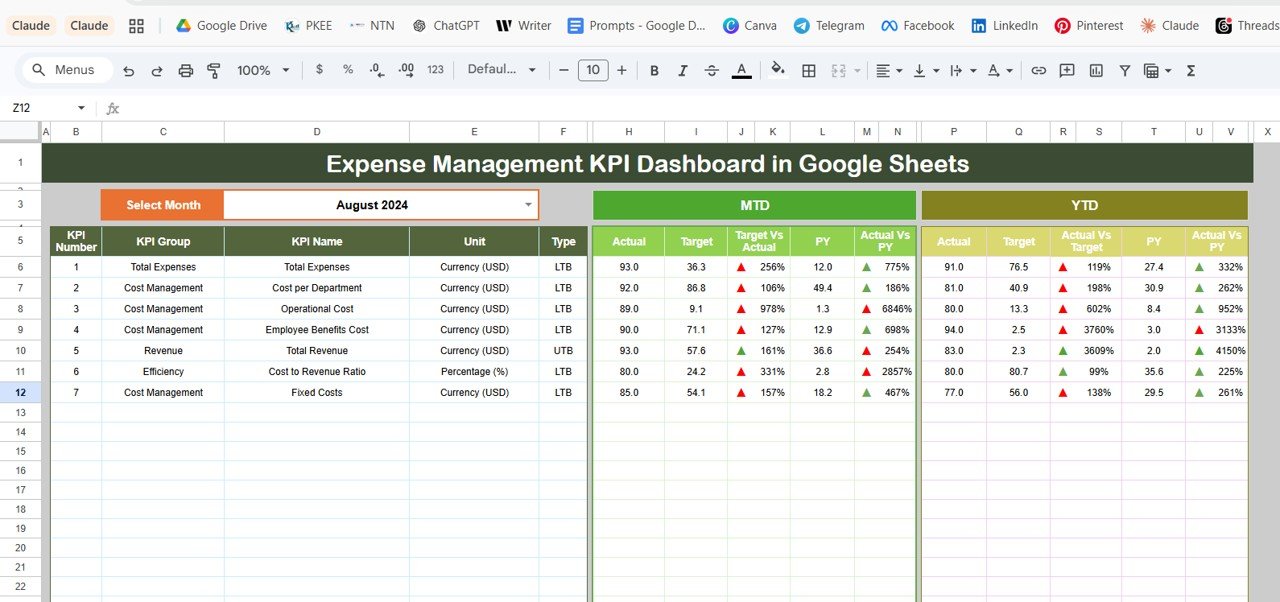
Job in the stack: Report. Format: Google Sheets. Price: $8.99 one-time.
What it is: A Google Sheets KPI dashboard for expense management with MTD and YTD actual, target and previous-year values, a KPI definition sheet and trend charts.
Who it is for: Accountants who need to report spending against budget every month without rebuilding a chart pack.
What is inside:
- Dashboard sheet with MTD and YTD actual, target and previous year
- Month selector that recalculates the whole dashboard
- KPI Trend sheet with MTD and YTD charts for any KPI
- KPI Definition sheet for name, group, unit, formula and type
- Separate input sheets for actuals, targets and previous-year numbers
How a bookkeeper uses it:
- Report expense-to-revenue ratio and cost per department against budget each month.
- Use the definitions sheet to agree each formula with the owner once, then stop arguing about it.
- Feed actuals from the expense web app’s budget vs actual report.
- Show year-over-year cost trends at the annual review.
It needs no add-ons or scripts, so it works in any Google account, and setup takes under 10 minutes.
Get the Expense Management KPI Dashboard in Google Sheets for $8.99
Best for: Monthly expense reporting against budget for $8.99.
7. Finance and Accounting KPI Dashboard in Power BI
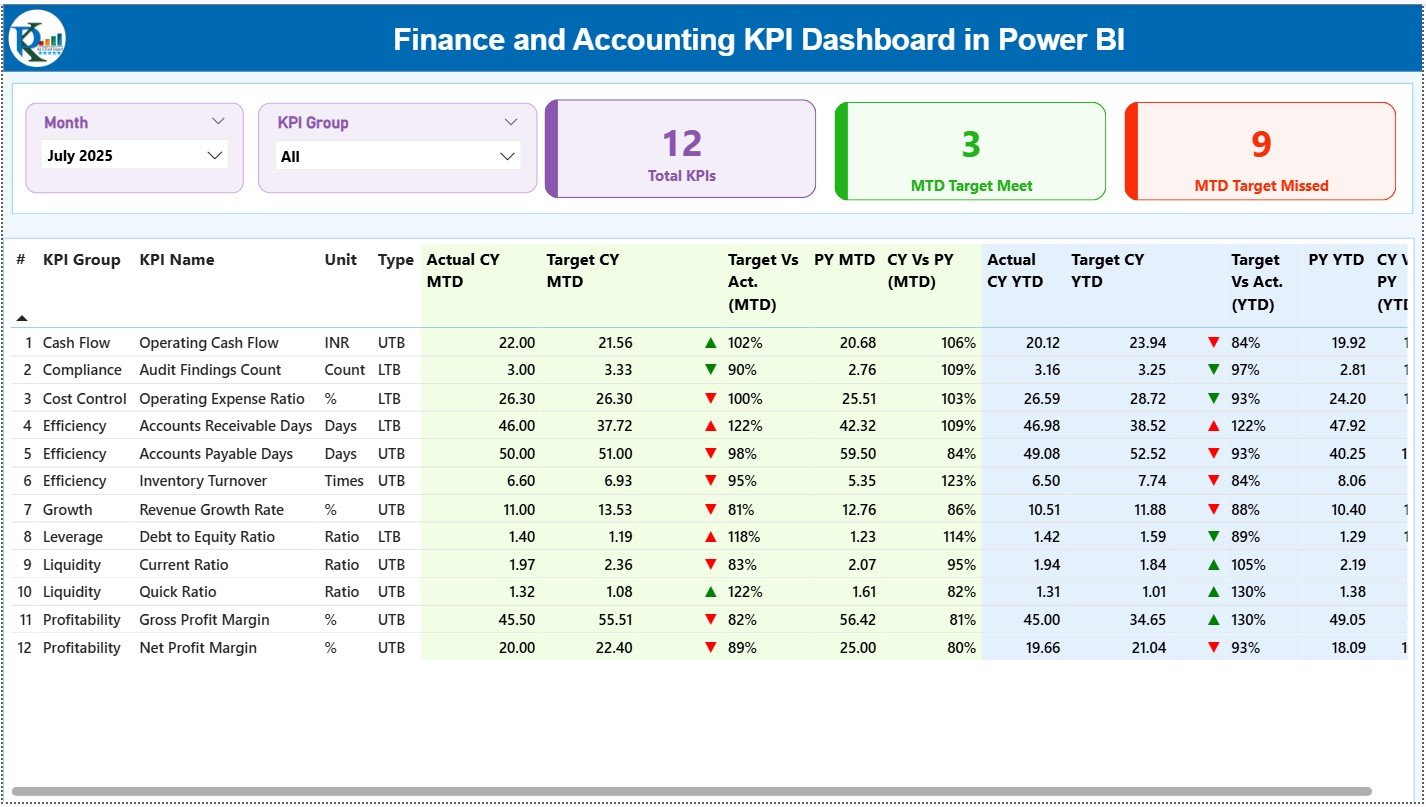
Job in the stack: Present. Format: Power BI. Price: $11.99 one-time.
What it is: A Power BI KPI dashboard for finance and accounting, with MTD and YTD tracking, target vs actual icons, previous-year comparison, slicers and drill-through KPI definitions. Data is entered in Excel.
Who it is for: Accountants who present monthly results to owners or managers who prefer an interactive report to a spreadsheet.
What is inside:
- Centralised finance and accounting KPI view
- MTD and YTD performance side by side
- Target vs actual and previous-year comparisons
- Slicers for month and KPI group
- Drill-through pages with KPI definitions
How a bookkeeper uses it:
- Keep data entry in Excel while the owner reads the Power BI report.
- Walk a client through the month’s results in a 15-minute review using slicers instead of slides.
- Show which KPIs missed target this month and whether they improved year over year.
- Add accounting KPIs to an existing Power BI workspace.
Prefer to stay in Excel? The Finance and Accounting KPI Dashboard in Excel ($14.99) has the same KPI logic. Power BI Desktop is free, so the $11.99 price is the full cost unless you publish to the Power BI service.
Get the Finance and Accounting KPI Dashboard in Power BI for $11.99
Best for: Presenting monthly accounting KPIs in Power BI.
8. Accounting Firm Client Management System Web App
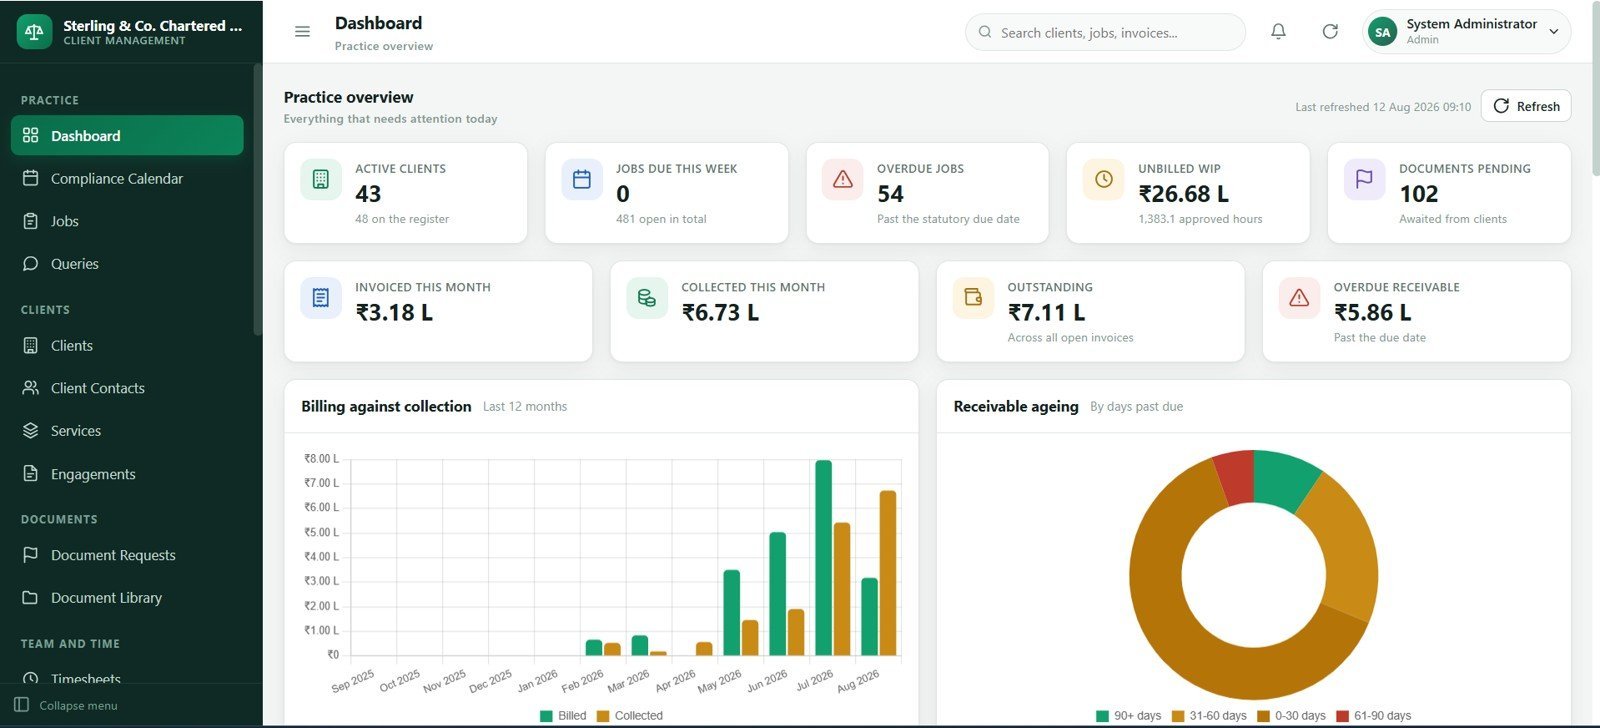
Job in the stack: Present. Format: Web app (Google Apps Script). Price: $39.99 one-time.
What it is: A 24-screen Google Apps Script web app for accounting and bookkeeping practices: clients, contacts, services, recurring compliance jobs, document requests, queries, timesheets, WIP, invoices, receipts and client ledgers.
Who it is for: Freelance bookkeepers and small accounting firms juggling many clients, deadlines and missing documents.
What is inside:
- Practice dashboard with active clients, jobs due this week, overdue jobs, unbilled WIP and receivables
- Compliance calendar of monthly statutory due dates with staff filters
- Document request and client query tracking with reminder counts
- Timesheets with billable hours and billed or unbilled status
- Invoices, receipts, client ledgers, ageing, users, roles and an audit log
How a bookkeeper uses it:
- List every client’s monthly bookkeeping and filing jobs with an owner and due date.
- Chase missing bank statements from the document request list instead of your inbox.
- Log hours per client and bill unbilled WIP at month end.
- See overdue client invoices and ageing on one screen.
It is the only practice-level tool in the stack. A solo bookkeeper with one employer does not need it; a bookkeeper with ten clients will use it every day.
Get the Accounting Firm Client Management System Web App for $39.99
Best for: Bookkeepers and accountants who serve several clients.
How should a bookkeeper roll out this stack in 30 days?
Do not install all eight bookkeeper templates in one weekend. Roll them out in the order the month needs them, so each one is in daily use before the next arrives.
| Week | Template | Job | Done when |
|---|---|---|---|
| Week 1 | Accounts Payable and Receivable Calendar in Excel and Accounting Ledger Pro Management System Web App | Plan + Track | Every open bill and invoice has a due date, and the opening balances are in the ledger |
| Week 2 | Expense & Petty Cash Management System Web App | Track | Staff submit claims with receipts and each petty cash float has a custodian |
| Week 3 | Cash Flow Analysis Pack | Plan | A 13-week cash forecast exists and the low point is known |
| Week 4 | Accounts Payable KPI Dashboard in Google Sheets, Expense Management KPI Dashboard in Google Sheets and Finance and Accounting KPI Dashboard in Power BI | Report + Present | The month-end report runs from dashboards with targets set |
Practices add the Accounting Firm Client Management System Web App in week 1 alongside the ledger, because client deadlines drive everything else. By day 30 you have one ledger, one payment calendar, one expense process, one cash forecast and one monthly report.
How to choose between them
If you can only buy one or two templates now, use this decision table.
| If your biggest problem is… | Buy first | Price |
|---|---|---|
| Supplier bills get paid late | Accounts Payable and Receivable Calendar in Excel | $4.99 |
| The books live in a dozen spreadsheets | Accounting Ledger Pro Management System Web App | $39.99 |
| Petty cash never balances | Expense & Petty Cash Management System Web App | $39.99 |
| The owner keeps asking where the cash went | Cash Flow Analysis Pack | $19.00 |
| You need to prove AP is improving | Accounts Payable KPI Dashboard in Google Sheets | $9.99 |
| Spending runs over budget without warning | Expense Management KPI Dashboard in Google Sheets | $8.99 |
| Clients want a visual monthly report | Finance and Accounting KPI Dashboard in Power BI | $11.99 |
| You serve more than five clients | Accounting Firm Client Management System Web App | $39.99 |
A simple rule: web apps for records several people enter, Excel for files one person owns, Google Sheets for reports several people read, and Power BI for owners who want to click around.
Want the reporting side in one purchase? The Finance & Accounting Command Center bundles 8 Excel, Power BI and Google Sheets finance templates (P&L, cash flow, budgeting, expense tracking and revenue analysis) for $64.99 instead of $102.92 bought separately.
Comparing accounting software as well? Our guides to QuickBooks alternatives in Excel and Google Sheets and Xero alternatives compare templates with those subscriptions, and the payroll Excel template toolkit covers payroll.
When bookkeeper templates are NOT the right answer
Templates are the right tool for a single-entity business or a small practice that already keeps the books in spreadsheets. They are the wrong tool in these situations:
- You need automatic bank feeds. None of these templates connects to your bank. If you reconcile hundreds of card transactions a week, accounting software with bank feeds will save more time than any template.
- You file sales tax or payroll tax from the books. Templates do not file returns. Keep software that is certified for your tax authority, and use the templates for reporting around it.
- You consolidate several companies or currencies. Inter-company eliminations and multi-currency revaluation belong in an accounting system or ERP.
- Your auditor requires a locked, certified ledger. The ledger web app has an audit log, but some regulated businesses must use approved accounting software.
- Nobody will own the files. A template only works if one person updates it on a schedule. If that person does not exist, a bookkeeping service is the better buy.
For record-keeping rules, the IRS guidance on recordkeeping for small businesses explains which records to keep and for how long, whichever tool you use.
Frequently asked questions
What templates does a bookkeeper need?
A bookkeeper needs four kinds of templates: a ledger for daily entries, a due-date calendar for payables and receivables, an expense and petty cash tracker, and a monthly KPI report. This stack covers all four, plus a cash forecast and a client manager for bookkeepers who work for several businesses.
Are bookkeeper templates in Excel good enough for a small business?
Yes, for a single-entity business with a few hundred transactions a month. Excel and Google Sheets templates handle ledgers, AP and AR tracking and monthly reporting well. Once you need bank feeds, payroll tax filing or multi-entity consolidation, move the ledger to accounting software and keep the templates for reporting.
Can these templates replace QuickBooks or Xero?
Partly. The Accounting Ledger Pro web app covers sales, purchases, receipts, payments, ledgers, cashbook and bankbook, which is the core of what many small firms use QuickBooks or Xero for. It does not file taxes, pull bank feeds automatically or run payroll, so businesses that depend on those features should keep their subscription.
What is the difference between a bookkeeper and an accountant template?
Bookkeeper templates record and track transactions: ledgers, payables, receivables, expenses and petty cash. Accountant templates analyse and present those records: KPI dashboards, cash forecasts and client reports. Most small-business finance people do both jobs, which is why this stack combines tracking tools with reporting dashboards.
Do I need Power BI to use this stack?
No. Five of the eight templates run in Excel, Google Sheets or a Google Apps Script web app. Only the Finance and Accounting KPI Dashboard is a Power BI file, and Power BI Desktop is a free download. You need a paid Power BI licence only to share reports through the Power BI service.
How do the web app templates work?
The three web apps are Google Apps Script projects. After purchase you receive the source code and a deployment guide, paste it into a new Apps Script project in your own Google account and deploy it, which takes about 15 minutes. Your data stays in a Google Sheet that you own.
Which accounts payable KPIs should a bookkeeper track?
Start with days payable outstanding, invoice processing time, percentage of invoices paid on time, early-payment discounts captured and the count of overdue invoices. The Accounts Payable KPI Dashboard tracks your chosen KPIs month to date and year to date against target and the previous year.
How much does the full bookkeeper template stack cost?
All eight templates cost $174.93 in one-time payments, with no monthly fees or per-user charges. You do not need all eight on day one. Most bookkeepers start with the $4.99 AP and AR calendar and the $39.99 ledger web app, then add reporting tools later.
Can I use these accountant templates for several clients?
Yes. Make a separate copy of each Excel or Google Sheets template per client so their data never mixes. For a practice with many clients, the Accounting Firm Client Management System web app holds all clients, jobs, timesheets and invoices in one workspace with role-based logins.
Is there a free bookkeeping template I should try first?
The templates in this stack are paid, but each product page shows screenshots, and the three web apps have a live demo with sample data you can test before buying. The lowest-cost starting point is the Accounts Payable and Receivable Calendar in Excel at $4.99.
Get more bookkeeper and accountant templates
Start with the Accounting Ledger Pro Management System Web App ($39.99) and add the Accounts Payable and Receivable Calendar in Excel ($4.99) before your next month end. For the reporting side, the Finance & Accounting Command Center bundles 8 finance templates for $64.99, a 37% saving.
Browse more finance tools in our premium Power BI templates under $20, our list of 25 best-selling business templates and the supplier management Excel templates for vendor tracking.
Watch the templates in action on the NextGenTemplates YouTube channel. Power BI licence pricing is published on Microsoft’s Power BI pricing page.