

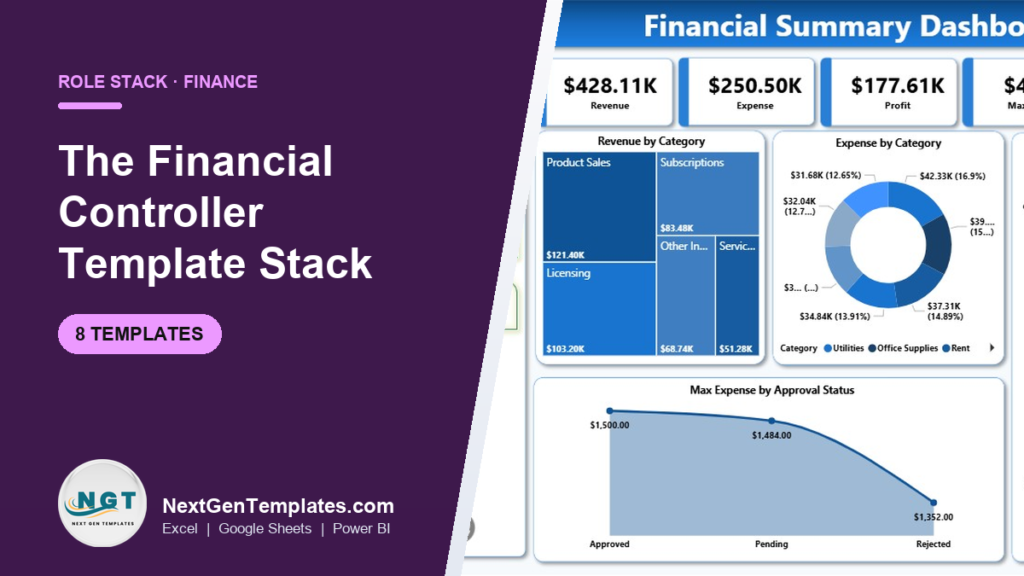
The best financial controller Excel templates cover four jobs: planning the close, tracking audit work, reporting the numbers and presenting them to leadership. This stack of 8 templates does all four for about $90 in one-time payments. Start with the Financial Auditing KPI Dashboard in Excel ($14.99), then add the rest as your close matures.
Last updated: October 2026
Key takeaways
- A financial controller needs templates for four jobs: plan the close, track audit work, report results and present to leadership.
- The full 8-template stack costs $90.42 in one-time payments, roughly what close-management software charges per user per month.
- The Financial Auditing KPI Dashboard in Excel ($14.99) is the best overall pick because it reports MTD and YTD actuals against target and prior year.
- The cheapest wins are the planning tools: the year-end close calendar ($4.99) and the audit preparation checklist ($3.49).
- Templates suit teams that close in Excel today; companies with multi-entity consolidation or SOX controls testing should look at dedicated software.
Financial controller Excel templates compared
Every template in this stack, its format, the job it does in a controller’s month and its one-time price. The last column names the paid tool it can replace for a small or mid-sized finance team.
| Template | Format | Job | Best For | What it replaces | Price |
|---|---|---|---|---|---|
| Financial Auditing KPI Dashboard in Excel (Best overall) | Excel | Report | Monthly KPI pack with MTD/YTD vs target and prior year | Ad-hoc KPI decks, BI seat for one analyst | $14.99 |
| Financial Summary Dashboard in Power BI | Power BI | Report | Revenue, expense and profit by department and owner | Paid management-reporting add-ons | $17.99 |
| Financial Year-End Close Calendar in Excel (Best value) | Excel | Plan | Year-end close deadlines in annual, monthly and daily views | Close-calendar module of close software | $4.99 |
| Financial Auditing Dashboard in Excel | Excel | Track | Audit findings, risks and corrective actions in Excel | Spreadsheet trackers emailed between reviewers | $13.99 |
| Financial Audit Preparation Checklist in Google Sheets | Google Sheets | Track | Shared pre-audit task checklist with progress charts | Task boards used only at audit time | $3.49 |
| Financial Audit Calendar in Excel | Excel | Plan | Internal and external audit schedule for the year | Shared Outlook calendars with no event log | $4.99 |
| Financial Auditing Dashboard in Power BI | Power BI | Present | Interactive audit view for the CFO and audit committee | Audit-management software dashboards | $17.99 |
| Financial Auditing KPI Dashboard in Power BI | Power BI | Present | Audit KPIs with target and year-over-year trend in Power BI | Custom Power BI build by a consultant | $11.99 |
How we picked these
We searched more than 1,000 paid templates in the NextGenTemplates catalogue for anything a controller touches between day one of the close and the audit committee meeting. Financial controller Excel templates had to earn a place by doing a real month-end job, not by looking good in a screenshot, and the same test applied to the Google Sheets and Power BI editions. We kept only templates with a working dashboard or calendar, a clear data-entry sheet and a one-time price under $20.
We left out personal-finance files, single-purpose invoices and anything that duplicated a better pick in the same format. Each template was then assigned to one of four jobs (plan, track, report, present), so the stack has no gaps and no overlap. Only one item per job and format made the list, except where Excel and Power BI editions serve different audiences.
What does a financial controller actually need from templates?
A controller’s month runs on a predictable loop. The close has to be planned, reconciliations and audit requests have to be tracked, results have to be reported, and the story has to be presented to the CFO. Most finance teams already do all four in spreadsheets, which is why searches for financial reporting templates in Excel keep growing. The problem is that those spreadsheets are rebuilt every quarter and nobody trusts the version on the shared drive.
The metrics a controller is judged on are simple to state and hard to keep current:
| Controller KPI | Formula | Typical target |
|---|---|---|
| Days to close | Business days from period end to final ledger lock | 5 days or fewer for strong teams; many small teams sit at 8 to 10 |
| Budget variance % | (Actual − Budget) ÷ Budget × 100 | Within ±5% on major cost lines |
| Reconciliation completion rate | Accounts reconciled on time ÷ accounts due × 100 | 100% of balance-sheet accounts each month |
| Audit findings closed on time | Findings closed by due date ÷ findings due × 100 | 90% or higher |
| Days sales outstanding (DSO) | Accounts receivable ÷ credit sales × days in period | Below your payment terms plus 10 days |
The eight templates below map to these numbers. The planning tools shorten days to close, the tracking tools raise reconciliation and findings-closure rates, and the reporting dashboards make budget variance visible every month instead of every quarter. If you also own the cash and budget side, our CFO dashboard template stack covers cash flow, budgeting and profit analysis.
The 8 best financial controller templates for 2026
1. Financial Auditing KPI Dashboard in Excel — best overall

Job in the stack: Report. Format: Excel. Price: $14.99 one-time.
What it is: An Excel KPI dashboard that turns monthly finance and audit data into an MTD and YTD scorecard with target and previous-year comparisons.
Who it is for: Controllers who send a monthly KPI pack to the CFO and want it built in the tool the team already uses.
What is inside:
- A month dropdown that refreshes every KPI card and chart at once
- MTD and YTD actual vs target vs previous year
- Automatic Target vs Actual % and PY vs Actual % variance
- Up and down arrow indicators from conditional formatting
- A KPI definitions sheet so every metric has one agreed formula
How a controller uses it:
- Report days to close against a 5-day target each month and show the trend since January.
- Show budget variance on the top 10 cost lines with a red arrow on anything over 5%.
- Give the CFO a one-page YTD view before the monthly review instead of a 20-tab workbook.
It ranks first because it covers the controller’s most visible deliverable, the monthly KPI pack, in Excel, with no BI licence needed. Every other template in the stack feeds it.
Get the Financial Auditing KPI Dashboard in Excel for $14.99
Best for: Controllers who want one trusted monthly scorecard in Excel.
2. Financial Summary Dashboard in Power BI — best for management reporting

Job in the stack: Report. Format: Power BI. Price: $17.99 one-time.
What it is: A Power BI report that brings revenue, expenses and profit into one view, with month slicers and drill-downs by category, department and responsible person.
Who it is for: Controllers whose leadership team already reads reports in Power BI, or who are moving the monthly pack off email.
What is inside:
- Revenue, expense and profit KPI cards
- Category and department breakdowns
- Performance by responsible person
- Month-based trend visuals with slicers
- Refresh from an Excel data source
How a controller uses it:
- Show department heads exactly where their spend sits against budget, without sending each a separate file.
- Spot a cost category that grew faster than revenue for three months running.
- Run the monthly business review from one interactive report instead of screenshots.
Power BI Pro costs $14 per user per month, so the template itself is the cheap part. What it saves is the 20 to 40 hours a consultant would bill to design the same report.
Get the Financial Summary Dashboard in Power BI for $17.99
Best for: Teams that present financials in Power BI.
3. Financial Year-End Close Calendar in Excel — best value
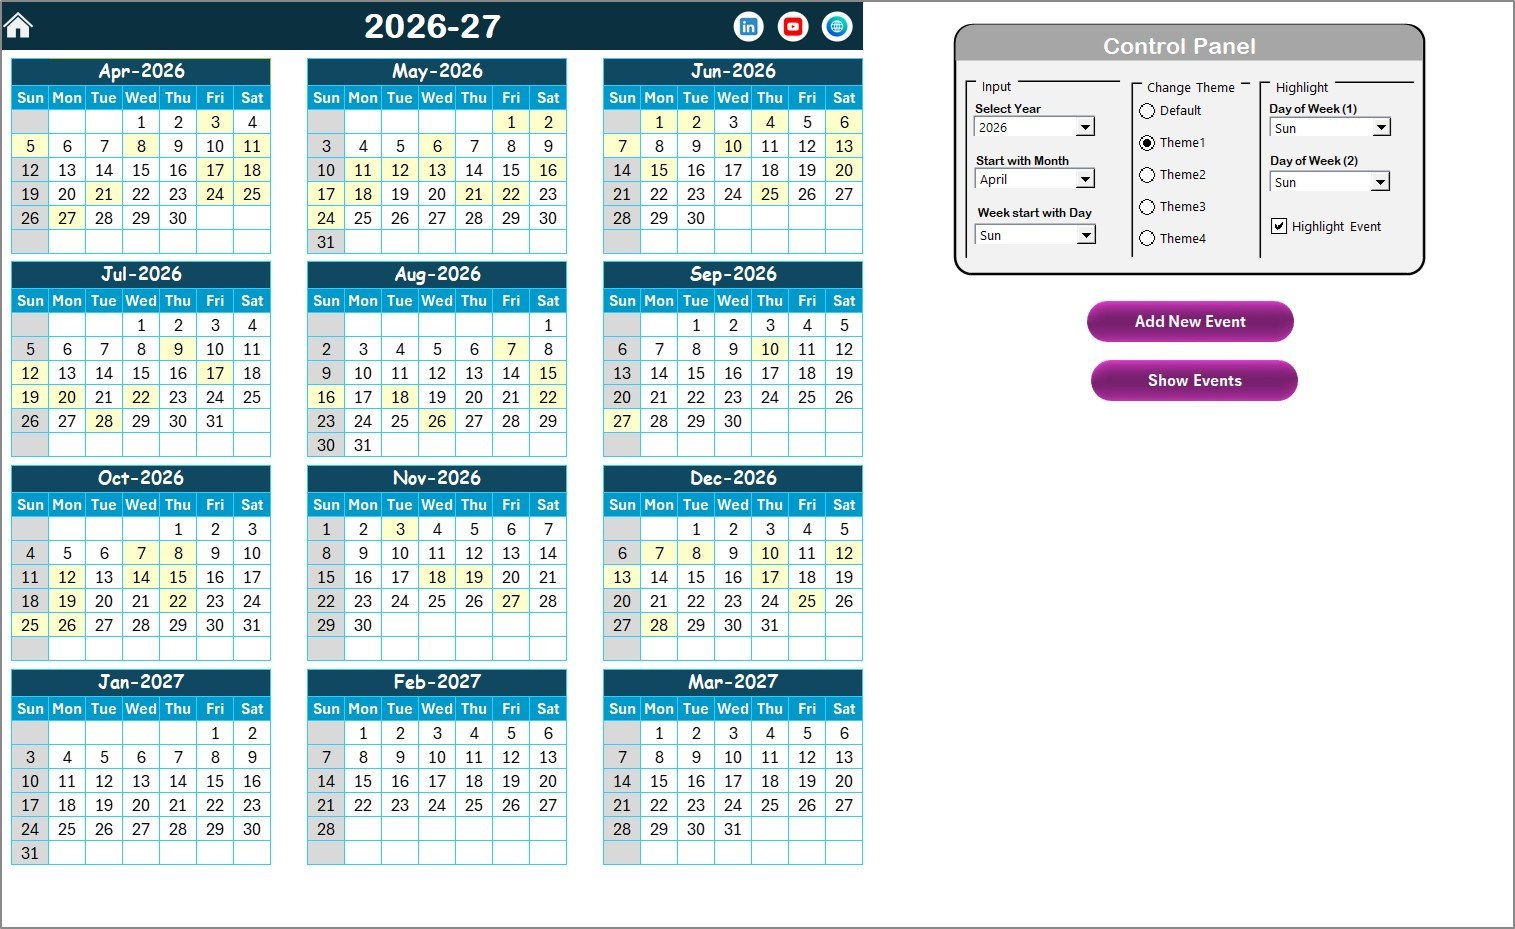
Job in the stack: Plan. Format: Excel. Price: $4.99 one-time.
What it is: An Excel calendar for the year-end close with annual, monthly and daily views and a central events database.
Who it is for: Controllers who run the year-end close from a task list in an email thread and keep missing one deadline every year.
What is inside:
- 5 worksheets: Home, Annual, Monthly, Daily and Events
- Events logged with date, time, location and description
- Year, starting month and starting weekday controls for fiscal years
- 5 built-in colour themes with weekend and event highlighting
- Daily view filtered by a custom date range
How a controller uses it:
- Map every year-end task, such as accruals, inventory count and fixed-asset roll-forward, to a date and an owner.
- Filter the daily view to the first 10 business days of January to see the critical path.
- Set the starting month to April or July for a non-calendar fiscal year.
At $4.99 it is the cheapest way to shave days off the close, because most late closes come from tasks that started late rather than tasks that took long.
Get the Financial Year-End Close Calendar in Excel for $4.99
Best for: Planning year-end deadlines for a 2 to 15 person finance team.
4. Financial Auditing Dashboard in Excel — best for tracking audit findings
Job in the stack: Track. Format: Excel. Price: $13.99 one-time.
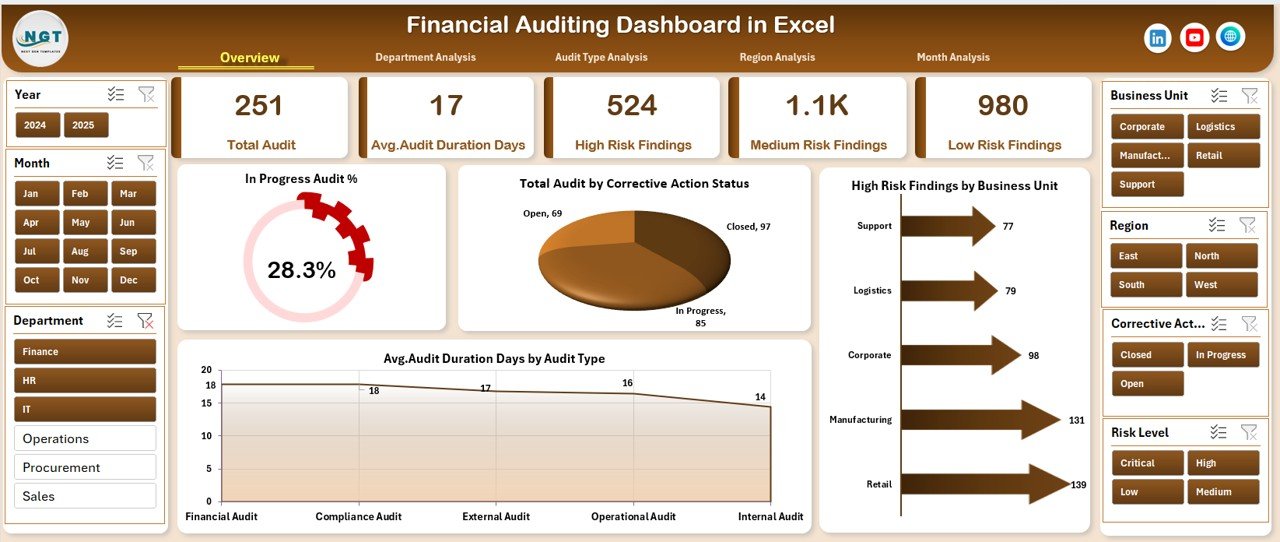
What it is: An Excel dashboard that tracks audit activities, findings, risk levels and corrective actions across departments, audit types, regions and periods.
Who it is for: Controllers who own internal audit follow-up or answer external auditors’ management letter points.
What is inside:
- Centralised audit monitoring in one dashboard
- KPI cards for audit progress and compliance
- Slicers for department, audit type, region and period
- Charts for findings by risk level
- Corrective action status tracking
How a controller uses it:
- Track every management-letter point from last year’s audit to closure before fieldwork starts.
- Show which department has the most open high-risk findings.
- Report findings closed on time against a 90% target each quarter.
Findings that stay open into the next audit are the fastest way to lose an auditor’s trust. This puts the open list in front of you every week.
Get the Financial Auditing Dashboard in Excel for $13.99
Best for: Following up internal and external audit findings in Excel.
Building the whole controller stack? Start with the Financial Auditing KPI Dashboard in Excel at $14.99 and the Financial Year-End Close Calendar in Excel at $4.99. Together they cover the monthly report and the close plan for under $20. For cash flow, budget and profit templates in all three formats, the CFO’s Financial Command Toolkit bundles 10 templates for $62.99.
5. Financial Audit Preparation Checklist in Google Sheets — best for team audit prep
Job in the stack: Track. Format: Google Sheets. Price: $3.49 one-time.
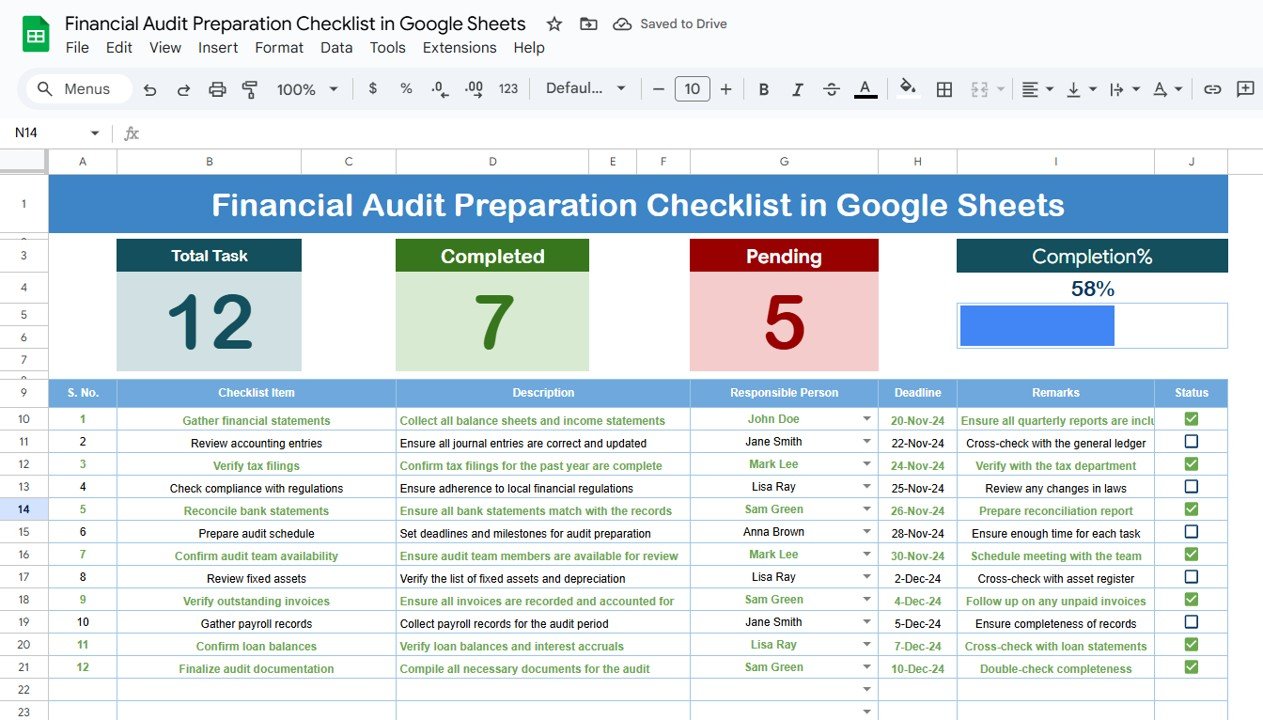
What it is: A Google Sheets checklist for everything that must be ready before auditors arrive, with progress formatting and charts.
Who it is for: Distributed finance teams who need several people updating one pre-audit list at the same time.
What is inside:
- Customisable audit items for balance sheet, income statement and tax documents
- Conditional formatting for completed and pending tasks
- Progress charts
- Real-time multi-user editing in Google Sheets
- Built-in formulas for completion tracking
How a controller uses it:
- Assign the PBC (prepared by client) list to owners and watch completion climb towards 100%.
- Share a view-only link with the audit senior so they see status without asking.
- Reuse the same list next year and start four weeks earlier.
At $3.49 it is the cheapest item in the stack, and it removes the most painful email chain in the controller’s year.
Get the Financial Audit Preparation Checklist in Google Sheets for $3.49
Best for: Shared pre-audit checklists in Google Sheets.
6. Financial Audit Calendar in Excel — best for audit scheduling
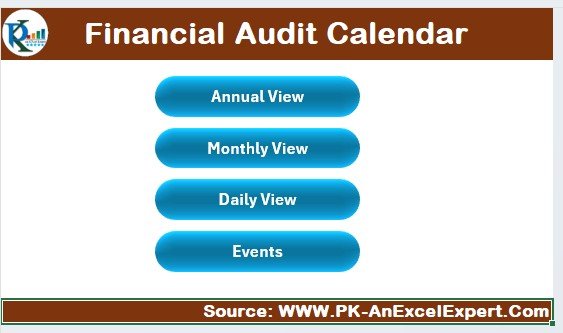
Job in the stack: Plan. Format: Excel. Price: $4.99 one-time.
What it is: An Excel calendar for the full audit year, covering internal reviews, external fieldwork, tax filings and committee dates.
Who it is for: Controllers who juggle several audits and reviews a year and need one calendar everyone can read.
What is inside:
- Home sheet with navigation buttons
- Annual view with year and starting-month controls
- Monthly view for a selected month
- Daily view for a chosen date range
- Events database for every scheduled audit event
How a controller uses it:
- Put interim fieldwork, year-end fieldwork and audit committee dates on one annual view.
- Avoid booking an internal review in the same week as the close.
- Hand the events list to a new team member as the audit-year briefing.
It pairs with the year-end close calendar: one plans the close, the other plans the audits. Prefer collaboration? The Excel edition also comes as a Financial Audit Calendar in Google Sheets at the same $4.99.
Get the Financial Audit Calendar in Excel for $4.99
Best for: One shared audit calendar in Excel.
7. Financial Auditing Dashboard in Power BI — best for the audit committee
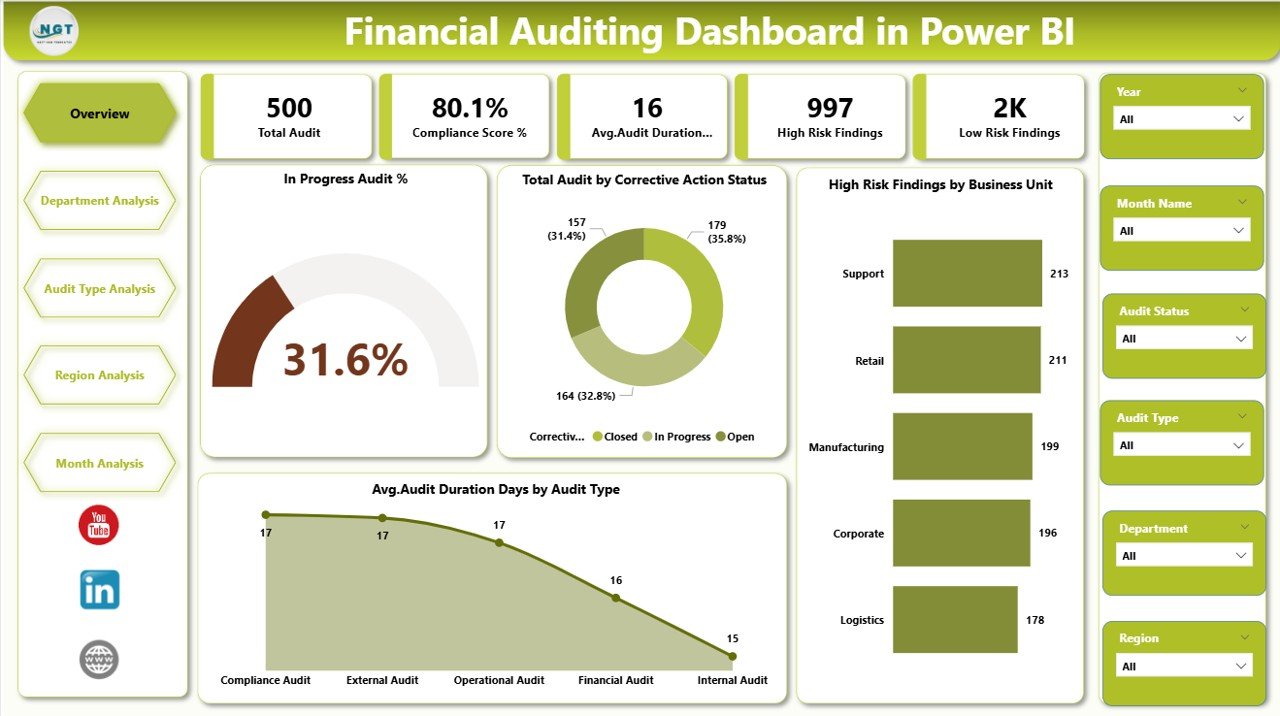
Job in the stack: Present. Format: Power BI. Price: $17.99 one-time.
What it is: The Power BI edition of the auditing dashboard, built for interactive review of audit progress, risk findings and compliance by department.
Who it is for: Controllers who present audit status to the CFO, board or audit committee and need to answer drill-down questions live.
What is inside:
- Centralised audit monitoring
- Interactive KPI cards for audit health
- Dynamic filters and slicers
- Departmental compliance comparison
- Trend visuals that update on data refresh
How a controller uses it:
- Answer “which findings are still open in procurement?” in the meeting instead of after it.
- Compare compliance performance across departments quarter by quarter.
- Publish one report to the Power BI service instead of emailing PDFs.
The Excel edition tracks; this edition presents. Buy both if the person updating the data is not the person in front of the committee.
Get the Financial Auditing Dashboard in Power BI for $17.99
Best for: Presenting audit status in Power BI.
8. Financial Auditing KPI Dashboard in Power BI — best budget Power BI option
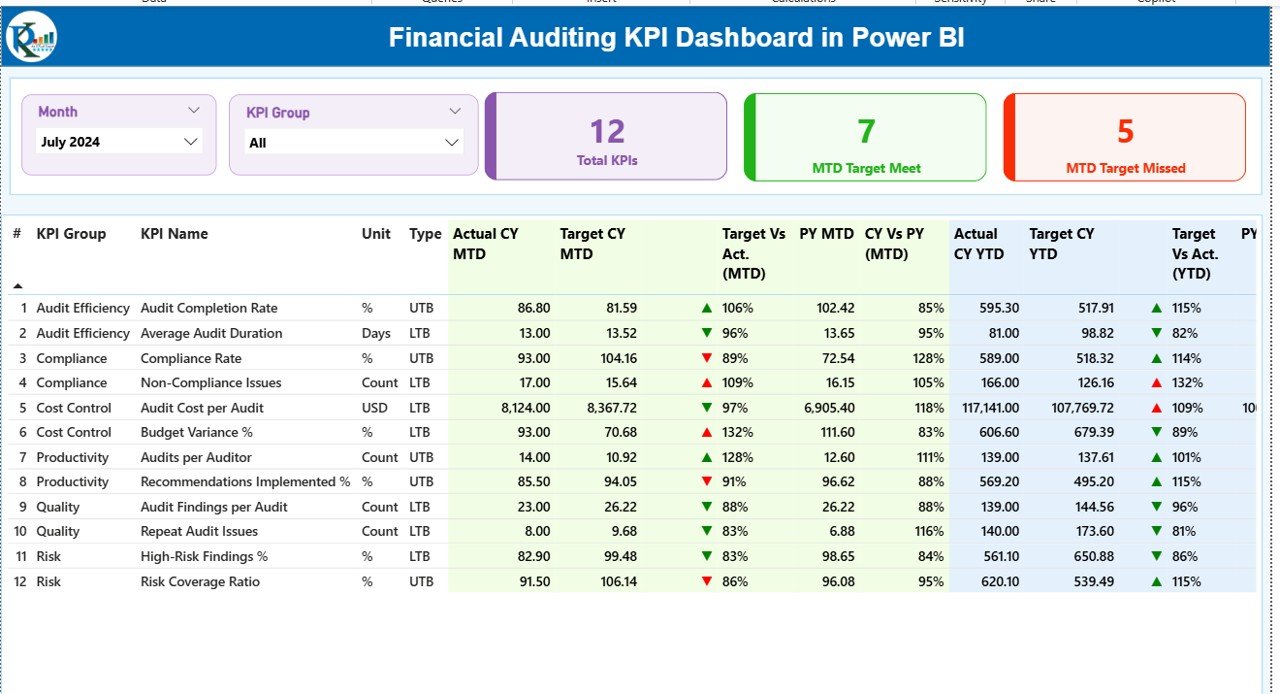
Job in the stack: Present. Format: Power BI. Price: $11.99 one-time.
What it is: A Power BI KPI dashboard for audit metrics with MTD and YTD analysis, target vs actual icons and year-over-year trends, fed from an Excel file.
Who it is for: Controllers who like the Excel KPI dashboard but report to leaders who live in Power BI.
What is inside:
- Centralised audit KPI monitoring
- MTD and YTD analysis side by side
- Target vs actual comparison with icons and percentages
- Year-over-year trend analysis
- Excel data source: update the file, refresh, done
How a controller uses it:
- Keep data entry in Excel while leadership reads the Power BI report.
- Show year-over-year improvement in findings closure after a process change.
- Add audit KPIs to an existing Power BI workspace for finance.
At $11.99 it is the cheapest Power BI file here, and because it reads an Excel source, nobody on the team needs to learn DAX to keep it current.
Get the Financial Auditing KPI Dashboard in Power BI for $11.99
Best for: Audit KPIs in Power BI on a small budget.
How should a controller roll out this stack in 30 days?
Do not install all eight at once. Roll them out in the order the month needs them, so each one is in use before the next arrives.
| Week | Template | Job | Done when |
|---|---|---|---|
| Week 1 | Financial Year-End Close Calendar in Excel and Financial Audit Calendar in Excel | Plan | Every close task and audit date has an owner and a date |
| Week 2 | Financial Audit Preparation Checklist in Google Sheets and Financial Auditing Dashboard in Excel | Track | Open audit findings and PBC items live in one place |
| Week 3 | Financial Auditing KPI Dashboard in Excel | Report | Month-end KPIs are filled from the ledger, with targets set |
| Week 4 | Financial Summary Dashboard in Power BI, Financial Auditing Dashboard in Power BI or Financial Auditing KPI Dashboard in Power BI | Present | The CFO review runs from the dashboard, not a slide deck |
By day 30 you have one close plan, one audit tracker, one KPI pack and one leadership view. The next close measures whether days to close actually fell.
How to choose between them
If you can only buy one or two templates now, use this decision table.
| If your biggest problem is… | Buy first | Price |
|---|---|---|
| The close runs late every month | Financial Year-End Close Calendar in Excel | $4.99 |
| The CFO wants a monthly KPI pack | Financial Auditing KPI Dashboard in Excel | $14.99 |
| Leadership reads everything in Power BI | Financial Summary Dashboard in Power BI | $17.99 |
| Audit fieldwork starts in a panic | Financial Audit Preparation Checklist in Google Sheets | $3.49 |
| Last year’s audit findings are still open | Financial Auditing Dashboard in Excel | $13.99 |
| You present to an audit committee | Financial Auditing Dashboard in Power BI | $17.99 |
A simple rule: Excel for the people who update the numbers, Power BI for the people who read them. Google Sheets is the right call only when several people must edit the same list at the same time.
Looking at accounting software as well? Our guide to QuickBooks alternatives in Excel and Google Sheets covers the bookkeeping side, and the Gusto alternatives for payroll post covers payroll templates.
If your team also does the day-to-day books, the bookkeeper templates stack covers the ledger, AP and AR calendar, expenses and petty cash.
When financial controller Excel templates are NOT the right answer
Templates are the right tool for a single-entity business with a small finance team that already closes in Excel. They are the wrong tool in four situations:
- Multi-entity consolidation. If you consolidate several legal entities with intercompany eliminations and currency translation, you need consolidation software or ERP functionality, not a dashboard.
- SOX or formal controls testing. Public companies that must evidence control testing need an audit trail, sign-offs and access control. Tools such as AuditBoard or a close platform like BlackLine or FloQast are sold on quote for that reason.
- Automated reconciliations at volume. If you reconcile thousands of bank lines a day, transaction-matching software will beat any spreadsheet.
- No owner for the data. A dashboard only shows what someone types or pastes into it. If nobody owns the monthly data load, the template will go stale within two closes.
For everyone else, a one-time template is the cheaper and faster route. Many finance teams move to software later and keep the templates as their reporting layer.
Frequently asked questions
What templates does a financial controller need?
A financial controller needs templates for four jobs: a close calendar to plan deadlines, an audit checklist and findings tracker, a monthly KPI dashboard for reporting, and an interactive dashboard for presenting to leadership. The eight templates in this stack cover all four for about $90 in one-time payments.
Are financial controller Excel templates better than close management software?
For a single-entity company with a small finance team, Excel templates are cheaper and faster to adopt. Close management software wins when you need automated reconciliations, formal sign-offs, an audit trail for SOX, or multi-entity consolidation. Many teams start with templates and move to software when volume justifies it.
Which KPIs should a financial controller track each month?
The core monthly controller KPIs are days to close, budget variance percentage on major cost lines, reconciliation completion rate, audit findings closed on time and days sales outstanding. Strong teams aim to close in five business days or fewer and reconcile every balance-sheet account each month.
How do I calculate budget variance in Excel?
Budget variance percentage equals actual minus budget, divided by budget, multiplied by 100. In Excel that is =(B2-C2)/C2 where B2 is actual and C2 is budget, formatted as a percentage. The Financial Auditing KPI Dashboard in Excel calculates target versus actual variance automatically for every KPI.
Should a controller use Excel or Power BI for reporting?
Use Excel where the finance team updates and checks the numbers, and Power BI where leadership reads and filters them. Several templates in this stack come in both formats, and the Power BI editions refresh from an Excel source, so the same data feeds both.
Do these templates work with QuickBooks, Xero or SAP data?
Yes, as long as you can export a report to Excel or CSV. Paste or link the export into the template’s data sheet and the dashboards refresh. The templates do not connect to accounting systems directly, so someone on the team owns the monthly data load.
How much does the full financial controller template stack cost?
The eight templates cost $90.42 in total as one-time purchases, with no subscription or per-user fee. You can buy them one at a time, starting with the $14.99 Financial Auditing KPI Dashboard in Excel and the $4.99 Financial Year-End Close Calendar in Excel.
Can a year-end close calendar handle a non-calendar fiscal year?
Yes. The Financial Year-End Close Calendar in Excel lets you set the starting month and starting weekday, so a fiscal year that begins in April or July displays correctly across the annual, monthly and daily views.
Can several people work on the audit preparation checklist at once?
Yes. The Financial Audit Preparation Checklist is built in Google Sheets, so several team members can update tasks at the same time and progress charts refresh for everyone. You can also share a view-only link with your external auditors.
Get more financial controller templates
Start with the Financial Auditing KPI Dashboard in Excel ($14.99) and add the Financial Year-End Close Calendar in Excel ($4.99) before your next close. For the cash, budget and profit side of finance, the CFO’s Financial Command Toolkit bundles 10 Excel, Google Sheets and Power BI templates for $62.99, a 44% saving on buying them separately.
Browse more finance tools in our premium Power BI templates under $20, the Finance and Accounting Dashboard in Power BI, the Financial Audit Checklist in Excel and our list of 25 best-selling business templates. Teams managing vendors as well can use our supplier management Excel templates.
Watch the templates in action on the NextGenTemplates YouTube channel. Power BI Pro licence pricing is published on Microsoft’s Power BI pricing page.