

The best law firm dashboard template for most firms in 2026 is the Law Firm Performance Dashboard in Excel ($17.99): five pages track billing, collections, realization rate, attorney hours and practice-area revenue from one data sheet. The Google Sheets edition is the best value at $9.99, and six more ranked picks cover legal compliance and in-house operations.
Last updated: September 2026
Key takeaways
- Best overall law firm dashboard template: the Law Firm Performance Dashboard in Excel at $17.99, with Overview, Attorney Analysis, Practice Insights, Client Analysis and Financial Trend pages.
- Best value: the Law Firm Performance Dashboard in Google Sheets at $9.99, shareable with every partner in a browser.
- All eight templates are one-time purchases from $6.99 to $17.99; legal practice management software is billed per user, per month.
- Three picks serve private practice (billing and attorney performance) and five serve legal operations and compliance (deadlines, targets, departments).
- These templates report on your numbers; they do not do time entry, invoicing or trust accounting, which stay in your practice management system.
- Run a CPA or bookkeeping practice instead? See our accounting firm dashboard template roundup.
Law firm and legal operations templates compared
| Template | Format | Best For | Price |
|---|---|---|---|
| Law Firm Performance Dashboard | Excel | Best overall: billing, collections, attorneys and practice areas | $17.99 |
| Law Firm Performance Dashboard | Google Sheets | Best value: multi-office firms sharing one live file | $9.99 |
| Law Firm Performance Dashboard | Power BI | Larger firms with thousands of matters | $17.99 |
| Legal and Compliance Operations KPI Dashboard | Excel | Monthly legal ops KPIs vs target and last year | $14.99 |
| Legal Compliance Dashboard | Power BI | On-time vs delayed obligations by department | $17.99 |
| Legal and Compliance Resource Allocation KPI Dashboard | Excel | Staffing and workload KPIs for legal teams | $14.99 |
| Legal Compliance KPI Dashboard | Google Sheets | Audits, filings and incidents vs target, shared | $9.99 |
| Legal Compliance Dashboard | Google Sheets | Lowest-cost compliance tracker with a compliance score | $6.99 |
How we picked these legal templates
We searched the full NextGenTemplates catalogue of Excel, Google Sheets, Power BI and HTML products for law firm, legal, compliance, attorney and case-related tools, then kept the eight that a managing partner, practice manager, general counsel or compliance lead would open every month. Each pick had to run from a real data sheet, show genuine legal measures such as realization rate, billable hours or on-time compliance, and be editable without a consultant.
We left out the narrow specialist dashboards (intellectual property, environmental law, arbitration and M&A legal teams) from the ranking because they suit one practice area, and we list them in the decision section instead. Prices are the current one-time list prices on each product page. For KPI benchmarks we lean on Clio’s annual Legal Trends Report, the most widely cited public dataset on law firm utilization, realization and collection.
Why law firms need a dashboard in the first place
Most small and mid-sized firms already have the data. Hours sit in the time-tracking tool, invoices in the billing module, payments in the accounting system and case outcomes in a matter list. What they lack is one page that joins them. So the monthly partner meeting starts with someone pasting exports into a spreadsheet, and the question that matters most, “how much of the work we did actually turned into cash?”, still takes a day to answer.
That gap is expensive. Lawyers bill in six-minute increments, so small leaks add up: unbilled hours, write-downs at invoicing and invoices that sit unpaid past 90 days. Clio’s research has for years put average lawyer utilization at well under half of an eight-hour day, which means the firm’s biggest lever is usually not more work but better capture, billing and collection of the work already done.
Practice management platforms such as Clio, MyCase, PracticePanther and Smokeball do include reports, but they are subscriptions priced per user per month, commonly from around $40 to $150 or more on published list prices, and their built-in reports rarely match the exact view a managing partner wants. A law firm dashboard template sits on top of your exports. It does not replace the system; it turns the numbers into a board-ready view for a one-time $6.99 to $17.99.
The 8 best law firm and legal operations templates for 2026
1. Law Firm Performance Dashboard in Excel: best overall
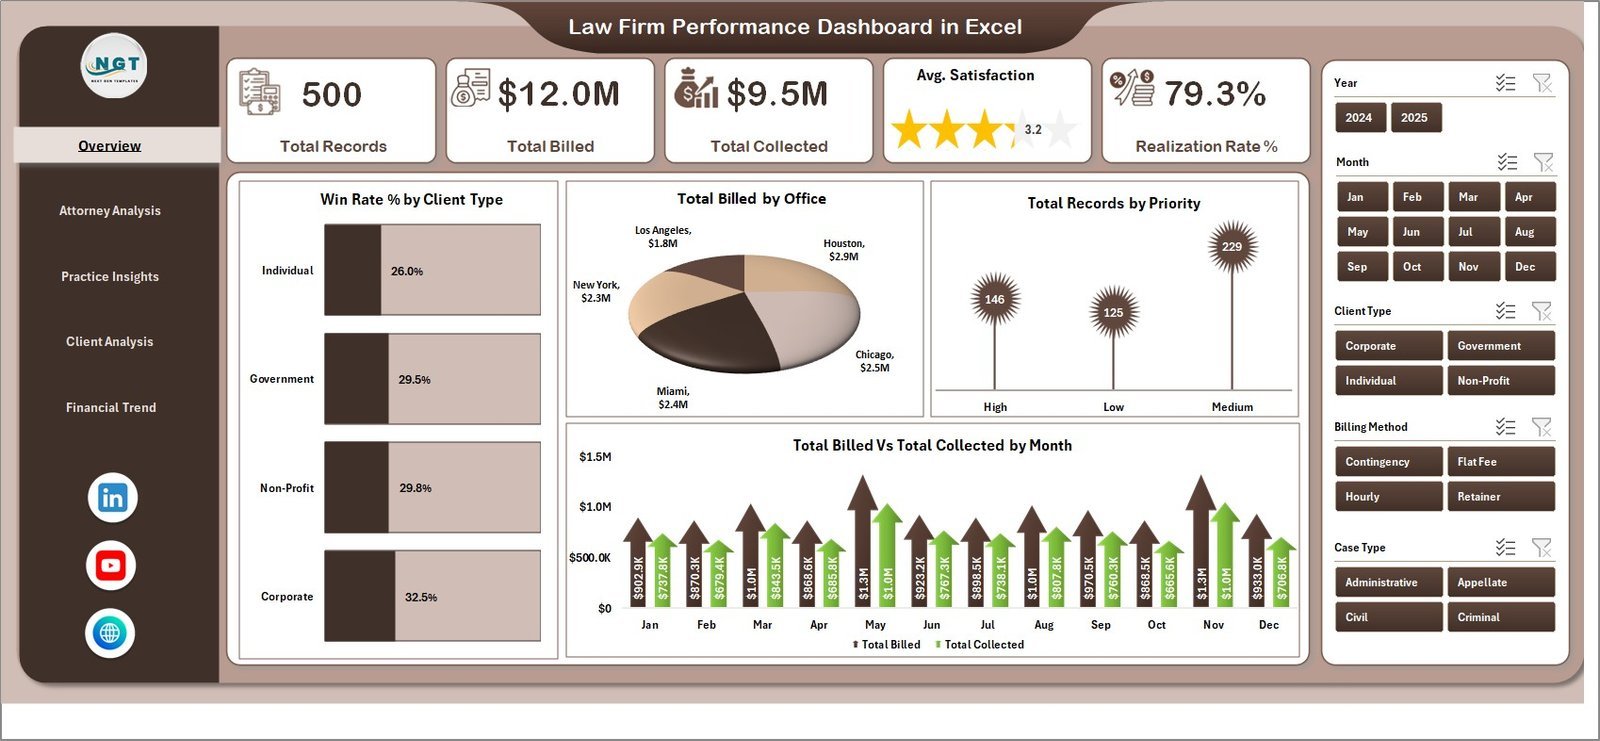
This is the most complete law firm dashboard template in the roundup and the reason it ranks first is simple: it is the only pick that connects attorneys, practice areas, clients and cash in one Excel file. Five interactive pages run on pivot tables and slicers, so every chart refreshes when you update the Data sheet. There are no macros.
Who it is for: managing partners, practice managers and firm administrators at boutique and mid-sized firms who already report in Microsoft Excel.
- Overview with five KPI cards: Total Records, Total Billed, Total Collected, Avg. Satisfaction and Realization Rate %.
- Attorney Analysis: billable hours, cases won, satisfaction and billed vs collected for the top five attorneys.
- Practice Insights: records by billing method, billed by case type, case value and billed amount by practice area.
- Client Analysis and Financial Trend: billed vs collected by client type, expenses by month and billed by partner group.
Concrete uses: the sample data shows $12.0M billed and $9.5M collected, a 79.3% realization rate, which is exactly the gap a partner meeting should discuss; compare hourly, flat-fee and contingency matters to see which billing method converts best to cash; and spot the attorney with high hours but low collections before year-end reviews. Price: $17.99. Get the Law Firm Performance Dashboard in Excel →
Best for: the firm that wants one complete Excel view of billing, collections and attorney performance.
2. Law Firm Performance Dashboard in Google Sheets: best value
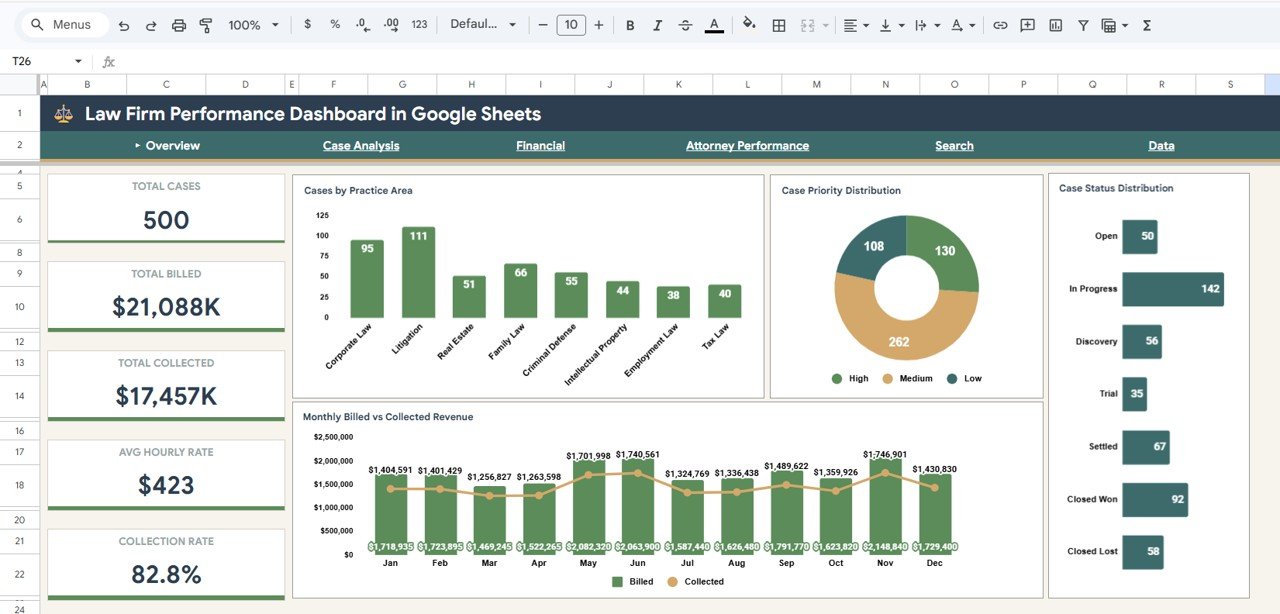
At $9.99 this is the best value in the list. It is a separate build, not a copy of the Excel file: six tabs (Overview, Case Analysis, Financial, Attorney Performance, Search and Data) run in Google Sheets, so partners in different offices open the same live file from any browser.
Who it is for: small firms, solo practitioners growing into a team and multi-office practices already on Google Workspace.
- KPI cards for Total Cases, Total Billed, Total Collected, Avg Hourly Rate and Collection Rate.
- Case Analysis: cases by month, open vs closed-won vs closed-lost by practice area, and case type distribution.
- Financial page: revenue vs expenses by practice area, monthly trend and an hours-billed vs revenue correlation chart.
- Attorney revenue ranking plus a Search tab to pull up any matter record.
Concrete uses: see whether the employment practice closes more matters won than lost; check whether average hourly rate is slipping as juniors take on more work; and send partners a view-only link instead of a monthly PDF. Price: $9.99. Get the Law Firm Performance Dashboard in Google Sheets →
Best for: firms that need shared, browser-based access at the lowest price.
3. Law Firm Performance Dashboard in Power BI
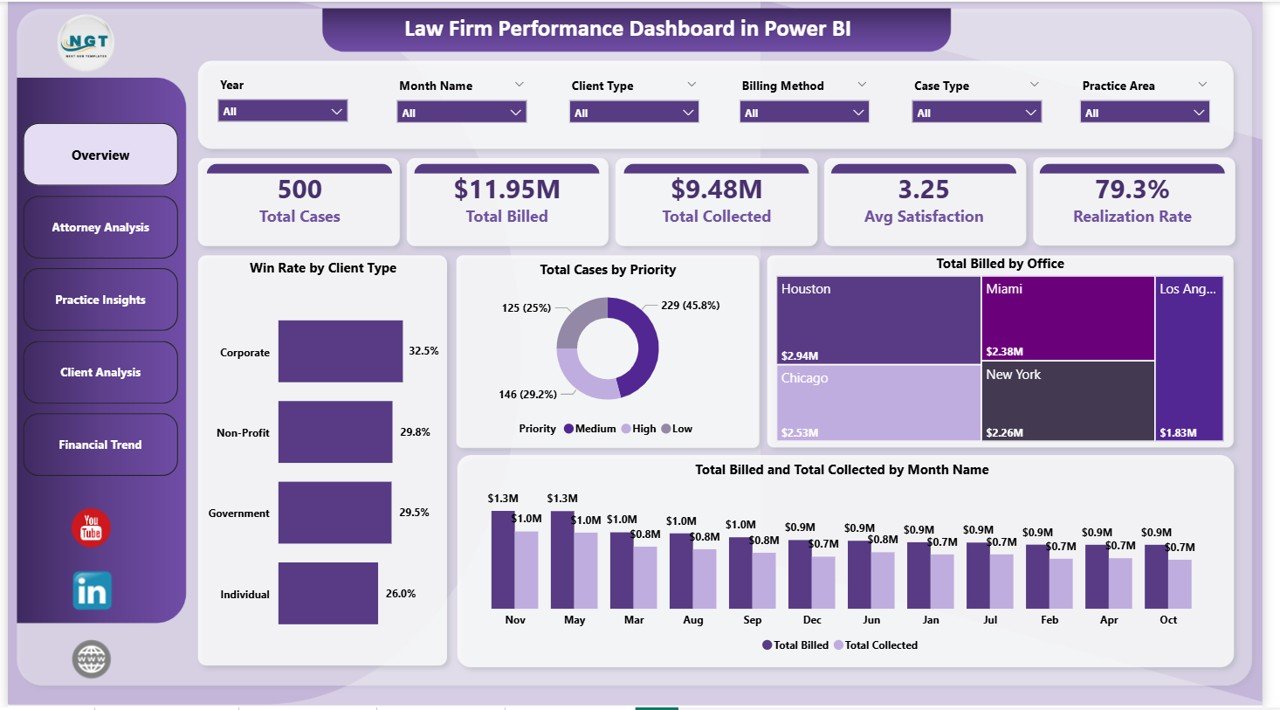
The five-page structure of the Excel edition (Overview, Attorney Analysis, Practice Insights, Client Analysis and Financial Trend) rebuilt as a Power BI report. When matter history runs to thousands of rows, or several offices feed one report, Power BI handles the volume and lets partners drill from firm level to one attorney in a click.
Who it is for: mid-sized and larger firms, and corporate legal departments with an analyst or IT support.
- KPI cards for Total Cases, Total Billed, Total Collected, Avg Satisfaction and Realization Rate.
- Win rate by client type, cases by priority and billed by office on the Overview.
- Slicers for office, client type, priority and period on every page.
- Connect your own data source and refresh instead of pasting exports each month.
Concrete uses: compare realization by office before deciding where to hire; filter to corporate clients to see whether they pay faster than individuals; and run the management committee meeting from one live screen. Price: $17.99. See the Law Firm Performance Dashboard in Power BI →
Best for: firms whose data has outgrown a spreadsheet.
Not sure where to start? Most firms start with the Law Firm Performance Dashboard in Excel ($17.99). If your partners work in Google Workspace, the Google Sheets edition ($9.99) is the cheapest way to put one billing and collections view in front of everyone.
4. Legal and Compliance Operations KPI Dashboard in Excel
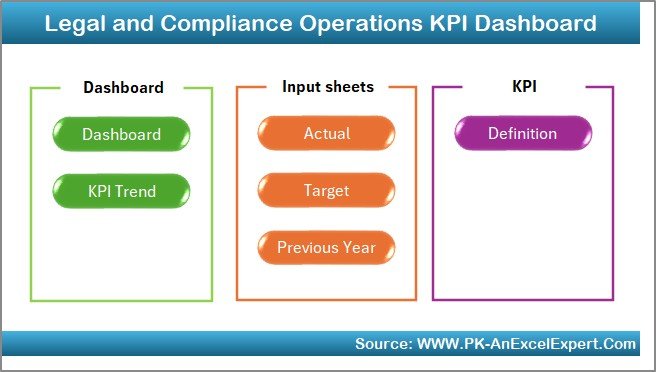
A different style of template: a KPI scorecard rather than a transaction dashboard. You enter one monthly number per KPI, set targets and load last year’s figures, and the dashboard shows month-to-date and year-to-date performance with red and green arrows.
Who it is for: heads of legal operations, compliance officers and general counsel who report a fixed set of KPIs to leadership every month.
- Seven sheets: Home, Dashboard, KPI Trend, Actual Numbers Input, Target, Previous Year Numbers and KPI Definition.
- Drop-down month selector that updates MTD and YTD actual, target and previous-year values.
- A KPI dictionary with group, unit, formula and definition for each measure.
- Add or remove KPIs to match your own legal operations scorecard.
Concrete uses: report contract turnaround time, outside counsel spend and audit findings against target each month; show the board year-on-year improvement; and give a new team member the KPI Definition sheet instead of a briefing. Price: $14.99. Get the Legal and Compliance Operations KPI Dashboard →
Best for: in-house teams that need MTD/YTD targets and previous-year comparison.
5. Legal Compliance Dashboard in Power BI
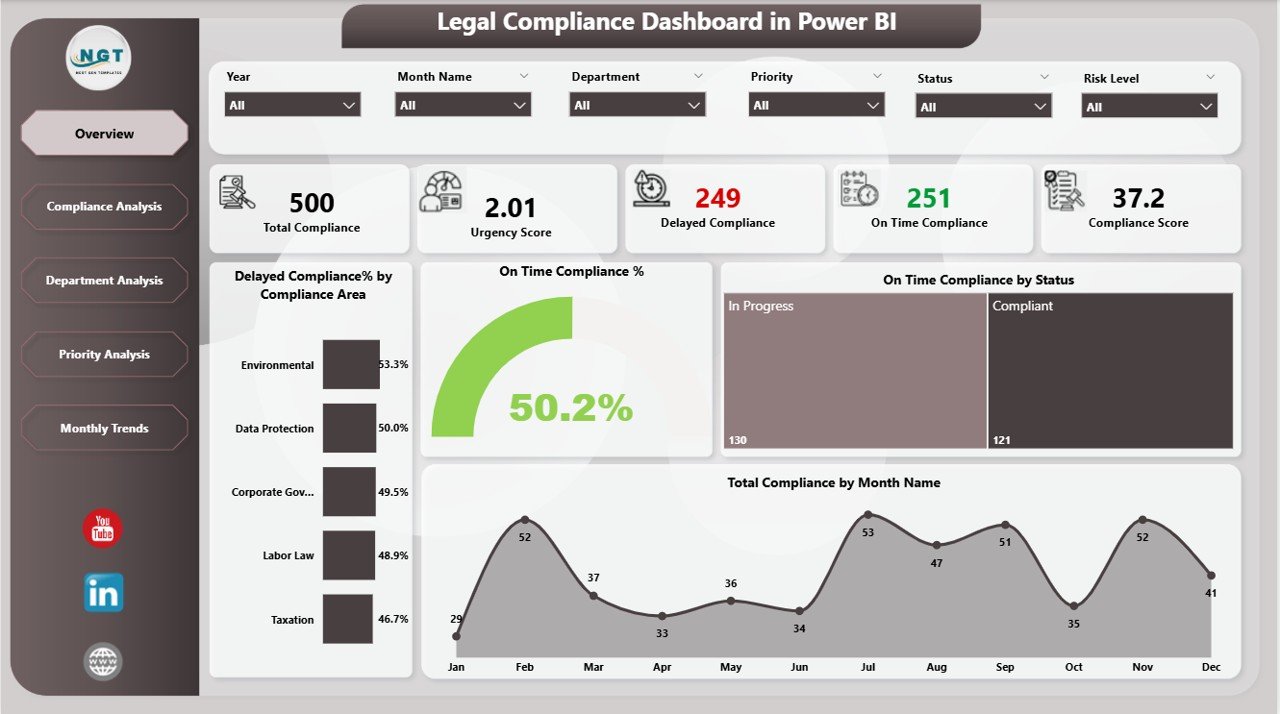
A five-page Power BI report built around compliance obligations: how many there are, how many were met on time, how many were delayed, and where the delays cluster. It is the strongest pick here for a compliance function that tracks deadlines across departments.
Who it is for: compliance officers, risk managers and in-house legal teams at mid-sized and larger organisations.
- Pages: Overview, Compliance Analysis, Department Analysis, Priority Analysis and Monthly Trends.
- Six slicers for compliance area, department, priority, month and more.
- Metrics for total compliance count, on-time %, delayed % and compliance score.
- Priority analysis that shows whether high-priority obligations are closed on time.
Concrete uses: identify the department that misses the most filing deadlines; prove to the audit committee that high-priority items are closed on time; and track whether a new process cut delays quarter on quarter. Price: $17.99. See the Legal Compliance Dashboard in Power BI →
Best for: deadline-driven compliance tracking across many departments.
6. Legal and Compliance Resource Allocation KPI Dashboard in Excel
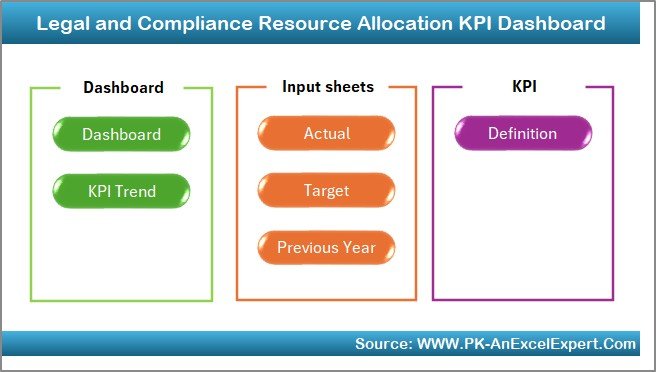
The same scorecard engine as pick 4, focused on how legal and compliance people and budget are spread across the work. It helps answer the perennial legal ops question: are we staffed for the workload we actually have?
Who it is for: legal operations managers and practice group leaders planning headcount, outside counsel use and budgets.
- Home sheet with six navigation buttons to every section.
- Dashboard with MTD and YTD actual, target and previous-year values for the selected month.
- KPI Trend sheet showing KPI type (upper-the-better or lower-the-better), formula and definition.
- Target and previous-year sheets for realistic benchmarks.
Concrete uses: track matters per lawyer against a target load; watch outside counsel spend share fall as you build internal capacity; and back a hiring request with twelve months of trend data. Price: $14.99. Get the Resource Allocation KPI Dashboard →
Best for: legal teams making staffing and budget decisions.
7. Legal Compliance KPI Dashboard in Google Sheets

A Google Sheets version of the KPI scorecard approach, geared to legal risk: audits, regulatory filings, violations and incidents. Because it lives in Google Sheets, compliance leads in different locations can update the same file.
Who it is for: compliance and legal teams in Google Workspace that report KPIs monthly.
- Dashboard with a month selector, MTD and YTD values, targets and previous-year figures.
- KPI Trend tab with a KPI drop-down, group, unit, type, formula and definition.
- Actual, Target and Previous Year input tabs that feed every view automatically.
- Conditional up and down arrows for instant status checks.
Concrete uses: track filings submitted on time against a 100% target; compare this year’s audit findings with last year’s; and share one KPI file with regional compliance leads. Price: $9.99. Get the Legal Compliance KPI Dashboard in Google Sheets →
Best for: shared compliance KPI reporting on a small budget.
8. Legal Compliance Dashboard in Google Sheets
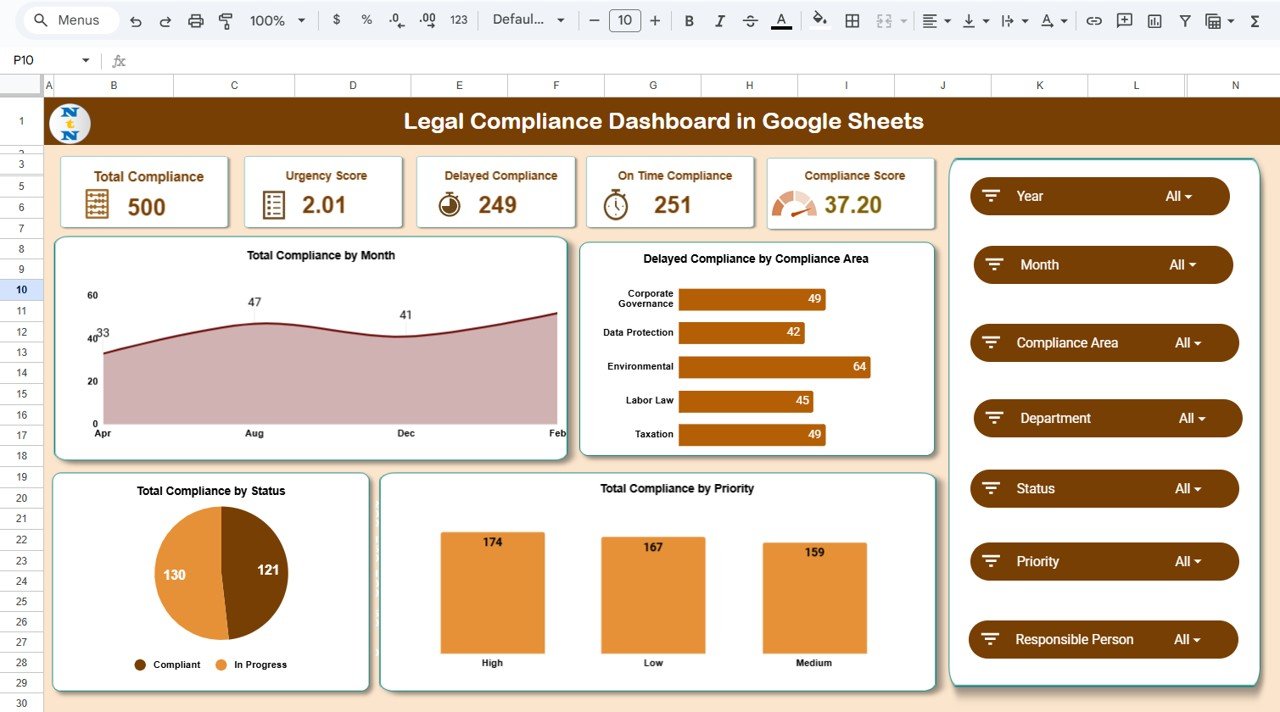
The lowest-priced pick in the guide and a transaction-level tracker rather than a scorecard. Each compliance task is a row, and the dashboard calculates an urgency score, delayed and on-time counts, and an overall compliance score.
Who it is for: small businesses, HR and operations managers and small legal teams that need a first compliance tracker.
- KPI cards: Total Compliance, Urgency Score, Delayed Compliance, On-Time Compliance and Compliance Score.
- Charts for compliance by month, delayed compliance by area, compliance by priority and status distribution.
- Compliance Analysis tab broken down by regulatory area such as HR, finance, safety and tax.
- Runs in any browser with no installation.
Concrete uses: list every licence renewal and statutory filing for the year and watch the urgency score as deadlines approach; show which area causes most delays; and replace an email chain of reminders with one shared sheet. Price: $6.99. Get the Legal Compliance Dashboard in Google Sheets →
Best for: the smallest budget and the simplest compliance setup.
The law firm KPIs every dashboard should show
Whichever law firm dashboard template you pick, make sure the monthly report answers these questions. The formulas work in any spreadsheet once your data is in one sheet.
| KPI | Formula | What to watch for |
|---|---|---|
| Utilization rate | Billable hours divided by available working hours | Industry averages are commonly well under 50% of an 8-hour day; track the trend, not one month |
| Billing realization | Billed value divided by standard value of hours worked | Falling figures mean write-downs at invoicing |
| Collection rate (collection realization) | Amount collected divided by amount billed | Commonly targeted at 90% or above |
| Average hourly rate | Fee revenue divided by hours billed | Slipping rates can signal discounting or junior-heavy staffing |
| Revenue per lawyer | Collected fee revenue divided by fee earners | Compare by practice area, not only firm-wide |
| Win rate | Matters won divided by matters closed | Read alongside case type and client type |
| Lockup (WIP + debtor days) | Days of unbilled work plus days of unpaid invoices | Rising lockup ties up cash even when billing looks healthy |
The Excel and Power BI Law Firm Performance Dashboards show realization as collected divided by billed, which is the collection realization line above. If you also want billing realization, add a standard-value column to your data and a second card. For client funds, remember that trust accounting has its own professional rules, such as ABA Model Rule 1.15 on safekeeping property, and belongs in your accounting system, not a dashboard.
How to choose the right law firm dashboard template
Match the template to two things: whether you run a firm or a legal function, and the software your team already uses.
- Private practice, Excel users: the Law Firm Performance Dashboard in Excel ($17.99).
- Private practice, partners in several offices: the Google Sheets edition ($9.99).
- Thousands of matters or a management committee: the Power BI edition ($17.99).
- No Office licence at all: the Law Firm Performance Dashboard in HTML ($12.99) runs in any browser.
- In-house legal ops reporting KPIs to leadership: the Operations KPI Dashboard ($14.99) or the Resource Allocation KPI Dashboard ($14.99).
- Compliance deadlines across departments: the Legal Compliance Dashboard in Power BI ($17.99), or the Google Sheets tracker ($6.99) for small teams.
Specialist practice? We also build the Intellectual Property Law Firms Dashboard, the Environmental Law Firms Dashboard, the Legal Research Dashboard and the Mergers and Acquisitions Legal Teams Dashboard, each $17.99 in Excel with Power BI versions available. For the people side of a firm, our 15 HR KPIs to track and payroll KPIs guide pair well with any pick here, and the cash flow KPIs guide helps when collections are the problem.
When a law firm template is NOT the right answer
A dashboard is a reporting layer, not a system of record. Be honest about where a law firm dashboard template stops:
- You need time entry, invoicing and online payments. That is practice management software territory: Clio, MyCase, PracticePanther, Smokeball or similar. Export from them into a dashboard; do not try to bill from a spreadsheet.
- You hold client money in trust. Trust (IOLTA) accounting has strict three-way reconciliation and record-keeping rules. Use dedicated legal accounting software.
- You need document management, conflict checks or a client portal. None of these templates store documents or run conflict searches.
- Many staff enter data at once with permissions and an audit trail. Google Sheets handles light collaboration, but high-volume multi-user entry needs a database-backed system.
- You would store privileged content. Keep privileged material in secured systems and use the templates only for aggregated numbers and matter codes.
If none of those apply, and for reporting they usually do not, a template is the faster, cheaper and more flexible choice, and it keeps working if you change practice management software later.
Frequently asked questions
What is a law firm dashboard template?
A law firm dashboard template is a ready-made Excel, Google Sheets or Power BI file that turns your matter, billing and time records into KPI cards and charts. You paste your data into the Data sheet, refresh, and see total billed, total collected, realization rate, attorney hours and practice-area revenue without building reports by hand.
Which law firm KPIs should a dashboard track?
Start with billable hours, utilization rate, realization rate, collection rate, revenue by practice area, revenue per attorney, case win rate and client satisfaction. Add accounts receivable ageing if collections are slow. The Law Firm Performance Dashboard templates in this guide cover most of these out of the box.
Is a law firm dashboard template a replacement for Clio or MyCase?
No. Practice management software handles time entry, invoicing, trust accounting, documents and client portals. A dashboard template is a reporting layer that sits on top of an export from those systems or from your own spreadsheets, and it costs a one-time $6.99 to $17.99 instead of a per-user monthly subscription.
How is realization rate calculated in these templates?
In the Law Firm Performance Dashboard, the Realization Rate card divides total collected by total billed. The sample data shows $9.5M collected against $12.0M billed, a 79.3% rate. Many firms also track billing realization, which compares billed value with the standard value of hours worked.
Excel, Google Sheets or Power BI: which is best for a law firm?
Choose Excel when one practice manager or partner owns the monthly report, Google Sheets when partners in different offices need the same live file, and Power BI when matter data runs into thousands of rows or you present to a management committee on screen. The HTML edition suits teams with no Office licence.
Do these templates store confidential client information?
They store whatever you put in the Data sheet. For confidentiality, use matter numbers or client codes instead of names, keep files in your firm's secured storage, and share Google Sheets versions only with named colleagues. The dashboards need aggregated numbers, not privileged content.
Can an in-house legal department use these templates?
Yes. In-house teams usually get more from the compliance dashboards, which track on-time versus delayed obligations by department and priority, and from the KPI dashboards with monthly targets and previous-year comparisons. The Law Firm Performance Dashboard also works for legal departments that charge internal clients.
Do I need macros or coding skills?
No. The Law Firm Performance Dashboard in Excel is built on pivot tables and slicers, the KPI dashboards use formulas and drop-down month selectors, and the Google Sheets and Power BI editions need no Excel macros. You replace the sample rows with your own data in the same columns.
Do I need a Power BI Pro licence?
No. Both Power BI templates open in the free Power BI Desktop application. You need a paid Power BI licence only if you want to publish the report to the Power BI service and share it online with partners who do not have the file.
How long does setup take?
Most firms are running in an afternoon. Export matters, hours, billed and collected amounts from your practice management system, paste them into the Data sheet using the same column headings, refresh, then check the Total Billed card against a figure you trust from your accounting system.
Get more law firm and legal templates
Ready to see billing, collections and attorney performance on one page? Start with our best overall law firm dashboard template, the Law Firm Performance Dashboard in Excel ($17.99), or the best-value Google Sheets edition ($9.99). Every option above is a one-time purchase between $6.99 and $17.99, with no subscription and no per-user fee.
Compare formats more widely with our Power BI dashboard templates ranked by industry, the premium Power BI templates under $20, the shareable Google Sheets templates for teams and the 25 best-selling business templates. Subscribe to the NextGenTemplates YouTube channel for setup tutorials.