

The 10 maintenance KPIs worth tracking in 2026 are MTBF, MTTR, MTTF, OEE, planned maintenance percentage, preventive maintenance compliance, the PM/CM ratio, maintenance backlog, maintenance cost as a percentage of replacement asset value, and asset availability. Together they show whether your assets are reliable, your team is proactive, and your maintenance spend is under control.
Last updated: September 2026
Key takeaways
- MTBF and MTTR are the two anchor maintenance KPIs — MTBF measures reliability (time between failures), MTTR measures recovery speed (time to repair). Availability is built from both.
- World-class planned maintenance percentage is 85% or higher — the classic 85/15 split between planned and reactive work separates proactive teams from firefighters.
- OEE of 85% is world-class; 60% is typical. It multiplies Availability × Performance × Quality into one number leadership can act on.
- Every metric here has an exact formula and a benchmark range so you can score your own site today, no consultant required.
- The Preventive Maintenance Dashboard in Excel ($17.99) already calculates most of these KPIs — one of 8 ready-made templates mapped to the metrics below.
Maintenance KPI templates compared
| Template | Format | Best for | Price |
|---|---|---|---|
| Preventive Maintenance Dashboard in Excel | Excel | Best overall — full PM compliance, cost and completion KPIs | $17.99 |
| Preventive Maintenance Dashboard in Power BI | Power BI | Multi-site teams that need refreshable, drillable KPIs | $17.99 |
| Medical Equipment Manufacturing KPI Dashboard in Power BI | Power BI | Manufacturing lines tracking OEE and output quality | $11.99 |
| Preventive Maintenance Dashboard in Google Sheets | Google Sheets | Best value — cloud PM dashboard, no software cost | $6.99 |
| Equipment Maintenance Log Tracker in Google Sheets | Google Sheets | Capturing the raw failure and repair data MTBF/MTTR need | $6.99 |
| Equipment Maintenance Schedule in Excel | Excel | Building and issuing the PM schedule that drives compliance | $4.99 |
| Office Equipment Maintenance Checklist in Excel | Excel | Small offices standardising routine equipment checks | $3.49 |
| IT Equipment Maintenance Checklist in Excel | Excel | IT teams keeping servers, UPS and network gear serviced | $3.49 |
How we picked these maintenance KPIs
We searched the full NextGenTemplates catalogue of maintenance and reliability templates and cross-checked the metrics against the standard reliability definitions used by maintenance and reliability professionals, including the accepted MTBF and MTTR definitions. We prioritised KPIs that (a) have an unambiguous formula, (b) carry a published benchmark range, and (c) are actually computed by a template a small team can run without a CMMS. We excluded vanity counts such as “number of work orders closed” that move without telling you whether reliability improved.
The 10 best maintenance KPIs to track in 2026
1. Mean Time Between Failures (MTBF) — the anchor reliability metric
Definition: the average operating time a repairable asset runs between one failure and the next.
Formula: MTBF = Total operating time ÷ Number of failures.
Benchmark: highly asset-dependent, but the direction matters more than the absolute — world-class programmes push MTBF for critical rotating equipment past 1,000 operating hours and trend it upward year over year.
Common mistake: including planned downtime in “operating time,” or counting minor stoppages and resets as failures. Both distort MTBF and hide the real reliability trend. Count only unplanned functional failures of repairable assets.
2. Mean Time To Repair (MTTR) — how fast you recover
Definition: the average time taken to restore a failed asset to working order, from failure to running again.
Formula: MTTR = Total repair time ÷ Number of repairs.
Benchmark: lower is better; many lean maintenance teams target under 4–5 hours for critical assets, though the right target depends on asset criticality and spare availability.
Common mistake: measuring only “wrench time” and excluding diagnosis, waiting for parts and waiting for a technician. That understates MTTR and hides the biggest delays — which are usually logistics, not the repair itself.
3. Overall Equipment Effectiveness (OEE) — the single production score
Definition: one figure for how fully a machine is used, combining how often it is available, how fast it runs, and how much good output it makes.
Formula: OEE = Availability × Performance × Quality.
Benchmark: 85% is world-class, 60% is typical for discrete manufacturing, and anything around 40% signals a major improvement opportunity.
Common mistake: gaming the availability factor by reclassifying unplanned stops as “planned,” which inflates OEE while the floor keeps losing hours. Define your six big losses once and hold the categories still.
4. Planned Maintenance Percentage (PMP) — proactive vs reactive
Definition: the share of total maintenance labour hours that were planned and scheduled rather than reactive.
Formula: PMP = (Planned maintenance hours ÷ Total maintenance hours) × 100.
Benchmark: world-class sites hit 85% or higher (the “85/15 rule”); below 70% points to a reactive, firefighting culture.
Common mistake: logging a rushed same-day breakdown job as “planned” because it eventually got a work order. If the work wasn’t scheduled before the shift, it’s reactive — count it honestly or the KPI is meaningless.
5. Preventive Maintenance Compliance (PMC) — do PMs actually happen on time
Definition: the share of scheduled preventive maintenance work orders completed on time within the period.
Formula: PMC = (PM completed on time ÷ PM scheduled) × 100.
Benchmark: 90% or higher is world-class, measured within a defined compliance window (often a 10% grace period around the due date).
Common mistake: marking a PM “complete” even when it slipped weeks past its due window. Schedule compliance must be measured against the window, not just “done eventually,” or you are rewarding late work.
6. Mean Time To Failure (MTTF) — for parts you replace, not repair
Definition: the average operating life of a non-repairable asset or component before it fails and is replaced.
Formula: MTTF = Total operating time ÷ Number of units that failed.
Benchmark: compare against the manufacturer’s rated life; a fleet MTTF well under rated life points to a specification, installation or operating problem.
Common mistake: confusing MTTF with MTBF. MTTF is for consumable, non-repairable items (bearings, bulbs, filters); MTBF is for repairable assets. Mixing them produces numbers nobody can act on.
7. Maintenance Backlog — the hidden workload
Definition: the total estimated labour hours of approved work orders that are ready but not yet completed, expressed in crew-weeks.
Formula: Backlog (crew-weeks) = Outstanding work-order hours ÷ Weekly crew capacity hours.
Benchmark: a healthy backlog is roughly 2–4 crew-weeks; above 6 signals under-resourcing, while under 2 can mean you are overstaffed or not planning far enough ahead.
Common mistake: tracking backlog as a raw count of open work orders instead of hours. Ten five-minute jobs and ten eight-hour overhauls are not the same load — measure the hours.
8. PM/CM Ratio — preventive versus corrective work
Definition: the ratio of preventive maintenance work to corrective (reactive) maintenance work.
Formula: PM/CM = Preventive work hours : Corrective work hours (world-class target ≈ 80:20).
Benchmark: 80/20 is world-class, 70/30 is acceptable, and below 60/40 confirms a reactive operation.
Common mistake: counting the number of work orders rather than the hours behind them. A handful of large reactive repairs can consume more labour than dozens of small PMs, so a “good” count can hide a bad ratio.
9. Maintenance Cost as % of Replacement Asset Value (%RAV)
Definition: annual maintenance spend as a percentage of the replacement value of the assets being maintained.
Formula: %RAV = (Annual maintenance cost ÷ Replacement asset value) × 100.
Benchmark: 2–3% is world-class for most industries; consistently above 5% points to aging assets, over-maintenance or poor reliability.
Common mistake: leaving contractor labour, capital spares and stores holding costs out of the numerator. A number that only counts in-house wrench time looks great and means nothing.
10. Asset Availability (Uptime) — the bottom line
Definition: the share of scheduled production time an asset was actually available to run.
Formula: Availability = (Uptime ÷ (Uptime + Downtime)) × 100, or equivalently MTBF ÷ (MTBF + MTTR).
Benchmark: 90% is good and 95%+ is world-class for critical assets, though the right target depends on how tightly the asset is loaded.
Common mistake: reporting calendar availability (24/7 denominator) instead of availability against scheduled demand. Idle time when nothing was scheduled should not flatter your uptime number.
Maintenance KPI formulas and benchmarks at a glance
| Metric | Formula | Benchmark | Where to see it |
|---|---|---|---|
| MTBF | Operating time ÷ failures | Trend up; 1,000+ hrs critical assets | Equipment Maintenance Log Tracker |
| MTTR | Repair time ÷ repairs | < 4–5 hrs critical assets | Equipment Maintenance Log Tracker |
| OEE | Availability × Performance × Quality | 85% world-class; 60% typical | Medical Equipment Manufacturing KPI Dashboard |
| Planned Maintenance % | Planned hrs ÷ total hrs × 100 | ≥ 85% (85/15 rule) | Preventive Maintenance Dashboard |
| PM Compliance | PM on time ÷ PM scheduled × 100 | ≥ 90% | Preventive Maintenance Dashboard |
| MTTF | Operating time ÷ units failed | vs manufacturer rated life | Equipment Maintenance Log Tracker |
| Maintenance Backlog | Outstanding hrs ÷ weekly crew hrs | 2–4 crew-weeks | Equipment Maintenance Schedule |
| PM/CM Ratio | Preventive hrs : corrective hrs | 80:20 world-class | Preventive Maintenance Dashboard |
| % of RAV | Annual cost ÷ replacement value × 100 | 2–3% world-class | Preventive Maintenance Dashboard |
| Availability | Uptime ÷ (uptime + downtime) × 100 | 90% good; 95%+ world-class | Preventive Maintenance / Manufacturing KPI Dashboard |
8 ready-made dashboards that already calculate these KPIs
You don’t need to build the formulas from scratch. Each template below arrives pre-wired with the calculations, sample data and charts for the metrics above — buy, drop in your work orders, and the KPIs update themselves.
1. Preventive Maintenance Dashboard in Excel — $17.99 (best overall)
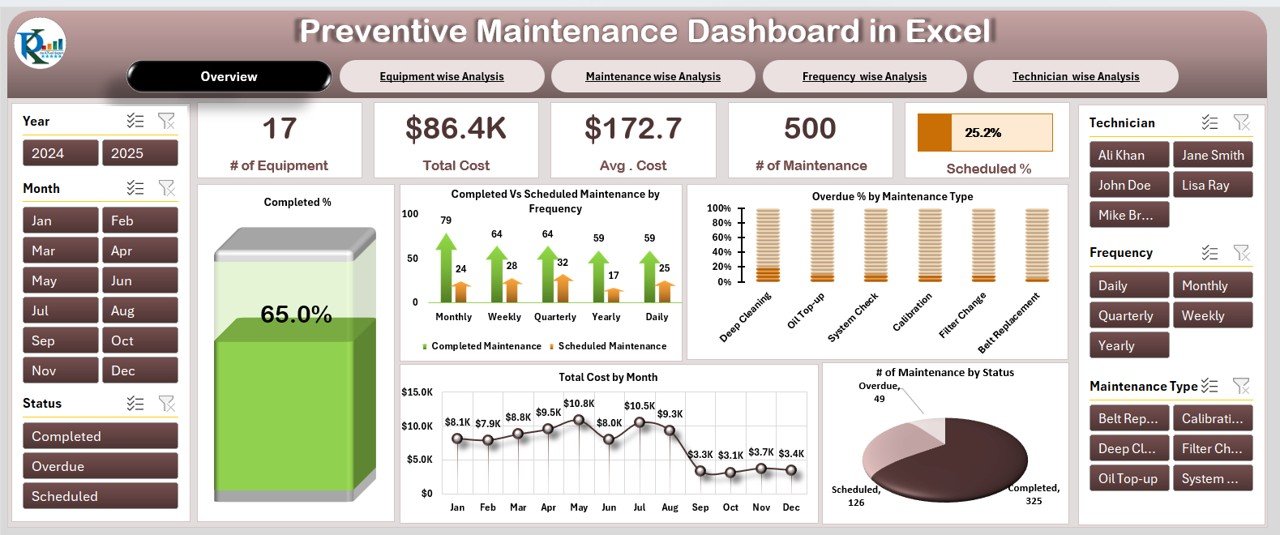
What it is: a complete Excel maintenance command centre with equipment count, total cost, completed-vs-scheduled frequency and a cost trend line.
Who it is for: maintenance planners who live in Excel and want PM compliance, planned-maintenance percentage and cost KPIs without a CMMS subscription.
- Tracks completed vs scheduled maintenance and completion percentage
- Total maintenance cost with a rolling monthly trend
- Equipment-wise analysis view to find your worst offenders
- Pre-built slicers so leadership can filter by asset or period
Use it to hold a monthly review: track PM compliance toward the 90% benchmark, watch the PM/CM ratio move toward 80:20, and catch cost creep before it hits the budget. Best for: the single template most teams should start with. Buy the Excel dashboard — $17.99
2. Preventive Maintenance Dashboard in Power BI — $17.99
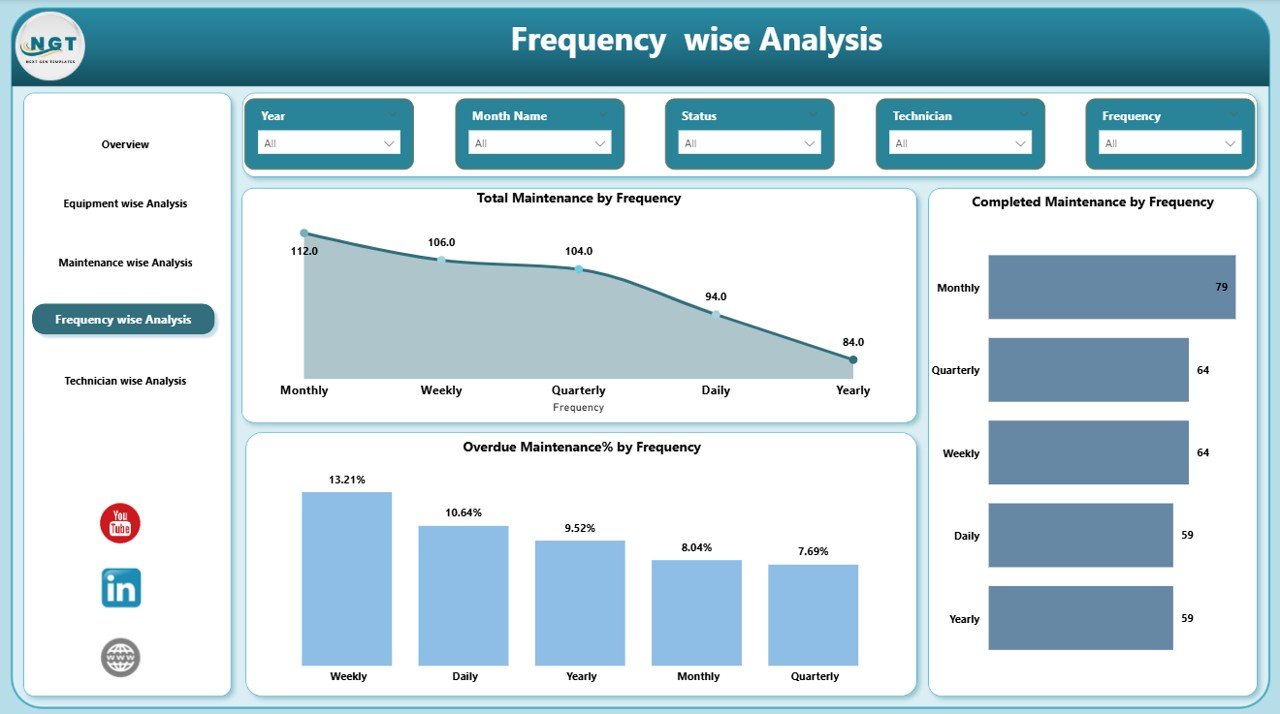
What it is: the same preventive-maintenance model rebuilt in Power BI, with refreshable data and cross-filtering.
Who it is for: multi-site or multi-line teams that need one refreshable report leadership can slice by plant, asset class or month.
- One-click data refresh from your maintenance log
- Drillable equipment-wise and period-wise KPI pages
- Shareable online without emailing spreadsheets around
Best for: teams that outgrew a single workbook. Buy the Power BI dashboard — $17.99
3. Medical Equipment Manufacturing KPI Dashboard in Power BI — $11.99
What it is: a manufacturing-focused KPI dashboard that folds OEE, output quality and equipment performance into one report.
Who it is for: production and maintenance managers on a line who need OEE and availability side by side.
- OEE broken into availability, performance and quality
- Output and defect tracking to close the quality loop
- Period comparisons to prove reliability gains over time
Best for: anyone whose KPI list is led by OEE. Buy the Manufacturing KPI dashboard — $11.99
4. Preventive Maintenance Dashboard in Google Sheets — $6.99 (best value)
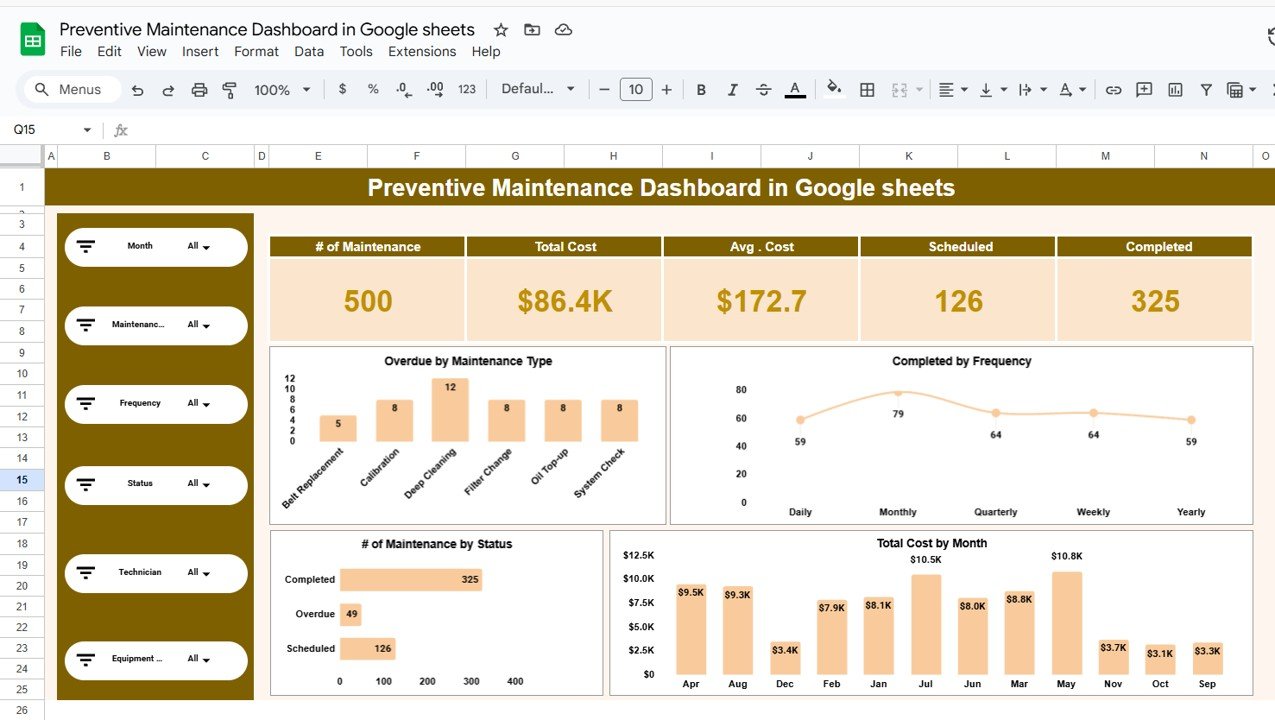
What it is: a cloud-native preventive-maintenance dashboard that runs entirely in Google Sheets — no license, no install.
Who it is for: small teams and startups that want the PM compliance and cost KPIs for the price of a coffee.
- Live in the browser and shareable by link
- Completed-vs-scheduled and cost KPIs out of the box
- Free to run on any Google account
Best for: the highest value-for-money on this list. Buy the Google Sheets dashboard — $6.99
5. Equipment Maintenance Log Tracker in Google Sheets — $6.99
What it is: the data-capture layer — a structured log of failures, repairs and downtime that feeds MTBF, MTTR and MTTF.
Who it is for: any team that has KPIs in mind but no clean source data yet.
- Timestamped failure and repair entries per asset
- Downtime capture so availability is calculable
- The raw feed every reliability KPI on this page depends on
Best for: fixing the “we don’t have the data” problem first. Buy the log tracker — $6.99
6. Equipment Maintenance Schedule in Excel — $4.99
What it is: a planning template that builds and issues the PM schedule which drives compliance and backlog.
Who it is for: planners who need to schedule PMs before they can measure whether they happened on time.
- Frequency-based PM scheduling per asset
- Upcoming-due view that keeps backlog visible
- The input side of the PM compliance KPI
Best for: teams standing up a PM programme. Buy the maintenance schedule — $4.99
7. Office Equipment Maintenance Checklist in Excel — $3.49
What it is: a standardised checklist for routine office-equipment servicing.
Who it is for: office and facilities managers who want consistent checks without a full dashboard.
- Repeatable task lists per equipment type
- Sign-off columns for accountability
- A low-cost entry point to a maintenance routine
Best for: small offices. Buy the office checklist — $3.49
8. IT Equipment Maintenance Checklist in Excel — $3.49
What it is: the IT-flavoured version — a checklist for servers, UPS, network gear and workstations.
Who it is for: IT teams that need documented, repeatable hardware maintenance.
- Structured checks for critical IT hardware
- Service history you can show an auditor
- Pairs naturally with uptime-driven IT reporting
Best for: IT asset upkeep. Buy the IT checklist — $3.49
Not sure which to start with? Most teams get the fastest result from the Preventive Maintenance Dashboard in Excel at $17.99, or the Google Sheets version at $6.99 if you want zero software cost. See every option on the CMMS & equipment maintenance templates hub.
How to choose between them
Match the template to the KPI you most need to move and the tool your team already uses:
- Need PM compliance and cost KPIs, live in Excel? Preventive Maintenance Dashboard in Excel.
- Multiple sites or lines? Preventive Maintenance Dashboard in Power BI.
- OEE-led manufacturing? Medical Equipment Manufacturing KPI Dashboard.
- Tightest budget or Google-first team? Preventive Maintenance Dashboard in Google Sheets.
- No clean failure data yet? Start with the Equipment Maintenance Log Tracker, then add a dashboard.
Reporting maintenance up to an operations director? Our COO operations dashboard template stack shows where maintenance KPIs sit alongside delivery, efficiency and supplier metrics.
When a maintenance KPI template is NOT the right answer
A spreadsheet or dashboard template is the right tool when you have up to a few hundred assets and a handful of planners. It is the wrong tool when:
- You need real-time condition monitoring. Vibration, temperature and IoT sensor streams belong in a dedicated CMMS or asset performance platform, not a monthly workbook.
- Technicians must update from the floor on mobile. Templates assume a planner enters data centrally; if you need field mobile work-order updates, buy CMMS software.
- You have thousands of assets and multiple crews. At that scale, work-order routing, spares integration and permissions outgrow a spreadsheet.
- Compliance requires an audit trail with user-level logs. Regulated environments often mandate system controls a template cannot enforce.
If any of those apply, use these templates to prototype your KPIs and prove the business case first — then move the proven metrics into software. For most small and mid-size maintenance teams, a template still wins on speed and cost.
Frequently asked questions
What are the most important maintenance KPIs?
MTBF and MTTR are the two most important because reliability (time between failures) and recovery speed (time to repair) together drive availability. Beyond those, planned maintenance percentage, preventive maintenance compliance and OEE tell you whether your programme is proactive and your equipment is productive.
What is the formula for MTBF?
MTBF equals total operating time divided by the number of failures over that period. For example, if a pump ran 4,000 hours and failed 4 times, its MTBF is 1,000 hours. Count only unplanned functional failures of repairable assets, and exclude planned downtime from the operating time.
What is a good MTTR?
Lower is always better, and the right target depends on asset criticality and spare-part availability. Many lean maintenance teams aim for under 4–5 hours on critical assets. Crucially, measure the full repair time — diagnosis, waiting for parts and travel — not just the hands-on “wrench time,” which hides delays.
What is the difference between MTBF and MTTF?
MTBF is for repairable assets and measures the average time between failures. MTTF is for non-repairable items you replace rather than fix — bearings, filters, bulbs — and measures average life before failure. Using MTBF where MTTF applies (or vice versa) produces numbers your team cannot act on.
What is a world-class OEE score?
An OEE of 85% is considered world-class for discrete manufacturing, 60% is typical, and around 40% signals major losses. OEE multiplies Availability × Performance × Quality, so a low score points you to which of the three factors — downtime, speed or defects — to fix first.
What is the 85/15 rule in maintenance?
The 85/15 rule says world-class maintenance teams spend at least 85% of their labour on planned, scheduled work and no more than 15% on reactive breakdowns. It is measured by the planned maintenance percentage KPI. Falling below roughly 70% planned indicates a reactive, firefighting culture that costs more over time.
How do you calculate preventive maintenance compliance?
Divide the number of preventive maintenance work orders completed on time by the number scheduled, then multiply by 100. Measure “on time” within a defined compliance window — often a 10% grace period around the due date — rather than counting late completions, so the KPI rewards actually keeping the schedule.
What is a healthy maintenance backlog?
A healthy backlog is roughly 2–4 crew-weeks of ready, approved work measured in labour hours, not work-order count. Above about 6 crew-weeks you are under-resourced and reliability will slip; below 2 you may be overstaffed or failing to plan far enough ahead. Always track backlog in hours.
Can I track maintenance KPIs in Excel or Google Sheets?
Yes. For up to a few hundred assets, a well-built spreadsheet dashboard computes MTBF, MTTR, PM compliance, cost and availability automatically. The Preventive Maintenance Dashboard in Excel ($17.99) and the Google Sheets version ($6.99) both do this out of the box.
How many maintenance KPIs should I track?
Track a focused set of 5 to 10, not everything you can measure. Start with MTBF, MTTR, availability, PM compliance and planned maintenance percentage. Add OEE if you run production lines and % of RAV if you own the maintenance budget. Too many KPIs dilute attention and none of them move.
Get more maintenance KPI templates
Start tracking your maintenance KPIs this week. The Preventive Maintenance Dashboard in Excel ($17.99) is the fastest way to get PM compliance, cost and completion KPIs live — or grab the Google Sheets version for just $6.99. Browse the full CMMS & maintenance templates collection, and see how these compare with related KPI packs for manufacturing, warehouse, inventory, logistics & OTIF and IT (MTTR, SLA, uptime) operations. Prefer video? Watch template walkthroughs on the NextGenTemplates YouTube channel.