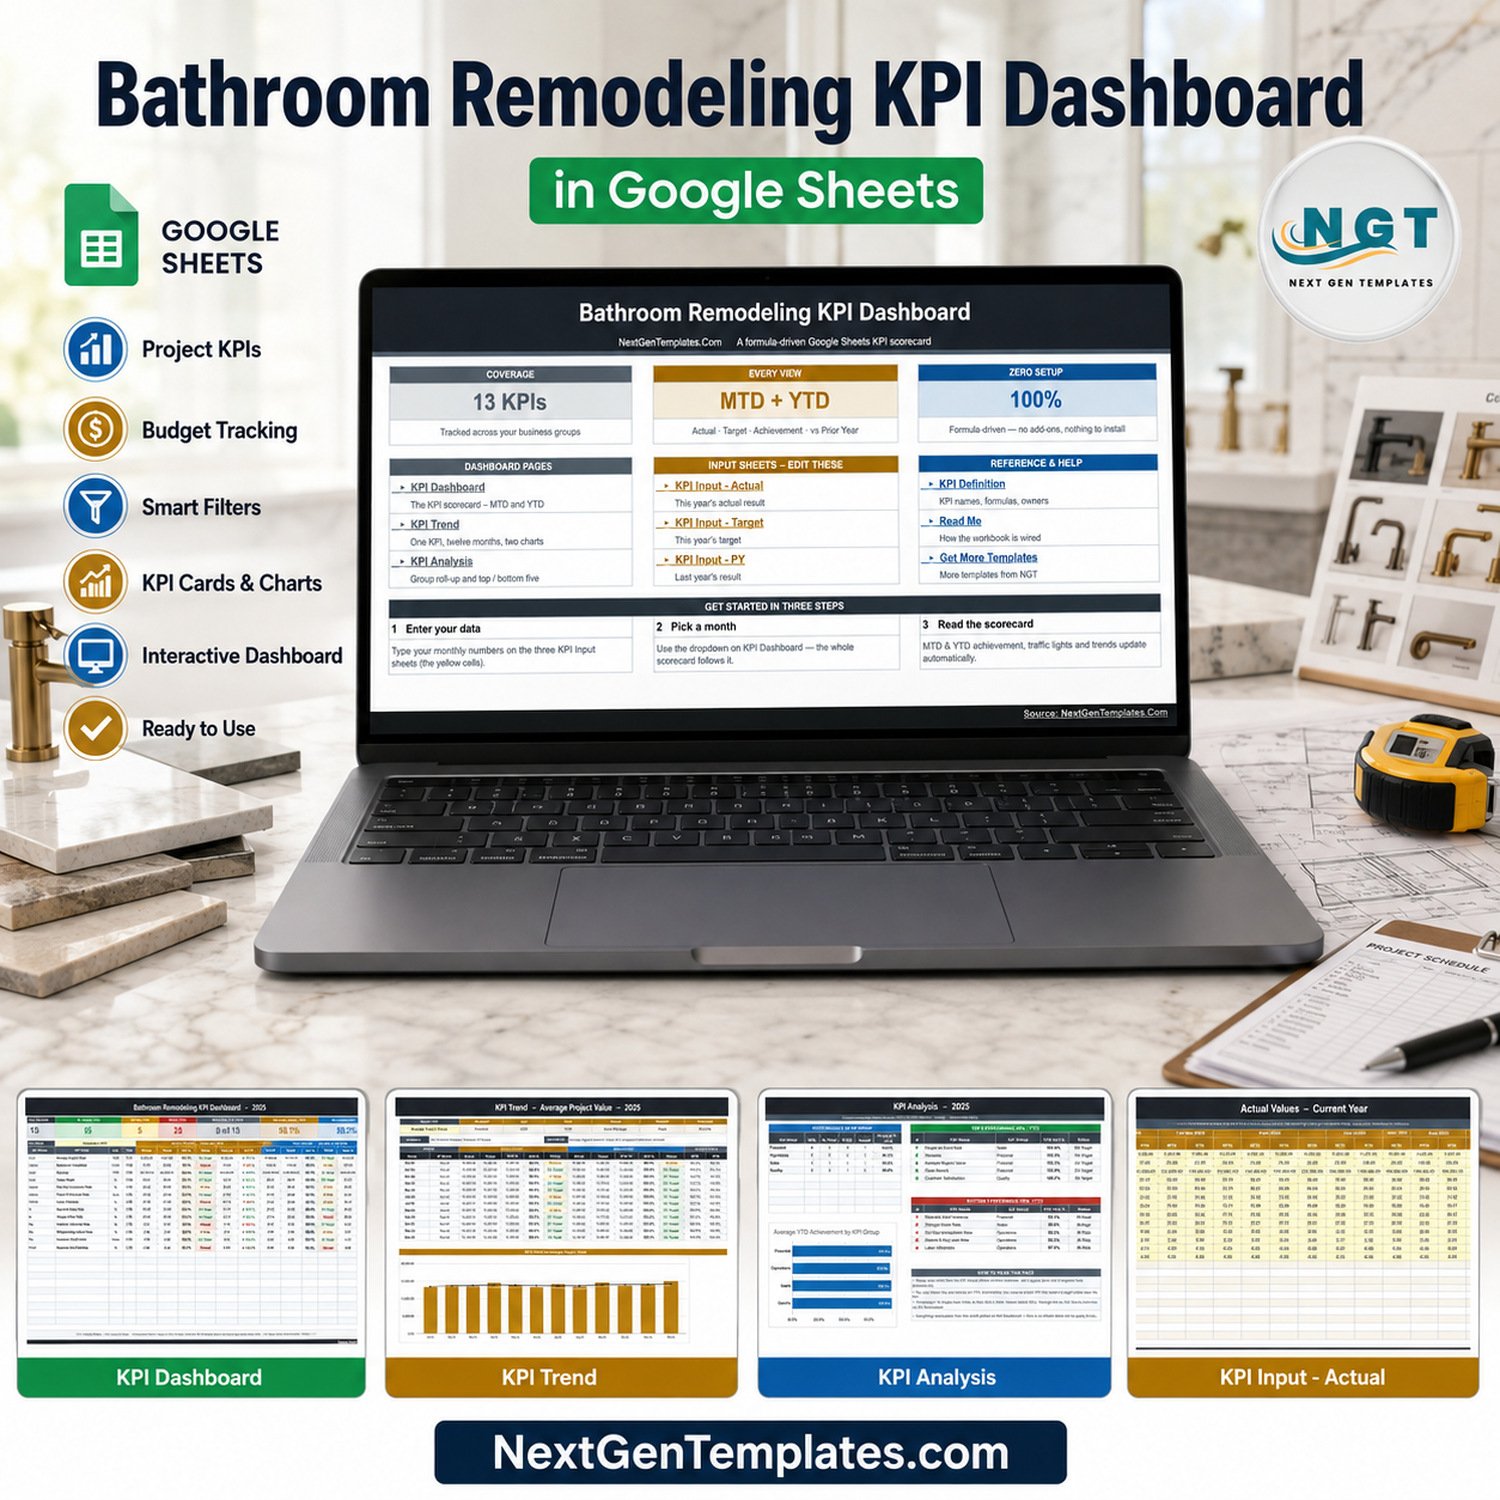
The Bathroom Remodeling KPI Dashboard in Google Sheets tracks 13 KPIs in four KPI groups (Financial, Operations, Sales and Quality) on one month-picker scorecard. Every KPI row shows Actual, Target, Achievement %, Status, Prior Year and a vs-PY arrow twice: once month-to-date and once year-to-date. Pick a month and the scorecard, the twelve-month KPI Trend page and the KPI Analysis roll-up all follow, with no add-on and no refresh step.
This template belongs to our Google Sheets KPI Dashboard family: a month picker, traffic lights, a KPI Trend page and a KPI Analysis page. It is a different product from the Bathroom Remodeling KPI Scorecard in Google Sheets and from our analytical dashboards. The figures supplied are sample data for 2025, with September 2025 selected.
✅ Instant download · One-time payment · No subscription · No per-user fees
🔑 Key Features of the Bathroom Remodeling KPI Dashboard in Google Sheets
📅 One month picker drives the workbook. The Select Month dropdown on the KPI Dashboard sets the reporting month. The month-to-date block, the year-to-date block (January 2025 to September 2025 in the sample), KPI Trend and KPI Analysis all recalculate from that one choice.
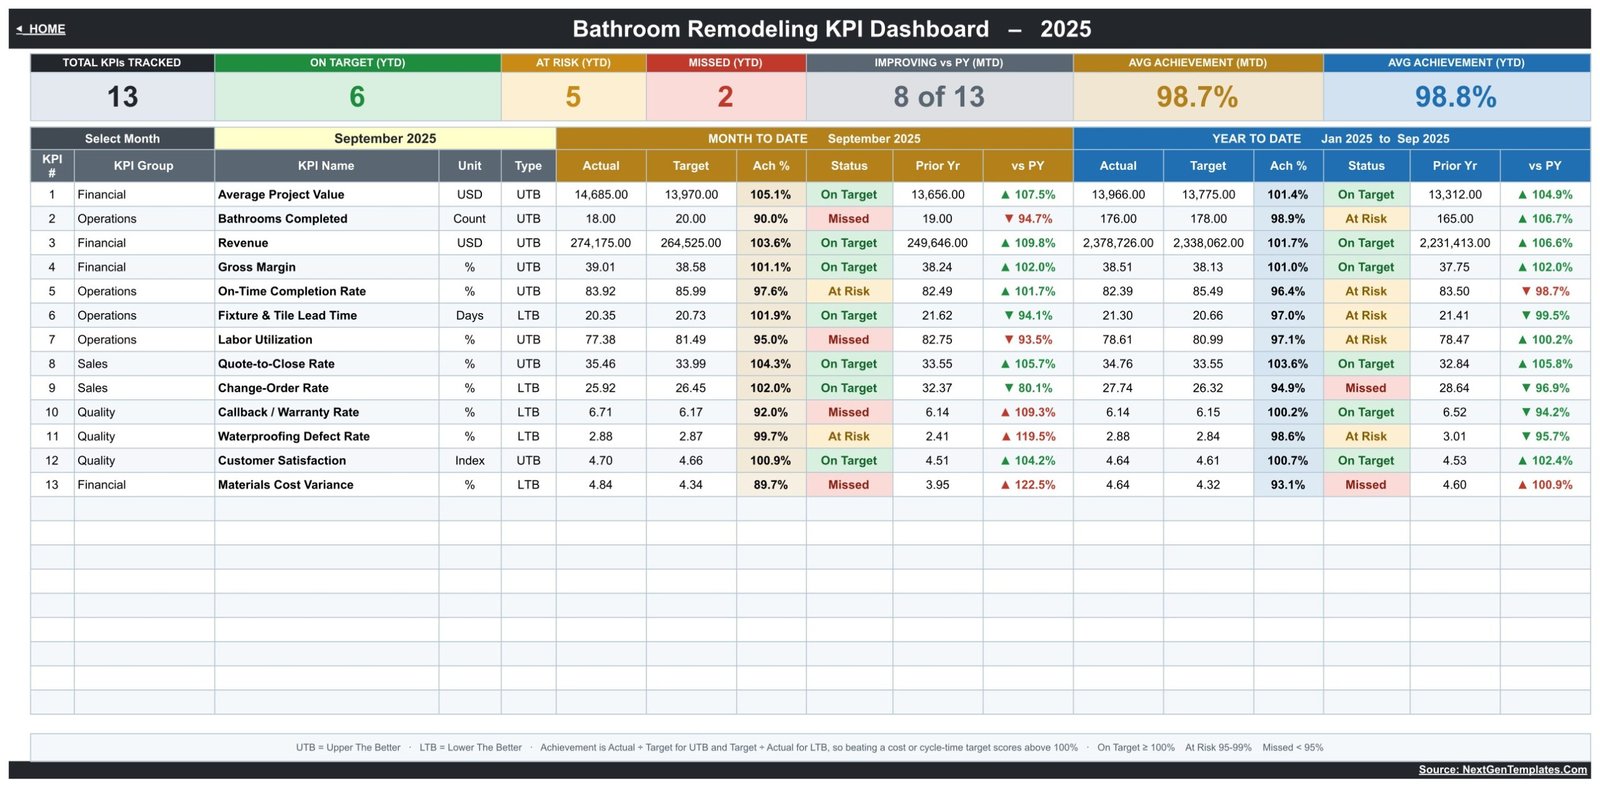
🚦 Traffic-light status for MTD and YTD. Each of the 13 KPIs gets two statuses. On Target means 100% achievement or more, At Risk means 95% to 99%, and Missed means below 95%. The status colours use native Google Sheets conditional formatting, so nothing has to be installed.
↕️ Upper-the-better and lower-the-better logic. Eight KPIs are UTB and five are LTB: Fixture & Tile Lead Time, Change-Order Rate, Callback / Warranty Rate, Waterproofing Defect Rate and Materials Cost Variance. For an LTB KPI achievement is Target ÷ Actual, so beating a cost or lead-time target scores above 100%.
📊 Seven header cards. Total KPIs Tracked, On Target (YTD), At Risk (YTD), Missed (YTD), Improving vs PY (MTD), Avg Achievement (MTD) and Avg Achievement (YTD). In the sample they read 13, 6, 5, 2, 8 of 13, 98.7% and 98.8%.
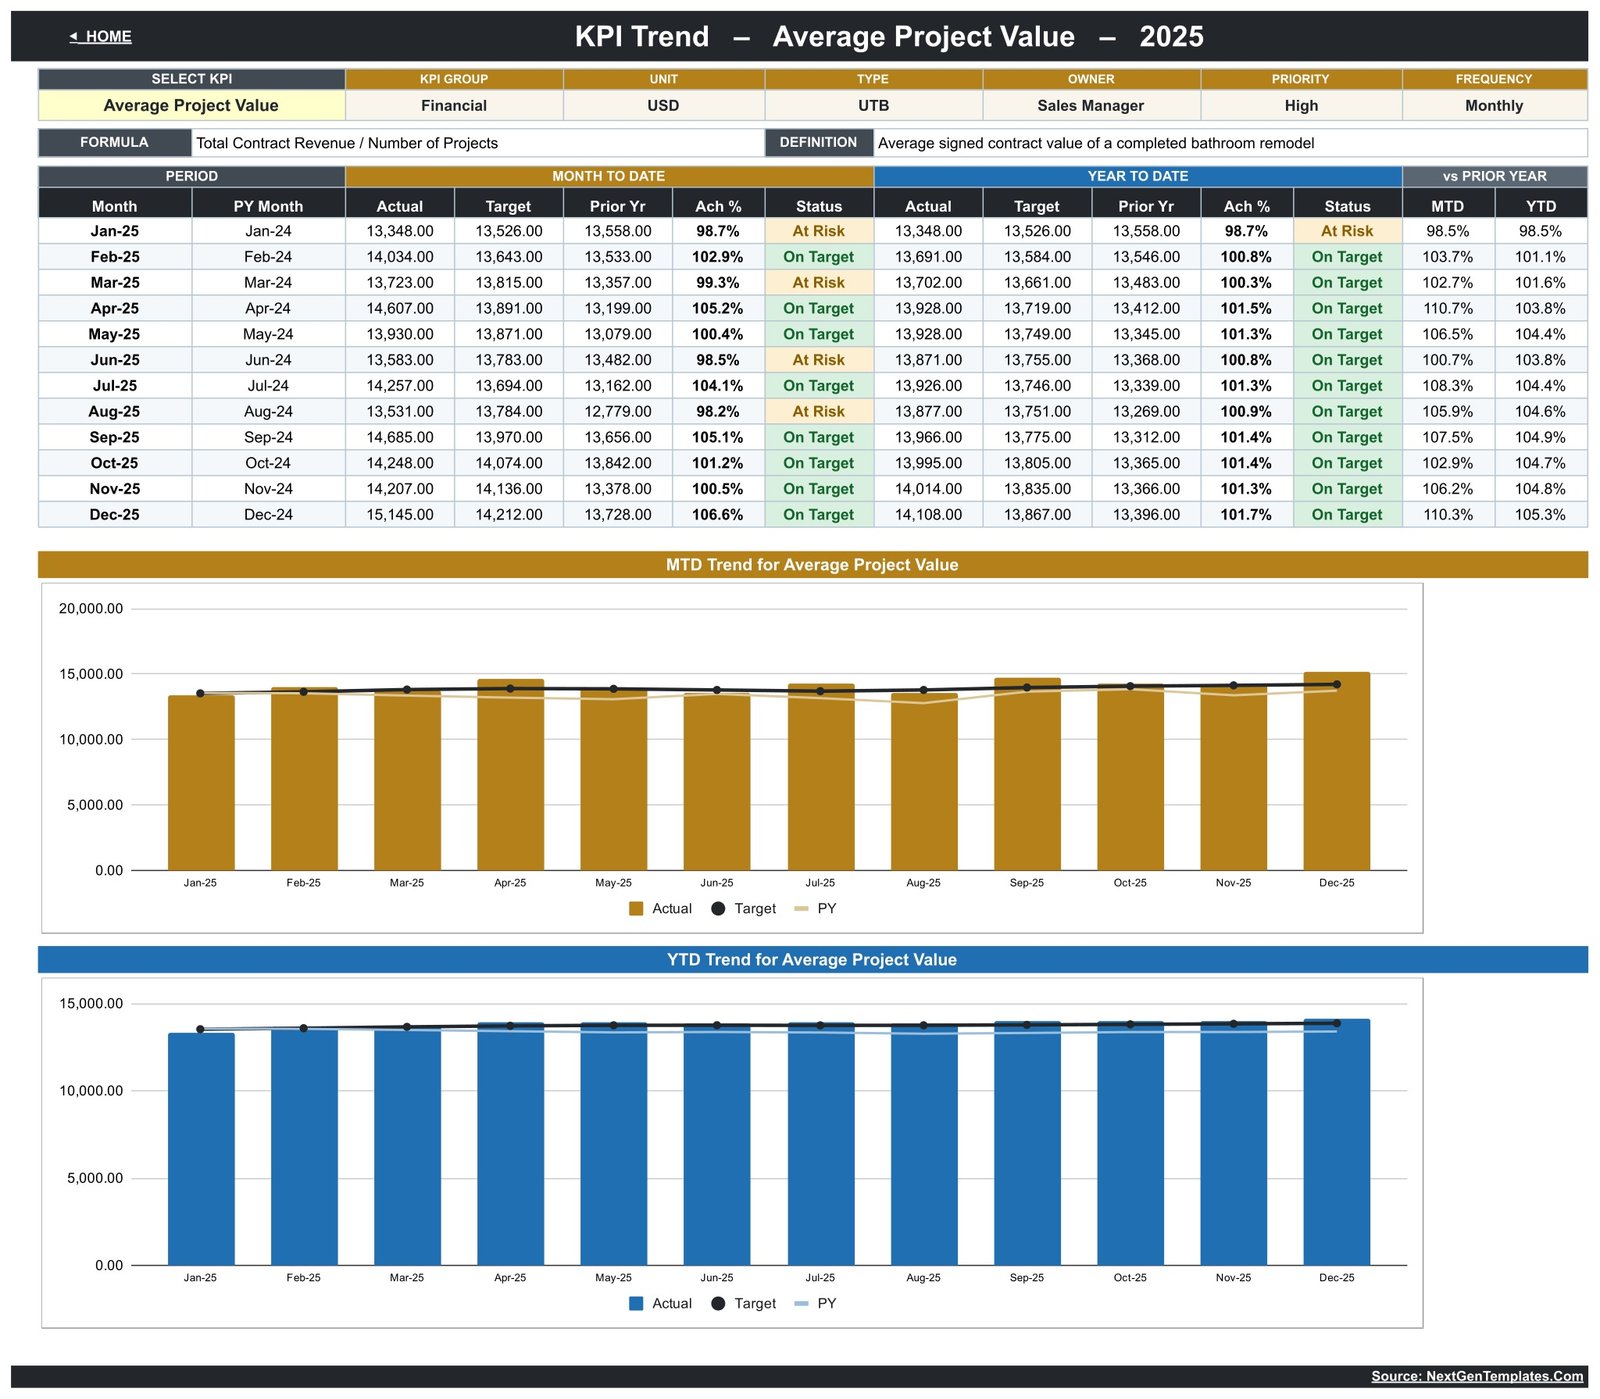
📈 Twelve-month trend for any KPI. Choose a KPI and the trend page shows its group, unit, type, owner, priority, frequency, formula and definition, a January-to-December table and two charts comparing Actual, Target and Prior Year.
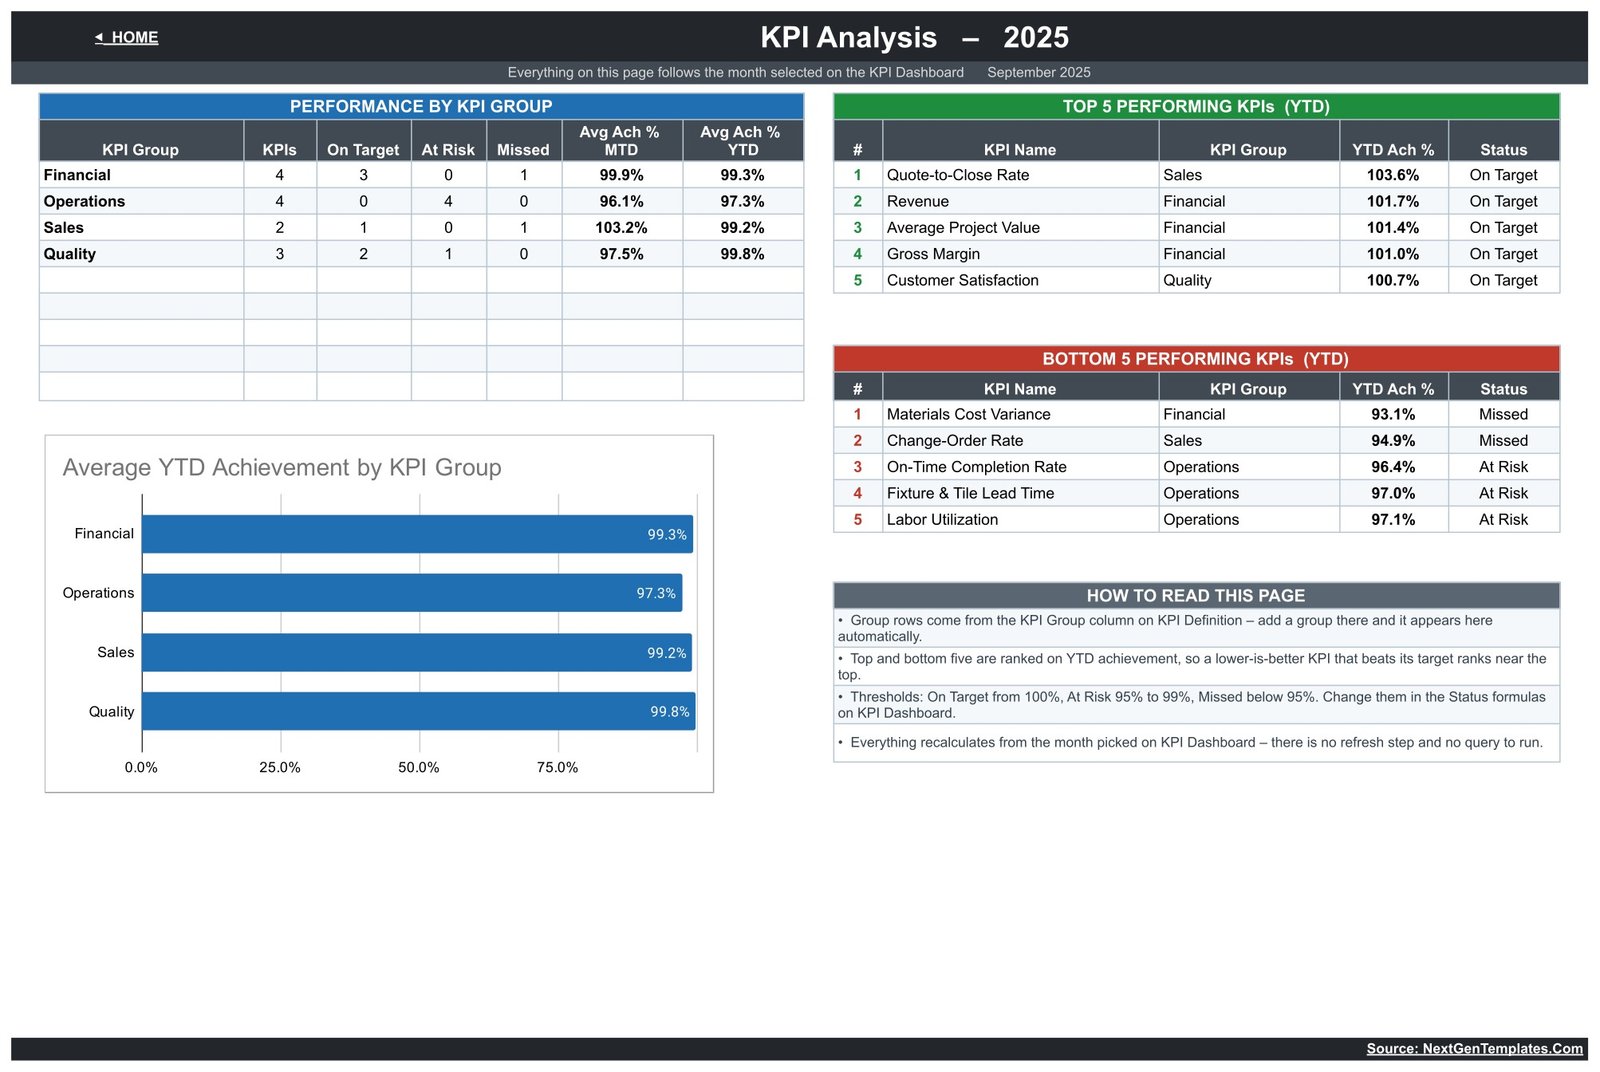
🏆 Group roll-up with top and bottom five. KPI Analysis counts On Target, At Risk and Missed KPIs per group, averages MTD and YTD achievement, and ranks the five strongest and five weakest KPIs on YTD achievement.
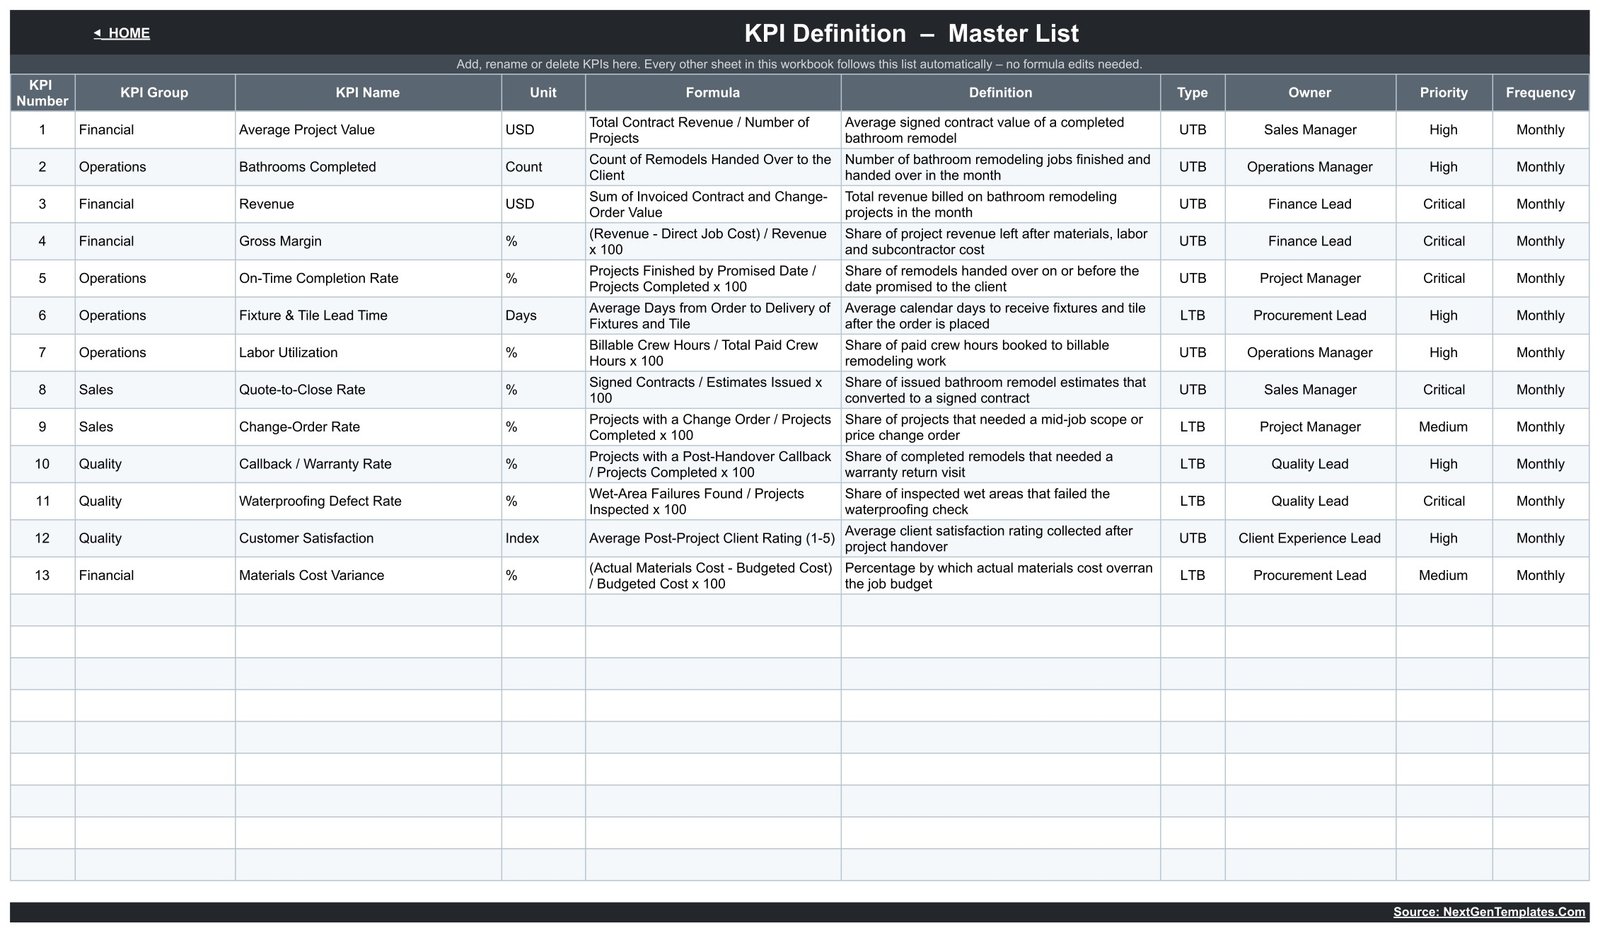
✏️ Change KPIs without editing formulas. The KPI Definition sheet holds the name, group, unit, formula, definition, type, owner, priority and frequency of each KPI, and every other sheet follows that list.
📦 What’s Inside the Template
The workbook has ten tabs: Home, KPI Dashboard, KPI Trend, KPI Analysis, KPI Input – Actual, KPI Input – Target, KPI Input – PY, KPI Definition, Read Me and Get More Templates. The 13 sample KPIs are:
- 💰 Financial (4): Average Project Value (USD), Revenue (USD), Gross Margin (%), Materials Cost Variance (%, LTB)
- 🛠️ Operations (4): Bathrooms Completed (Count), On-Time Completion Rate (%), Fixture & Tile Lead Time (Days, LTB), Labor Utilization (%)
- 🤝 Sales (2): Quote-to-Close Rate (%), Change-Order Rate (%, LTB)
- ⭐ Quality (3): Callback / Warranty Rate (%, LTB), Waterproofing Defect Rate (%, LTB), Customer Satisfaction (Index)
Home
The start page summarises coverage (13 KPIs, MTD + YTD, formula-driven), links to every dashboard, input and reference sheet, and sets out the three steps: enter your data, pick a month, read the scorecard.
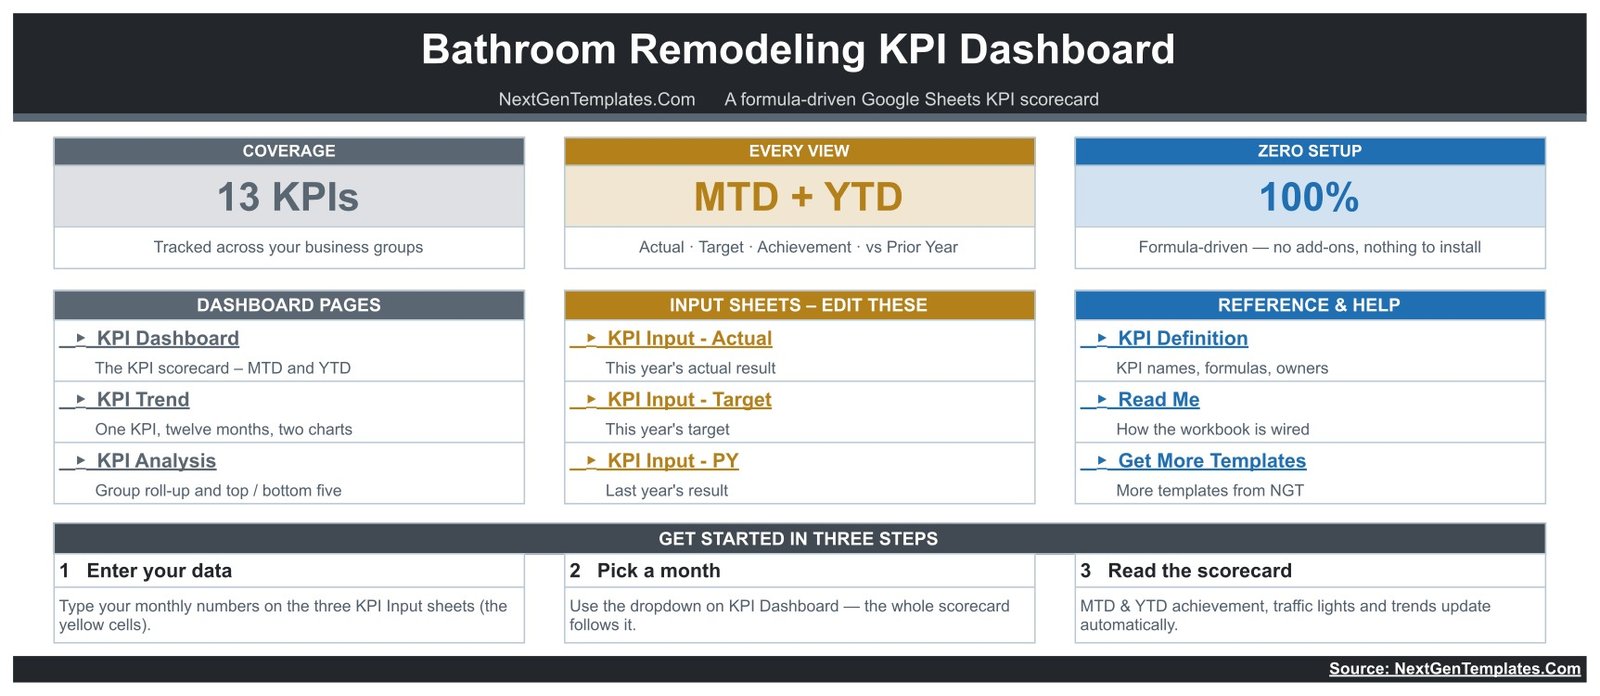
KPI Dashboard
The main scorecard lists all 13 KPIs with group, unit and type, then MTD and YTD Actual, Target, Ach %, Status, Prior Yr and vs PY, under the seven header cards and the month picker.
KPI Trend
Select one KPI (Average Project Value in the sample) to see its definition card, a twelve-month MTD and YTD table with statuses and vs-PY percentages, and two charts: MTD Trend and YTD Trend for the selected KPI.
KPI Analysis
Performance by KPI Group, the Top 5 and Bottom 5 Performing KPIs (YTD), and an Average YTD Achievement by KPI Group chart. In the sample, Quote-to-Close Rate leads at 103.6% and Materials Cost Variance trails at 93.1%.
KPI Input Sheets (Actual, Target, PY)
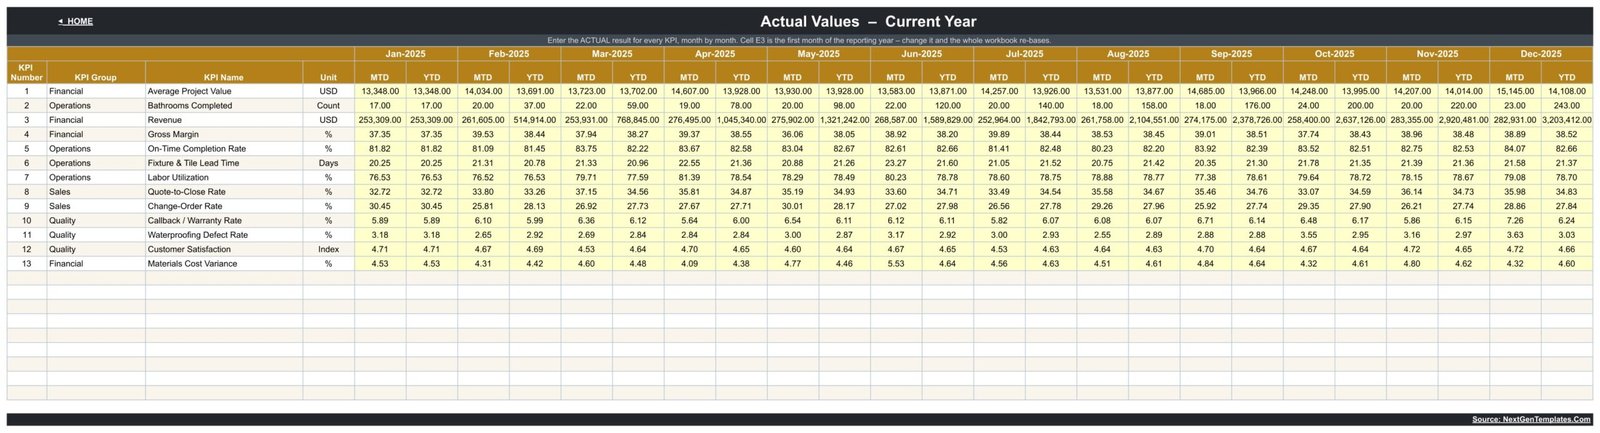
Three input sheets take monthly numbers for the current year’s actuals, the targets and last year’s results. Each month has MTD and YTD columns, and changing the first reporting month re-bases the whole workbook.
KPI Definition
The master list of KPIs with formula, definition, UTB/LTB type, owner, priority and frequency. Add, rename or delete KPIs here and the rest of the workbook follows.
📊 Bathroom Remodeling KPI Dashboard vs. Excel KPI Workbook vs. Contractor Management Software
| Feature | Bathroom Remodeling KPI Dashboard in Google Sheets | Microsoft Excel KPI Workbook | Contractor Management Software |
|---|---|---|---|
| Cost | ✅ $8.99 one-time (sale price) | Template price plus an Excel licence | Recurring subscription, often per user |
| Platform | ✅ Any browser with a Google account | Excel desktop or Microsoft 365 | Vendor web app |
| Setup | ✅ Make a copy, type monthly numbers | Open the file, type monthly numbers | Account setup and onboarding |
| Real-time team collaboration | ✅ Native Google Sheets co-editing | Needs OneDrive or SharePoint | ✅ Yes |
| Mobile access | ✅ Google Sheets app | Excel mobile app | ✅ Vendor app |
| Customizable KPIs | ✅ Edit the KPI Definition sheet | Depends on the workbook | Limited to vendor reports |
| Share with a link | ✅ Yes | Via cloud storage | User seats required |
| Year-1 cost at 5 users | ✅ One purchase | One purchase plus licences | Five paid seats for twelve months |
| MTD and YTD traffic lights out of the box | ✅ Yes | Only if built in | Varies by vendor |
| Estimating, scheduling and invoicing | ❌ Not included | ❌ Not included | ✅ Usually included |
For remodelers who want a monthly management scorecard without paying for seats in a full job-management system, this Google Sheets KPI dashboard sits in the sweet spot.
👥 Who This Template Is For — and Who It’s Not For
✅ This template is built for:
- Owners of small and mid-sized bathroom remodeling firms who review the business once a month
- Operations and project managers tracking completions, on-time handovers, lead times and crew utilization
- Sales managers watching quote-to-close and change-order rates against target
❌ This template is NOT for:
- Teams needing estimating, job scheduling, invoicing or job costing. It is a scorecard, not job-management software
- Anyone looking for building-code, licensing or warranty compliance checks. It only reports the rates you enter
⚙️ How to Use the Bathroom Remodeling KPI Dashboard
- Open the PDF in your download and click its Google Sheets link to make your own editable copy.
- On KPI Definition, rename, add or delete KPIs and set each one’s group, unit, UTB/LTB type and owner.
- Set the first month of your reporting year on the input sheets.
- Type monthly actuals, targets and prior-year numbers into the yellow cells of the three KPI Input sheets.
- Pick a month from the dropdown on KPI Dashboard and read the traffic lights.
- Open KPI Trend and KPI Analysis to see the twelve-month pattern and which groups need attention.
💼 Real-World Use Cases
A two-crew bathroom remodeler. The owner types the month’s revenue, completed bathrooms and gross margin, then checks whether Average Project Value and Quote-to-Close Rate are On Target before the monthly review with her estimator.
An operations manager with rising callbacks. He selects Callback / Warranty Rate on KPI Trend, compares twelve months of MTD results against target and last year, and pairs it with Waterproofing Defect Rate to decide where site checks need tightening.
A sales lead chasing scope creep. She uses the Bottom 5 table on KPI Analysis to show that Change-Order Rate and Materials Cost Variance are Missed YTD, and takes both into the next pricing discussion.
❓ Frequently Asked Questions
What KPIs does the Bathroom Remodeling KPI Dashboard in Google Sheets track?
It ships with 13 KPIs in four groups: Average Project Value, Revenue, Gross Margin and Materials Cost Variance; Bathrooms Completed, On-Time Completion Rate, Fixture & Tile Lead Time and Labor Utilization; Quote-to-Close and Change-Order Rate; Callback / Warranty Rate, Waterproofing Defect Rate and Customer Satisfaction. You can edit all of them.
Is this the same as the Bathroom Remodeling KPI Scorecard?
No. This is the KPI Dashboard family, with a month picker, MTD and YTD traffic lights, a KPI Trend page and a KPI Analysis page. The Bathroom Remodeling KPI Scorecard in Google Sheets is a separate template with its own layout, sold as a different product.
How long does setup take?
There is nothing to install. Make a copy from the PDF link, adjust the KPI Definition sheet if needed, and type your monthly numbers into the yellow input cells. The scorecard, trend and analysis pages calculate automatically, so most of the effort is gathering your figures.
Can I change the status thresholds?
Yes. The default thresholds are On Target from 100%, At Risk from 95% to 99% and Missed below 95%. They sit in the Status formulas on the KPI Dashboard sheet, so you can tighten or loosen them to suit how your remodeling business measures performance.
How does it compare to contractor management software?
Contractor platforms handle estimating, scheduling and invoicing on a recurring subscription. This template does none of that. It is a one-time-purchase monthly KPI scorecard that reports results you already have, which suits owners who only need the management view.
Does it check building codes, licences or warranty terms?
No. Callback / Warranty Rate and Waterproofing Defect Rate only report the percentages you enter. The template does not assess code compliance, licensing, certification or warranty obligations. The figures supplied are sample data.
👤 About the Author
Built by PK — Microsoft Certified Professional with 15+ years of Excel, Google Sheets and Power BI experience. Founder of NextGenTemplates, sharing tutorials on YouTube (@PKAnExcelExpert, @NextGenTemplates, @NeoTechNavigators). Every template is hand-built and tested before release.
🔗 Explore Related Templates
🧾 Bathroom Remodeling KPI Scorecard in Google Sheets — the same trade in our separate KPI Scorecard family.
🍳 Kitchen Remodeling KPI Dashboard in Google Sheets — the same month-picker KPI Dashboard format for kitchen projects.
🏠 Home Renovation Contractor KPI Dashboard in Google Sheets — for general renovation contractors.
📋 Kitchen Remodeling KPI Scorecard in Google Sheets and 📊 Kitchen Remodeling KPI Dashboard in Power BI.
Browse every Google Sheets KPI Dashboard template, or learn more about Google Sheets. Excel and Power BI editions of this bathroom dashboard are in preparation.
📖 Click here to read the Detailed Blog Post
🎥 Visit our YouTube channel for step-by-step video tutorials
👉 YouTube.com/@NextGenTemplates
Watch the step-by-step video Demo:
📅 Last updated: September 2026