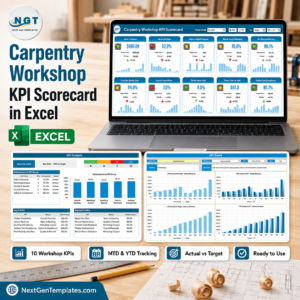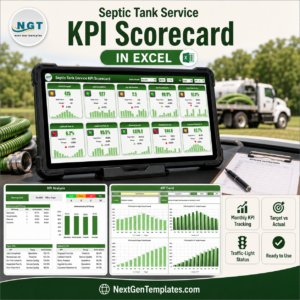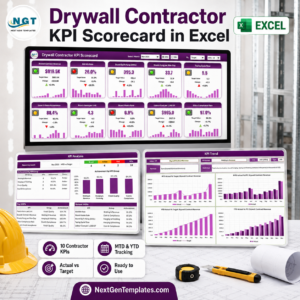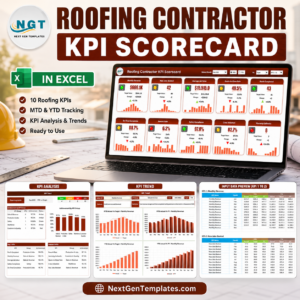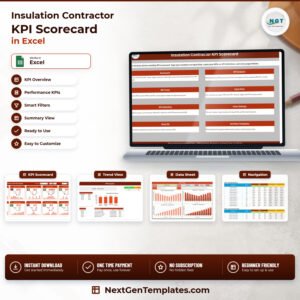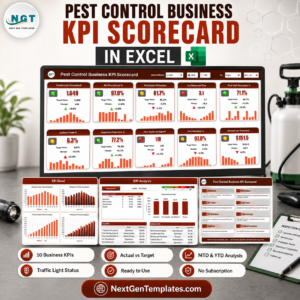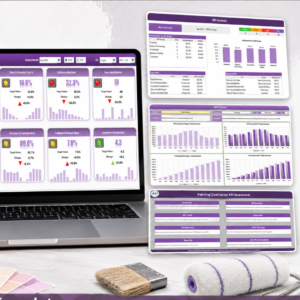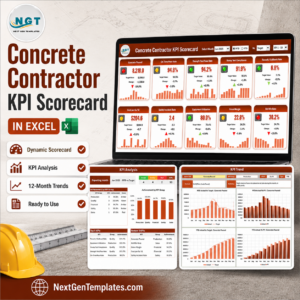
The Glass Installation KPI Scorecard in Excel is a ready-to-use monthly reporting workbook for glazing and glass installation businesses. Pick a month, and ten glass installation KPIs appear on one page with the actual value, the target, the variance, a direction-aware traffic light and a twelve-month sparkline. It is 100% formulas – no macros, no Power Query, no add-ins – so it opens on any Excel from 2016 onward and needs nothing enabled before it works.
This is the Scorecard line, not the analytics dashboard line. It answers one question every month: which parts of the installation operation hit target and which did not. You type finished figures on two sheets and the other seven pages follow automatically.

Key Features of the Glass Installation KPI Scorecard in Excel
- Ten glazing KPIs on one page – grouped as Installation, Quality, Customer, Safety and Financial
- Month picker with an MTD / YTD switch – the header reads Aug-2025, and one radio button moves every tile from month-to-date to year-to-date
- Three comparison bases – the Vs. dropdown compares actuals against Target, against the same period last year (PY), or against the Prior Month
- Direction-aware traffic lights – eight Upper-the-Better KPIs and two Lower-the-Better ones, so a falling breakage rate reads green rather than red
- A twelve-month sparkline on every tile – value, target, change and shape of the year in one card
- KPI Analysis page – achievement by KPI group, a red / amber / green count strip, and Top 5 / Bottom 5 tables
- KPI Trend page – four charts for whichever KPI you pick: MTD vs Target, MTD vs PY, YTD vs Target and YTD vs PY
- Room for twenty KPIs – ten arrive filled with glazing metrics, and the KPI set picker switches the Scorecard between KPI 1-10 and KPI 11-20
- Editable RAG bands – move the amber and red thresholds on one sheet and every light on every page follows
- Instant download – the .xlsx workbook plus the Excel KPI Scorecard user manual PDF in a single ZIP
What’s Inside
Nine sheets, and only two of them are yours to type in.

Scorecard is the month tile wall. In the sample month, Aug-2025 measured against Target, On-Time Installation sits at 94.7% against a 93.6% target with a green light, Glass Breakage Rate is at 2.8% against 2.9% and reads green because lower is better, and Safety Incident Rate at 2.3 against a target of 2.0 turns red. Each tile carries the target value, the absolute change, the percentage change with an up or down arrow, and the twelve-month sparkline.

KPI Analysis summarises the same month. A strip at the top counts the lights – four green, four amber, two red across ten KPIs. Achievement by KPI Group tables and charts the five groups: Installation 97.0%, Quality 99.9%, Customer 96.1%, Safety 87.0% and Financial 93.5%. Below that, Top 5 and Bottom 5 tables rank every KPI by achievement, so Glass Breakage Rate at 103.6% leads and Lead-to-Install Rate at 85.0% is the one to talk about in the meeting.

KPI Trend takes one KPI at a time. Choose it from the dropdown and the page restates its group, unit, direction, formula and definition, then draws four charts across the twelve months: MTD actual against target, MTD actual against last year, and the same pair on a year-to-date basis.
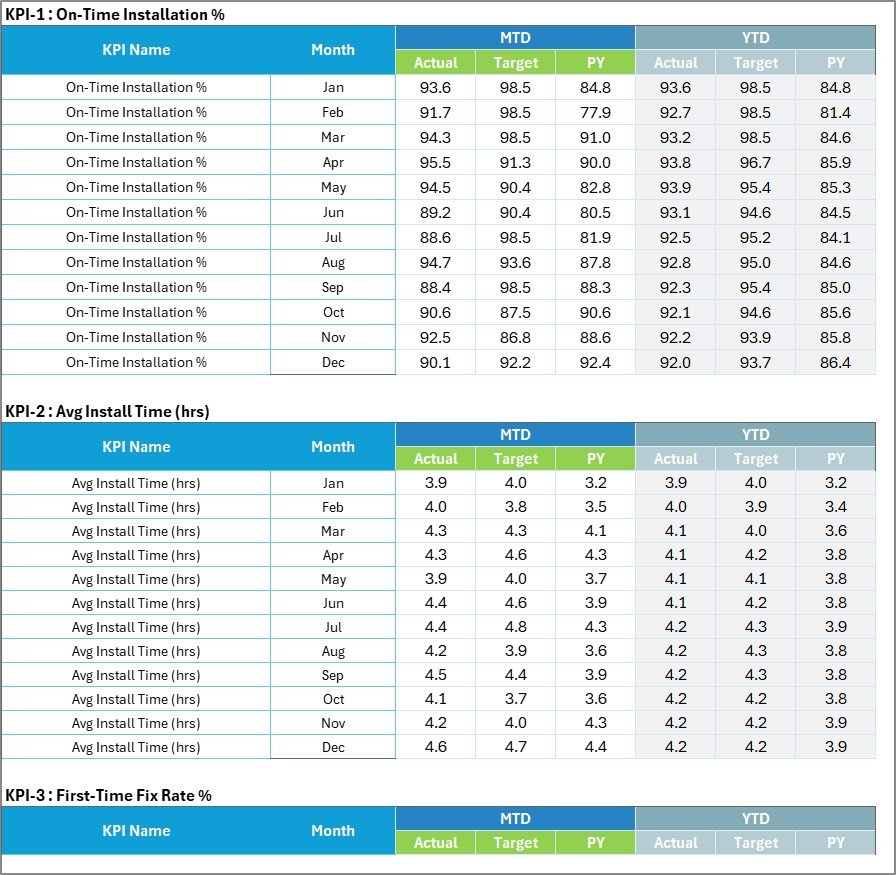
Input Data is the first of the two sheets you edit. Each KPI gets a numbered block of twelve monthly rows with MTD Actual, Target and PY, then YTD Actual, Target and PY. KPI Definition is the second: name, group, unit, formula, definition, direction (UTB or LTB) and YTD basis for each KPI, with a Check column that flags duplicate names.

Color Settings holds the RAG bands and the report identity. Out of the box an Upper-the-Better KPI is green at or above target, amber within 10% of it and red beyond that, with the mirror image for Lower-the-Better KPIs. The report title and reporting year live here too, and the year is what makes the month picker read Aug-2025 rather than a bare Aug. Read Me explains the wiring in plain English, and Get More Templates points at the rest of the catalogue.
The ten KPIs it ships with

| KPI | Group | Formula | Direction |
|---|---|---|---|
| On-Time Installation % | Installation | Jobs Installed On Schedule / Total Jobs Installed | Higher is better |
| Avg Install Time (hrs) | Installation | Total Crew Install Hours / Jobs Completed | Lower is better |
| First-Time Fix Rate % | Quality | Jobs Completed Without Return Visit / Total Jobs | Higher is better |
| Glass Breakage Rate % | Quality | Panes Broken In Handling / Total Panes Installed | Lower is better |
| Measurement Accuracy % | Quality | Correctly Measured Openings / Total Openings Measured | Higher is better |
| Customer Satisfaction % | Customer | Positive Survey Responses / Total Survey Responses | Higher is better |
| Callback Rework Rate % | Customer | Jobs Requiring A Return Visit / Total Jobs | Lower is better |
| Safety Incident Rate | Safety | Recordable Incidents x 100000 / Crew Hours Worked | Lower is better |
| Revenue per Job (USD) | Financial | Total Installation Revenue / Jobs Completed | Higher is better |
| Lead-to-Install Rate % | Financial | Leads Converted To Installs / Total Qualified Leads | Higher is better |
Every one of them is a label you can overwrite. Rename them on KPI Definition and the tiles, charts, groups and rankings all follow, because each page looks a KPI up by name.
Excel scorecard vs. Google Sheets vs. field-service SaaS reporting
| This Excel scorecard | Google Sheets edition | Field-service SaaS reporting | |
|---|---|---|---|
| Cost | One-off, under $20 | One-off, under $20 | Per user, per month, forever |
| Works offline | Yes | No | No |
| Your own KPI names | Yes, all twenty | Yes | Rarely – fixed metric set |
| Move the red / amber lines | Yes, one sheet | Yes | Usually locked |
| Macros or add-ins to enable | None | None | n/a |
| Needs your job data in their system | No | No | Yes |
Choose this if you already close the month in a spreadsheet and want the numbers presented properly. Choose the SaaS if you need live job-level data rather than a monthly summary.
Who this is for – and who it is not for
A good fit: glazing contractors and glass installation firms with two to fifty crews; branch managers who report monthly to an owner; operations leads who already track jobs, breakages and callbacks somewhere and need a management view; anyone preparing a board or franchise pack.
Not a good fit: teams that want live job dispatch or scheduling – this is a reporting layer, not an operational system. It also will not pull figures out of your CRM automatically; you paste or link the monthly totals in yourself.
How to Use the Glass Installation KPI Scorecard in Excel
- Download the ZIP and open the workbook. Nothing to enable – there are no macros.
- On Color Settings, set your report title and reporting year.
- On KPI Definition, rename any of the ten KPIs, set the unit, the formula text, the direction (UTB or LTB) and the YTD basis. Watch the Check column for duplicate names.
- On Input Data, type twelve months of MTD and YTD figures – Actual, Target and PY – into the numbered block for each KPI.
- Go to Scorecard, choose the month, pick MTD or YTD and choose what to compare against. The tiles, lights and arrows update.
- Read KPI Analysis for the group picture and the Top 5 / Bottom 5, then use KPI Trend to look at any single KPI across the year.
- Adjust the amber and red bands on Color Settings if your tolerance is tighter or looser than 10%.
Real-world use cases
- Monthly operations review. Open the Scorecard on the current month and work down the two red tiles first.
- Breakage and rework control. Glass Breakage Rate and Callback Rework Rate sit next to each other, so the cost of handling damage and the cost of returning to site read as one story.
- Crew productivity. Avg Install Time against On-Time Installation shows whether faster crews are quietly missing promised dates.
- Sales pipeline health. Lead-to-Install Rate against Revenue per Job separates a quoting problem from a pricing problem.
- Safety reporting. Safety Incident Rate per 100,000 crew hours is the figure insurers and main contractors ask for.
Frequently Asked Questions
Does it connect to my CRM, job-management app or accounting system?
No. You type or paste the finished monthly figures onto Input Data. That is deliberate – it keeps the workbook portable and means it never needs your customer data.
Are macros required?
No. It is 100% formulas, conditional formatting, camera pictures and sparklines. There is nothing to enable and no security prompt.
Can I change the KPI names to my own?
Yes. Rename them on KPI Definition and every page follows, because each page looks a KPI up by name. Names have to be unique, and the Check column tells you when one is not.
Does it calculate year-to-date for me?
No, and that is on purpose. The correct roll-up differs by KPI – a sum for volumes and revenue, an average for rates – so you type the finished YTD figure and record the method you used in the YTD Basis column.
How many KPIs can it hold?
Twenty. Ten arrive filled in. The Scorecard shows ten at a time and the KPI set picker in the header switches between KPI 1-10 and KPI 11-20.
Can I really move the red and amber thresholds?
Yes. They are cells on Color Settings, not hard-coded rules. Change them and every traffic light on every page re-reads them immediately.
Is this the same as your Glass Installation KPI Dashboard?
No. This is the scorecard line – a monthly month-picker report with targets and traffic lights. The dashboard line is a slicer-driven analytics view built on transaction-level data. They are companions, and plenty of firms run both.
Which Excel versions does it work on?
Excel 2016 and later on Windows or Mac, and Microsoft 365. It is a plain .xlsx.
What exactly is in the download?
One ZIP containing the .xlsx workbook and the Excel KPI Scorecard user manual PDF.
Explore related templates
- Glass Installation KPI Scorecard in Google Sheets – the same scorecard for teams that live in Sheets
- Glass Installation KPI Dashboard in Power BI – the analytics companion to this scorecard
- Glass Installation KPI Dashboard in Google Sheets – the same analytics view, in Sheets
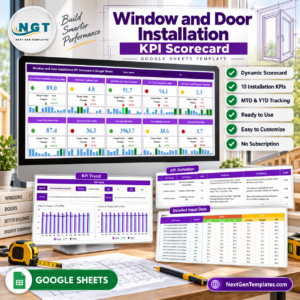
- Window and Door Installation KPI Scorecard in Google Sheets
- Solar Panel Installation KPI Scorecard in Google Sheets
- Locksmith Business KPI Scorecard in Excel – the same workbook, tuned for locksmiths

Download the Glass Installation KPI Scorecard in Excel, spend twenty minutes on Input Data, and every month after that is a month picker and a screenshot.