

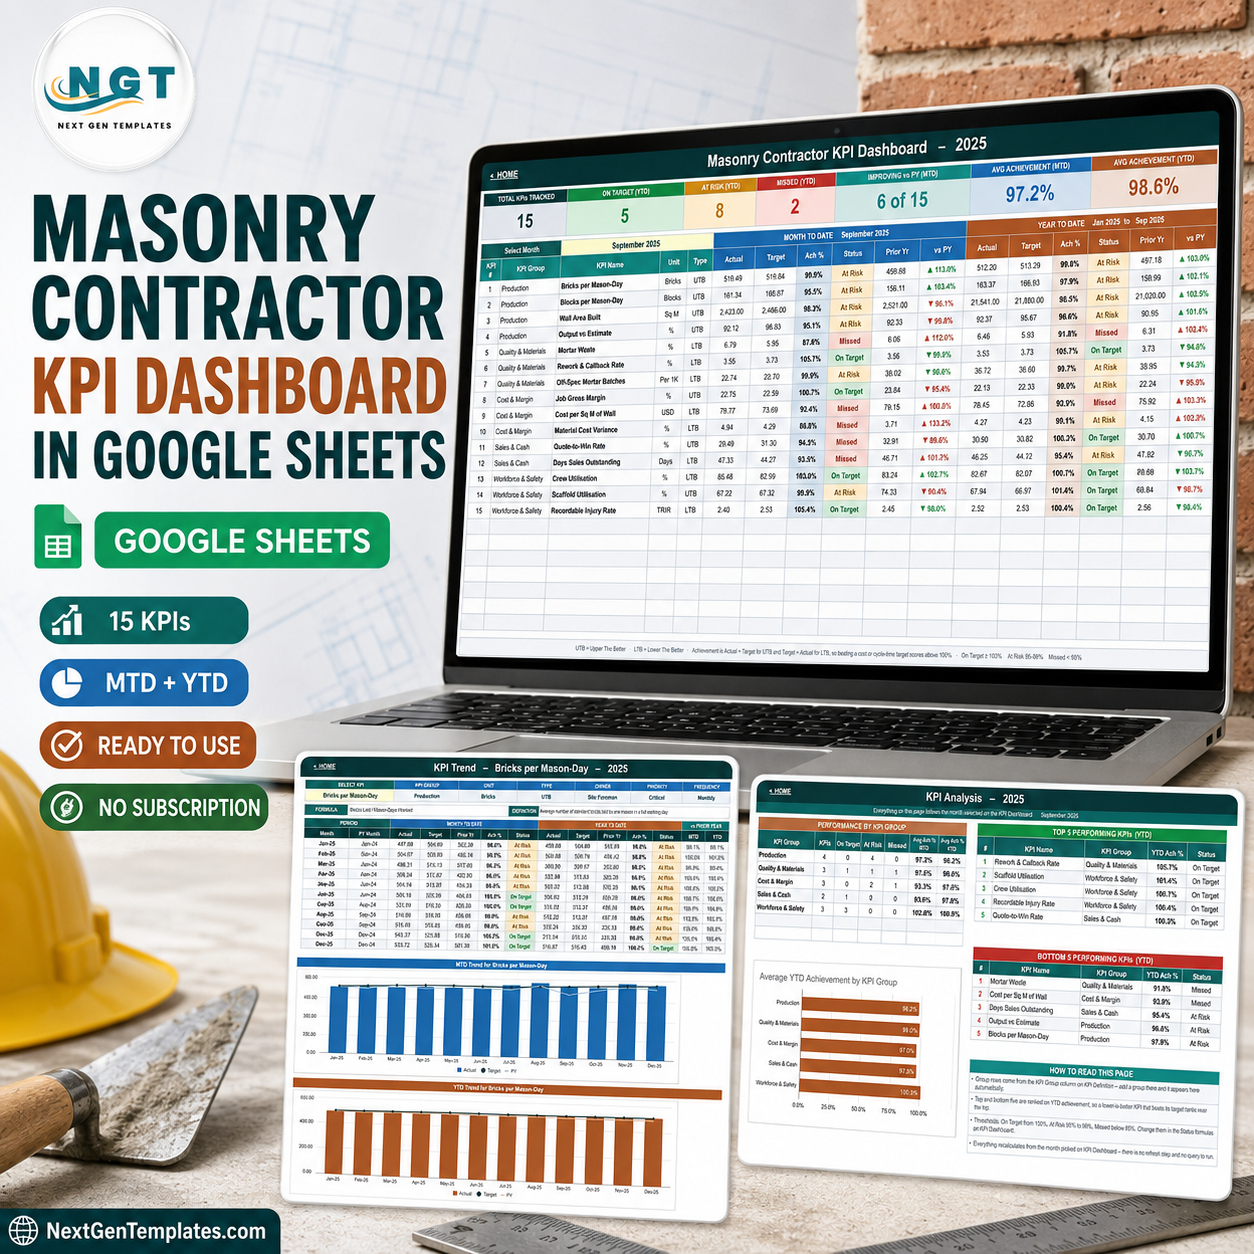

The Masonry Contractor KPI Dashboard in Google Sheets is a formula-driven monthly scorecard that tracks 15 masonry KPIs across 5 groups – Production, Quality & Materials, Cost & Margin, Sales & Cash, and Workforce & Safety – with MTD and YTD side by side, a target, an achievement percentage, a traffic light and a prior-year comparison on every single row. Eleven tabs, one month dropdown, zero add-ons: it opens in a browser and recalculates instantly. Sample data for January to December 2025 ships inside so you can see it working before you type a number. Instant download, lifetime access, and free bug fixes.
Which template is this? NextGenTemplates publishes three similarly named masonry products and they are genuinely different files. This one is the KPI Dashboard: a month-picker scorecard with a traffic-light grid, a dedicated KPI Trend page and a KPI Analysis page, fed by three separate input sheets (Actual, Target, Prior Year). The Masonry Contractor KPI Scorecard in Google Sheets is a different template with a different layout, and the analytical dashboards in our Google Sheets catalogue are different again. Buy the one that matches the page images on this listing.
Key Features of the Masonry Contractor KPI Dashboard in Google Sheets
- 15 masonry KPIs in 5 groups – Production (4), Quality & Materials (3), Cost & Margin (3), Sales & Cash (2), Workforce & Safety (3).
- Seven summary cards across the top: Total KPIs Tracked, On Target (YTD), At Risk (YTD), Missed (YTD), Improving vs PY (MTD), Avg Achievement (MTD) and Avg Achievement (YTD). In the shipped September 2025 sample they read 15, 5, 8, 2, 6 of 15, 97.2% and 98.6%.
- One month dropdown drives everything. Cell D6 on the KPI Dashboard sheet lists the twelve months of the reporting year; the scorecard and the KPI Analysis page both follow it. There is no refresh step and no query to run.
- MTD and YTD in parallel – each half carries Actual, Target, Ach %, Status, Prior Yr and vs PY, so twelve numbers per KPI on one row.
- UTB / LTB direction handling. Every KPI is typed Upper-The-Better or Lower-The-Better. Achievement is Actual ÷ Target for UTB and Target ÷ Actual for LTB, so beating a cost, waste or days-outstanding target scores above 100% just like beating a revenue target. Seven of the fifteen KPIs here are LTB.
- Traffic lights with editable thresholds – On Target from 100%, At Risk 95% to 99%, Missed below 95%. The bands live in the Status formulas on the KPI Dashboard sheet, so you can move them to your own governance.
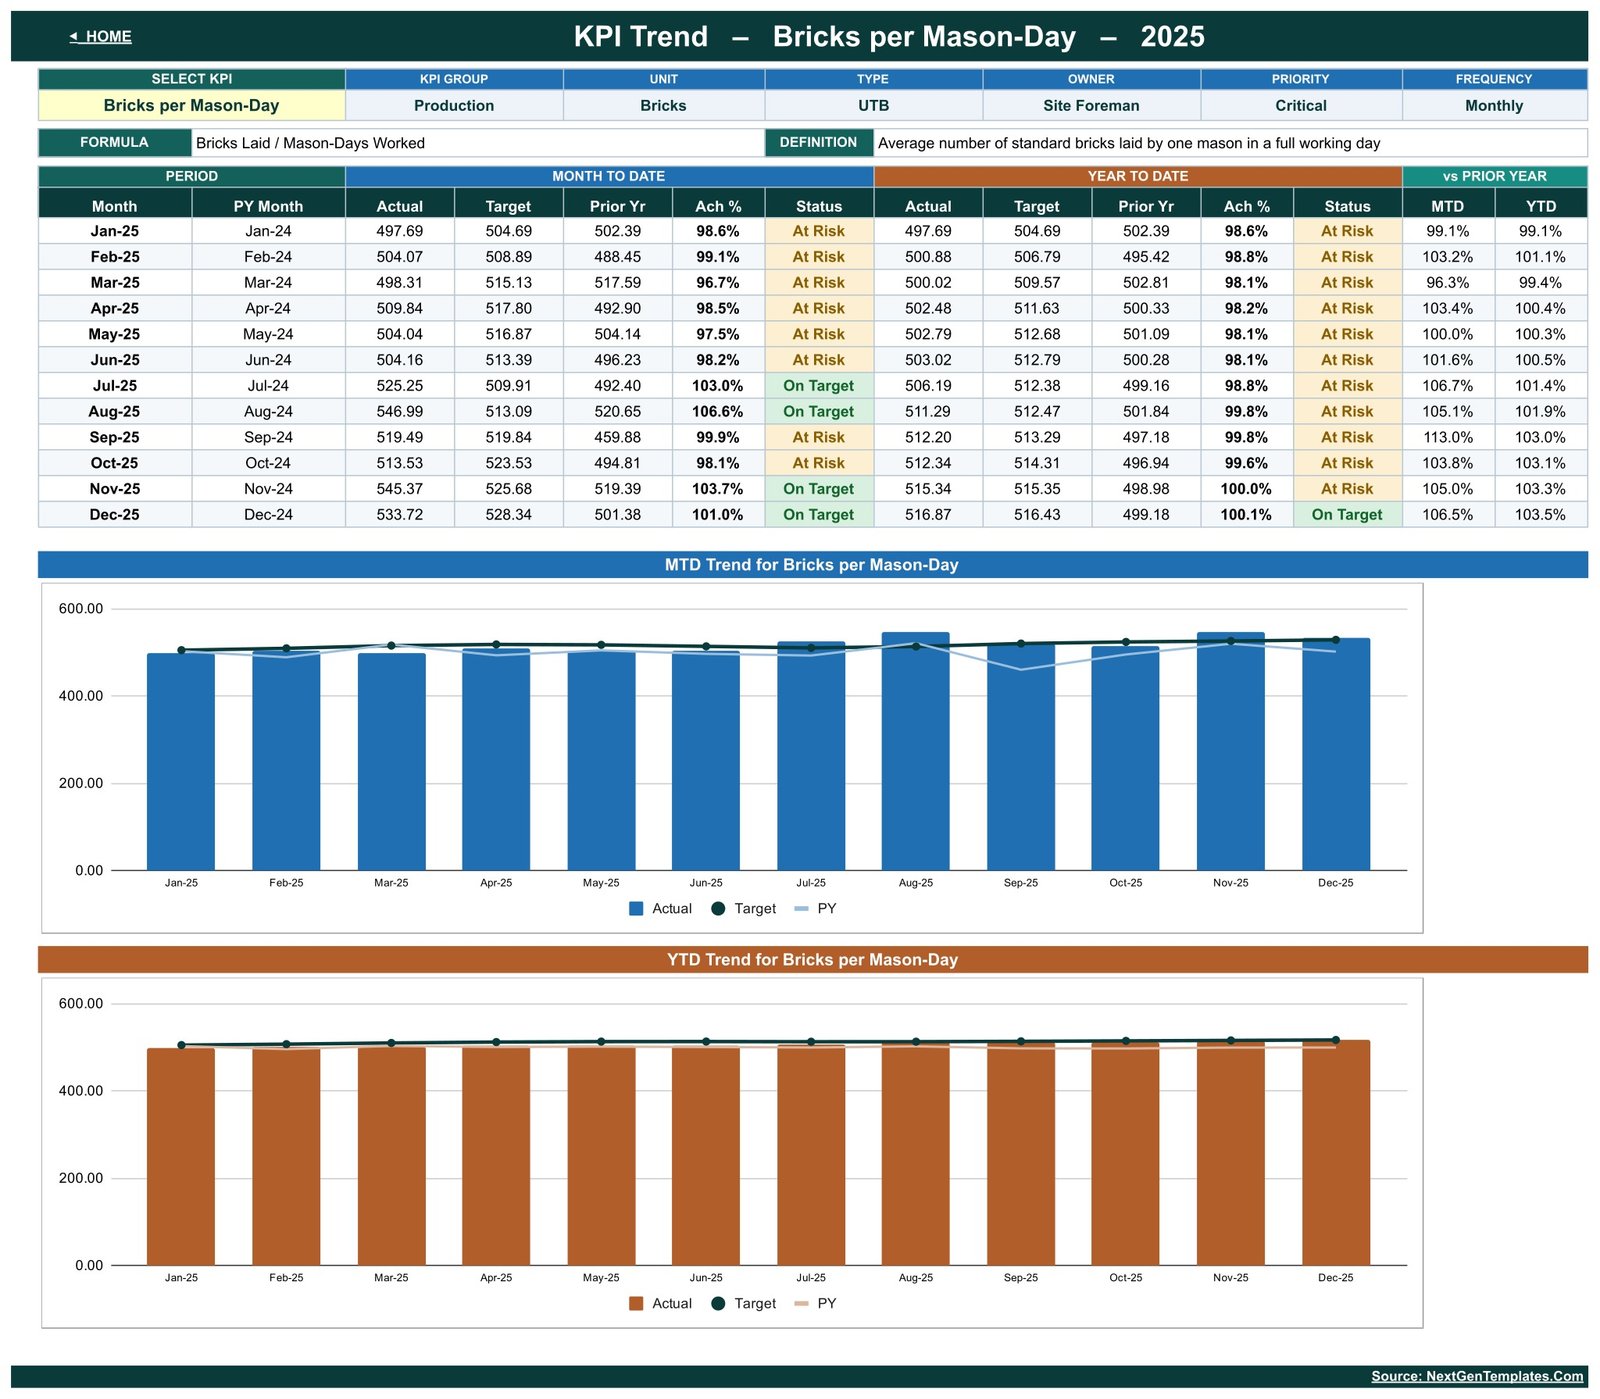
- KPI Trend page – pick any KPI from a dropdown and get its attribute strip, formula, definition, a twelve-month table and two charts: MTD Trend and YTD Trend, each plotting Actual as columns against a Target line and a Prior Year line.
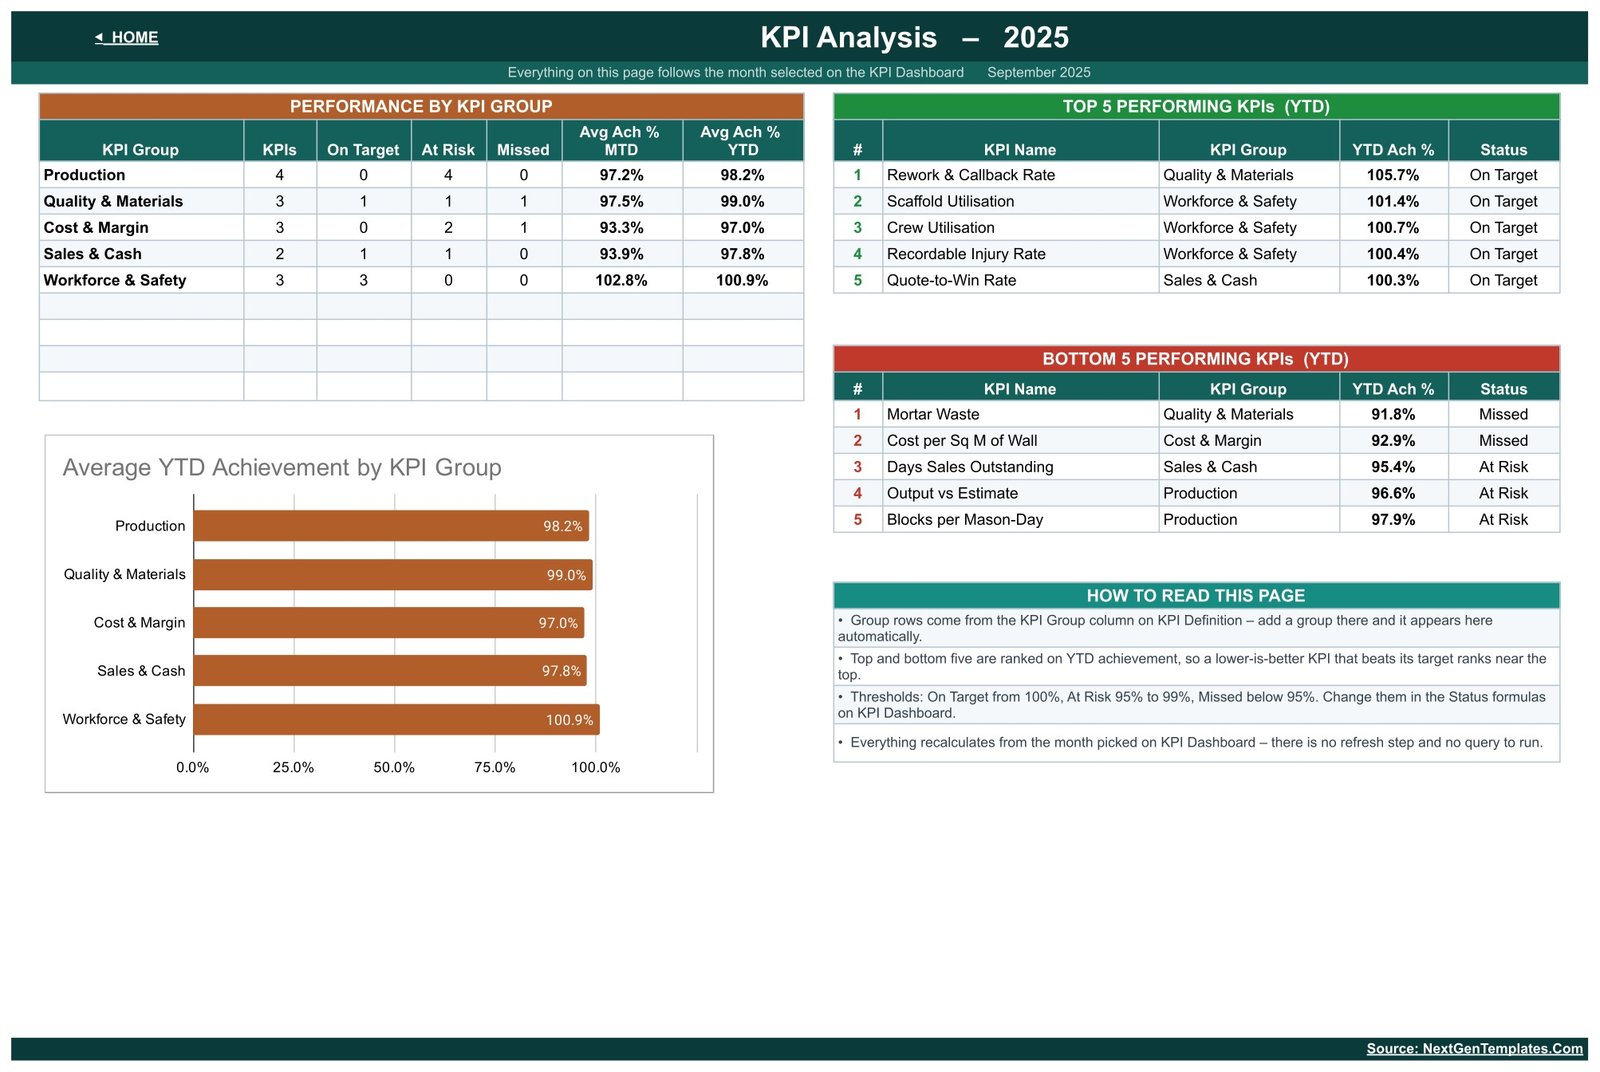
- KPI Analysis page – achievement rolled up by KPI group, an Average YTD Achievement by KPI Group bar chart, plus Top 5 and Bottom 5 performing KPIs for the year to date.
- Wired for 22 KPIs, 15 filled. The seven spare rows are already live, so adding a KPI is a typing job on the KPI Definition sheet – no formula editing anywhere.
- Plain worksheet formulas only. No Apps Script, no macros, no add-ons, no subscription. Nothing is locked or hidden.
What’s Inside the Masonry Contractor KPI Dashboard in Google Sheets
Eleven tabs, in the order they appear:
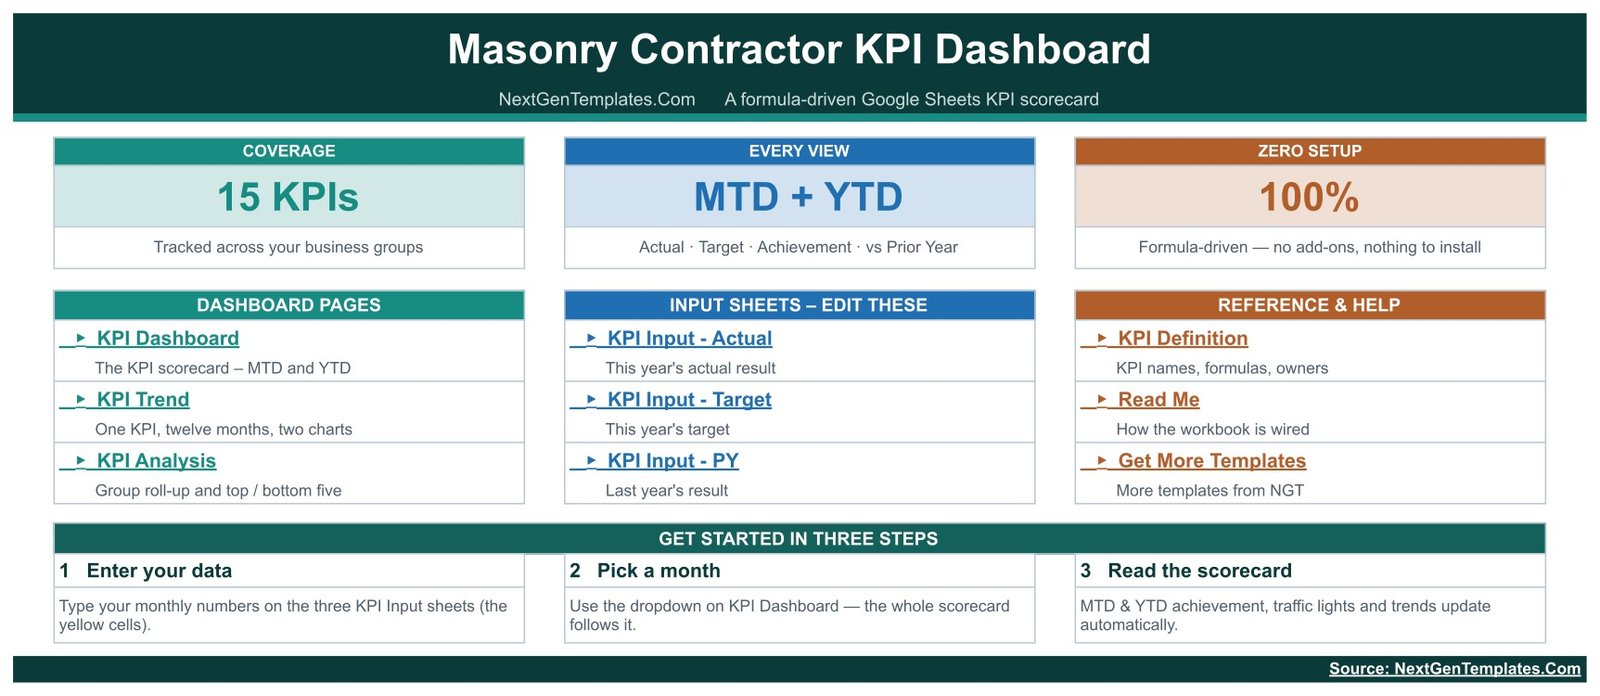
- Home – coverage cards, links to every page, and a three-step start guide.
- KPI Dashboard – the scorecard: month dropdown, seven summary cards, one row per KPI with MTD and YTD blocks.
- KPI Trend – one KPI at a time across twelve months, with the two trend charts.
- KPI Analysis – group roll-up, group bar chart, top and bottom five, and a “How to read this page” panel.
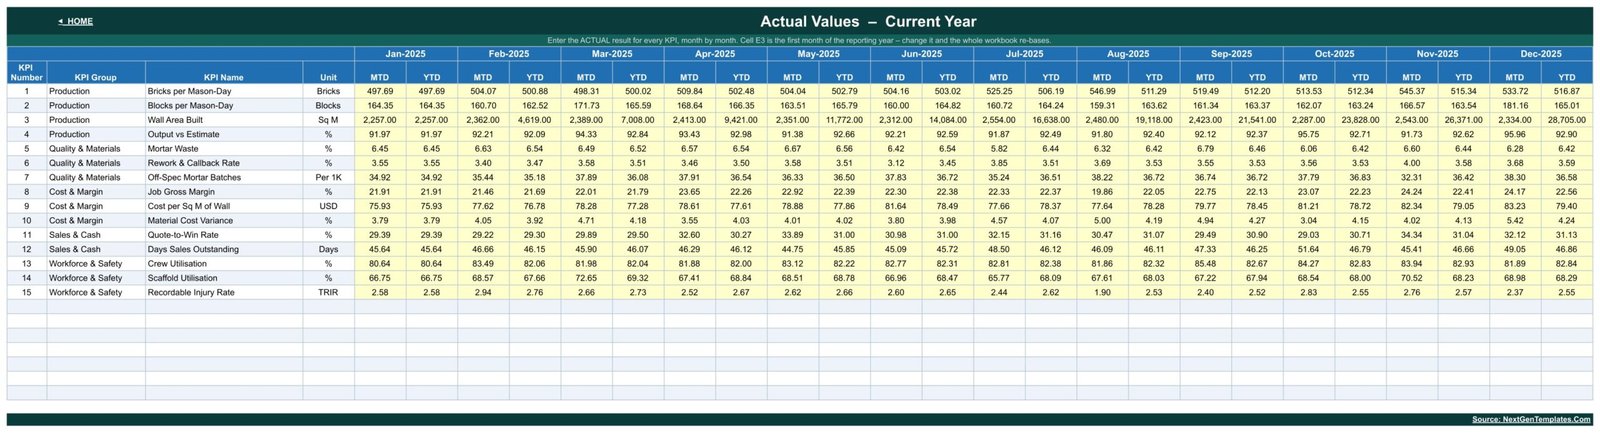
- KPI Input – Actual – your result for each month (the yellow cells). Cell E3 sets the first month of the reporting year and the whole workbook re-bases from it.
- KPI Input – Target – the monthly target.
- KPI Input – PY – last year’s result for the same months.
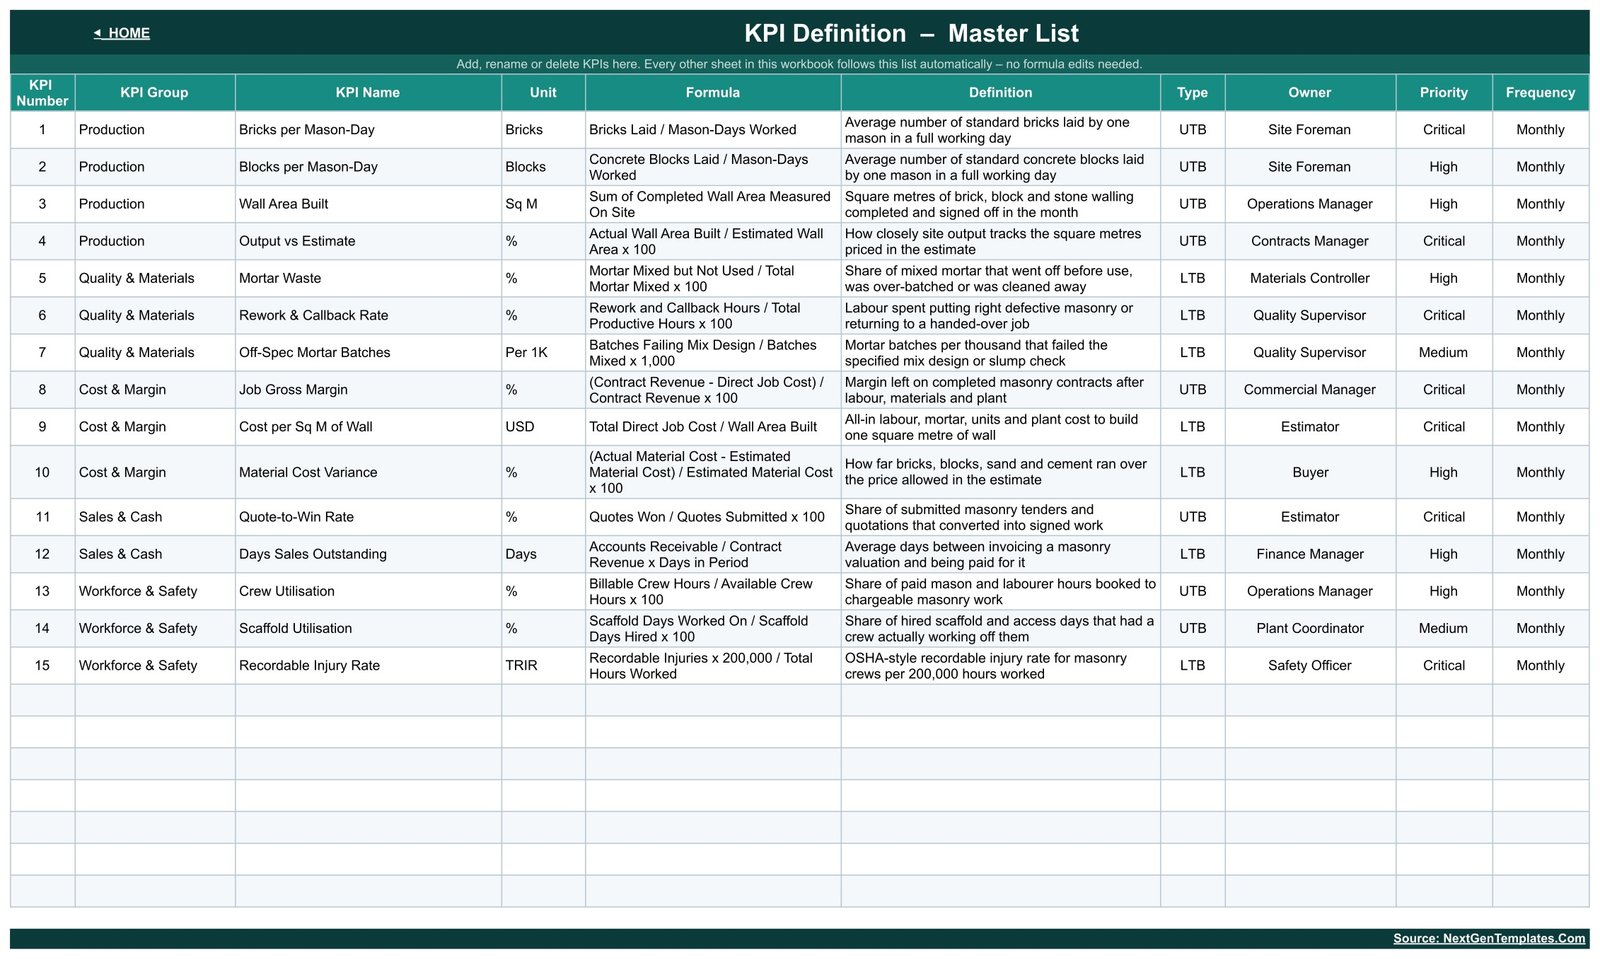
- KPI Definition – the master list: KPI number, group, name, unit, formula, definition, type (UTB/LTB), owner, priority and frequency. Every other sheet follows this list.
- Support – the helper calculations behind the month picker, the chart series and the ranking. Nothing to edit.
- Read Me – how the workbook is wired, including how MTD and YTD are stored and why rates average rather than accumulate.
- Get More Templates – links to the rest of the catalogue.
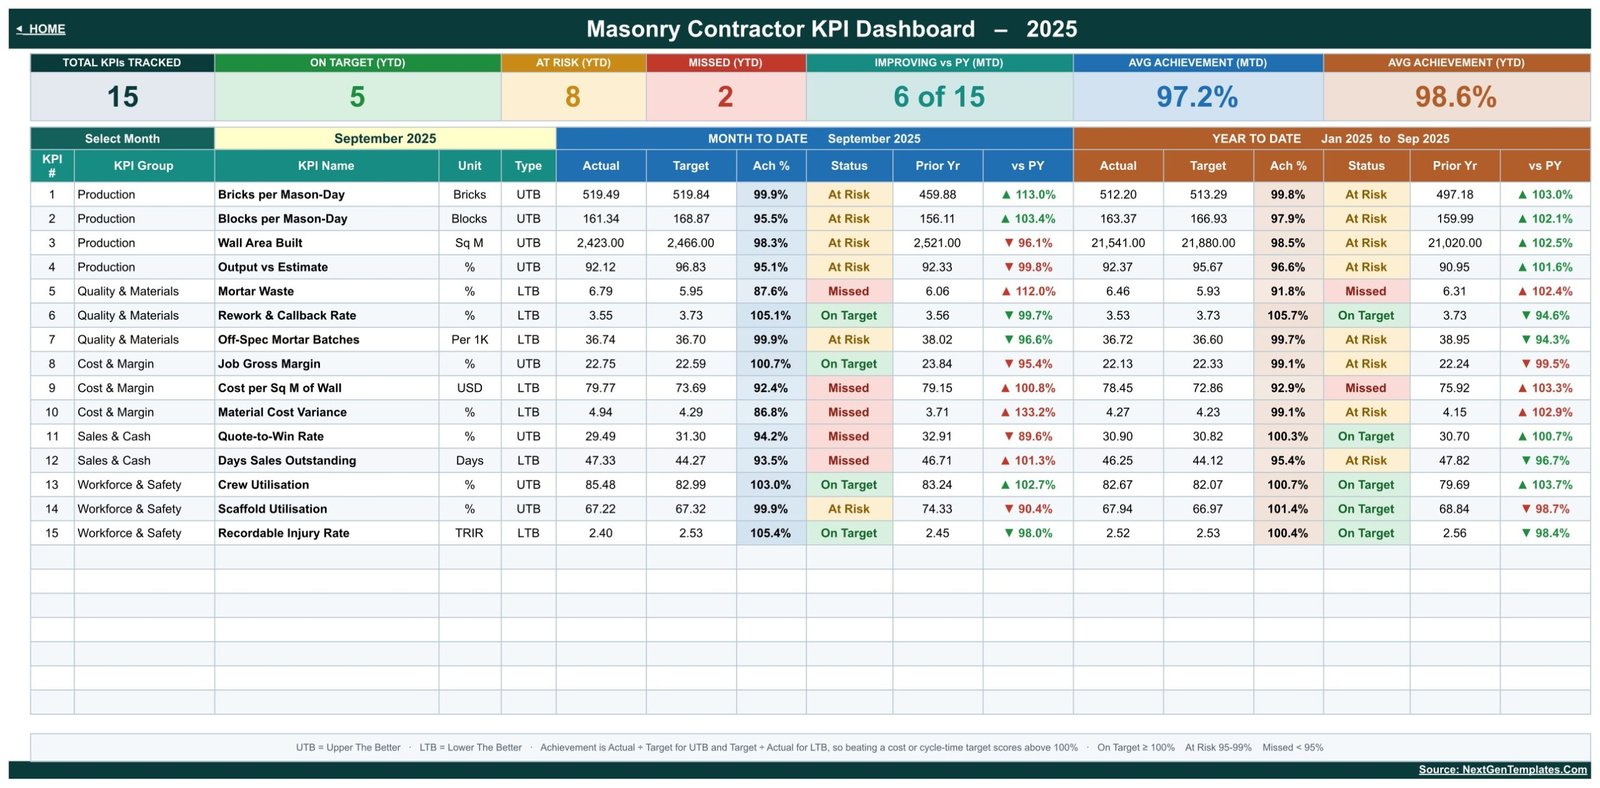
The 15 KPIs, exactly as shipped: Bricks per Mason-Day (Bricks, UTB), Blocks per Mason-Day (Blocks, UTB), Wall Area Built (Sq M, UTB), Output vs Estimate (%, UTB), Mortar Waste (%, LTB), Rework & Callback Rate (%, LTB), Off-Spec Mortar Batches (per 1K, LTB), Job Gross Margin (%, UTB), Cost per Sq M of Wall (USD, LTB), Material Cost Variance (%, LTB), Quote-to-Win Rate (%, UTB), Days Sales Outstanding (Days, LTB), Crew Utilisation (%, UTB), Scaffold Utilisation (%, UTB) and Recordable Injury Rate (TRIR, LTB). Each one carries its own formula, plain-English definition, named owner (Site Foreman, Contracts Manager, Materials Controller, Quality Supervisor, Commercial Manager, Estimator, Buyer, Finance Manager, Operations Manager, Plant Coordinator, Safety Officer) and a Critical / High / Medium priority.
Masonry Contractor KPI Dashboard vs. Excel vs. Paid Construction SaaS – Where This Fits
| This template (Google Sheets) | Excel KPI dashboard | Paid construction management SaaS | |
|---|---|---|---|
| Cost | One-off purchase, lifetime access | One-off purchase, lifetime access | Typically $99-$499 per month |
| Platform | Any browser, Google account | Microsoft Excel on desktop | Vendor cloud plus mobile app |
| Setup time | Minutes – paste your numbers into three input sheets | Minutes | Days to weeks of onboarding |
| Real-time team collaboration | Yes, native to Google Sheets | Only via OneDrive co-authoring | Yes |
| Mobile access | Google Sheets mobile app | Excel mobile app | Yes |
| Customisable KPIs | Yes – 22 KPI rows wired, 15 used, edit on one sheet | Yes | Usually fixed to the vendor’s metric set |
| Share with a link | Yes | File send or cloud link | Per-seat login |
| Year-1 cost at 5 users | The purchase price, once | The purchase price, once | Commonly $5,000+ |
| MTD and YTD side by side | Yes, on every KPI row | Depends on the file | Usually reports, not a single grid |
| Lower-is-better KPIs scored correctly | Yes – UTB/LTB flag per KPI | Depends on the file | Varies |
Who This Template Is For – and Who It’s Not For
A good fit for: owner-operated masonry and bricklaying firms running 5-60 crew; contracts and commercial managers who report monthly to a director; site foremen who want bricks and blocks per mason-day tracked against an estimate; estimators watching quote-to-win and cost per square metre drift; and anyone whose current reporting is a spreadsheet rebuilt from scratch every month.
Not the right fit if: you need job-by-job or per-site reporting – this is a company-level monthly scorecard and does not break down by contract; you want live accounting, ERP or timesheet integrations – all data is typed or pasted in; you need weekly or daily granularity – the shipped cadence is monthly; or you are looking for a health-and-safety recordkeeping system. Recordable Injury Rate is tracked here as a management KPI only. This template is not an OSHA recordkeeping tool, does not maintain 300/300A logs, is not evidence of compliance with any safety standard or regulation, and gives no legal or regulatory advice.
How to Use the Masonry Contractor KPI Dashboard in Google Sheets
- Make your copy. Your download is a PDF that carries the “Make a copy” link. Click it and the file lands in your own Google Drive, fully editable.
- Set the reporting year. Change cell E3 on KPI Input – Actual to your first month. The Target sheet, the Prior Year sheet, the month dropdown and every sheet title re-base automatically.
- Adjust the KPI list if you need to. Rename, remove or add KPIs on KPI Definition – number, group, name, unit, formula, definition, UTB/LTB type, owner, priority, frequency. Every other sheet follows.
- Enter your data. Type your monthly MTD and YTD figures into the yellow cells on the three KPI Input sheets.
- Pick a month. Use the dropdown in cell D6 on KPI Dashboard. The scorecard and the KPI Analysis page both follow it.
- Read the scorecard, then drill in. Scan the seven cards and the traffic lights, open KPI Analysis for the group roll-up and the top and bottom five, then open KPI Trend and pick the KPI you want to see across twelve months.
Real-World Use Cases
Danielle runs a 22-mason bricklaying firm. Her monthly directors’ pack used to be rebuilt by hand. Now she enters one column of numbers, picks the month, and the seven cards tell her the story: in the sample month five KPIs are On Target for the year, eight At Risk and two Missed. She screenshots the scorecard straight into the pack.
Ravi is a contracts manager. He watches Output vs Estimate and Cost per Sq M of Wall. Because both are typed with a direction flag, an over-target cost shows red and an under-target cost shows green – he never has to remember which way a number is supposed to move.
Marta is a quality supervisor. She owns Mortar Waste, Rework & Callback Rate and Off-Spec Mortar Batches on the KPI Definition sheet. She opens KPI Trend, picks Rework & Callback Rate, and sees twelve months against target and last year on one chart before the site meeting.
Frequently Asked Questions
Is this the same as the Masonry Contractor KPI Scorecard in Google Sheets?
No. They are two different templates with similar names. This is the KPI Dashboard: a month-picker scorecard with a traffic-light grid, three separate input sheets and dedicated KPI Trend and KPI Analysis pages. The KPI Scorecard is built differently. Compare the page images on each listing before you buy.
What exactly do I download?
A PDF. It contains the “Make a copy” link for the live Google Sheet, so one click puts an editable copy in your own Google Drive. There is no add-on to install and nothing to enable.
Can I change the KPIs to match my own reporting?
Yes. The sheets are wired for 22 KPIs and 15 are used, so the spare rows are already live. Fill in the next empty row on KPI Definition and the three input sheets pick the name up immediately – no formula work.
How is achievement calculated for a cost or waste KPI?
Each KPI is flagged UTB (upper-the-better) or LTB (lower-the-better). Achievement is Actual ÷ Target for UTB and Target ÷ Actual for LTB, so coming in under a cost target scores above 100%. Seven of the fifteen shipped KPIs are LTB.
Can I change the traffic-light thresholds?
Yes. On Target from 100%, At Risk 95-99% and Missed below 95% are written into the Status formulas on the KPI Dashboard sheet. Edit them there and the summary cards and the KPI Analysis page follow.
Does it track individual jobs or sites?
No. This is a company-level monthly scorecard. There is no per-contract or per-site breakdown, and no timesheet, accounting or ERP connection – you enter or paste the monthly figures yourself.
Does it handle health and safety compliance?
No. Recordable Injury Rate is included as a management KPI so safety sits alongside production and cost. The template does not maintain incident logs or OSHA 300/300A records, is not evidence of compliance with any standard, and is not a substitute for professional safety advice.
About the Author
Built by PK – Microsoft Certified Professional with 15+ years of Excel, Google Sheets, and Power BI experience. Founder of NextGenTemplates, reaching 300K+ subscribers across YouTube channels. Every template is hand-built and tested before release.
Explore Related Templates
- Masonry Contractor KPI Dashboard in Excel – the same scorecard built as an Excel workbook.
- Masonry Contractor KPI Dashboard in Power BI – the Power BI edition for teams already on Fabric.
- Masonry Contractor KPI Scorecard in Google Sheets – a different masonry template, not a duplicate.
- Painting Contractor KPI Dashboard in Google Sheets and Roofing Contractor KPI Dashboard in Google Sheets – the same build for neighbouring trades.
- Browse every Google Sheets KPI Dashboard or the whole Google Sheets category.
Get the Masonry Contractor KPI Dashboard in Google Sheets today. Instant download, lifetime access, free bug fixes, and sample data already inside so you can see every formula working before you replace a single number.
Watch the step-by-step video Demo:
Last updated: 1 September 2026.
Compatibility and Requirements
- Works in Google Sheets. You need a free Google account and a web browser.
- You pick the reporting month from a dropdown in cell D6 on the KPI Dashboard sheet, and the KPI Trend page has a KPI dropdown. Google explains dropdowns in Create an in-cell dropdown list.
- The workbook uses plain worksheet formulas only: no Apps Script, macros or add-ons.































Reviews
There are no reviews yet.