

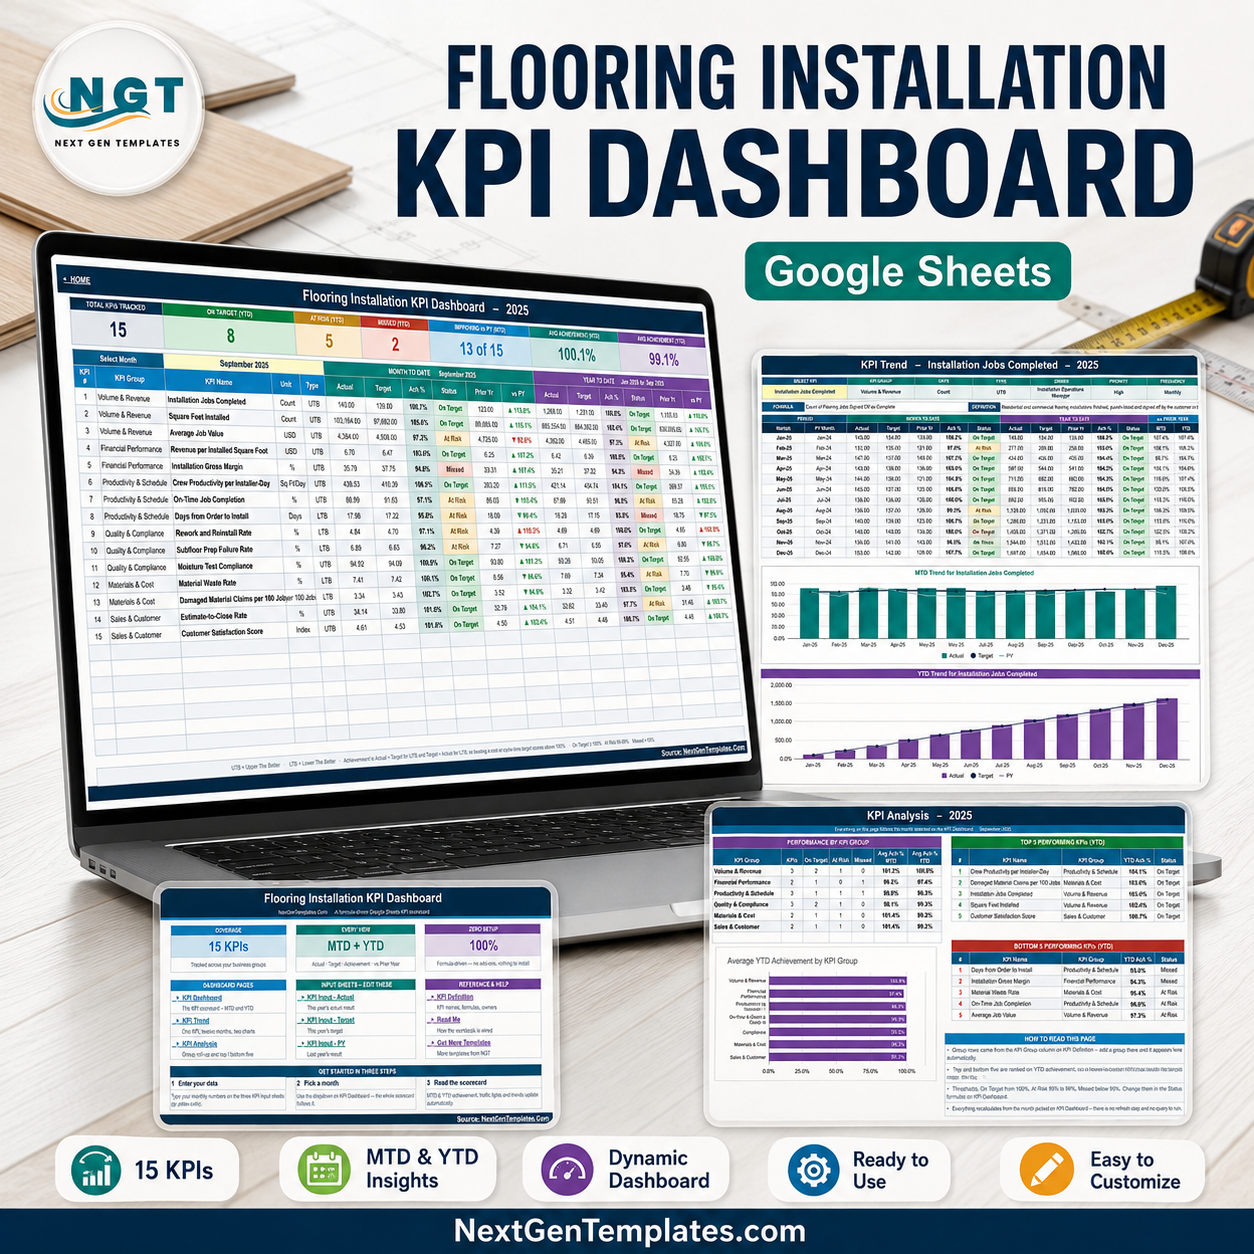

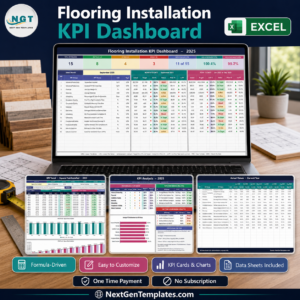
The Flooring Installation KPI Dashboard in Google Sheets tracks 15 flooring installation KPIs across 6 groups on one scorecard, with month-to-date and year-to-date side by side, traffic-light status on every row and a comparison against last year. Pick a month from one dropdown and the whole workbook re-calculates. It is 100% formula-driven, so there is nothing to install, no add-on, no Apps Script and no refresh button. One-time payment of $8.99 (regular $13.99), instant download, lifetime access, no per-user fee. The six page images below are screenshots of the actual file, so you can see every KPI, formula and threshold before you buy.
Key Features of the Flooring Installation KPI Dashboard in Google Sheets
- 15 flooring KPIs in 6 groups – Volume & Revenue (3), Financial Performance (2), Productivity & Schedule (3), Quality & Compliance (3), Materials & Cost (2) and Sales & Customer (2).
- One month dropdown drives everything – the sample file opens on September 2025; change it and the scorecard, the KPI Trend page and the KPI Analysis page all follow.
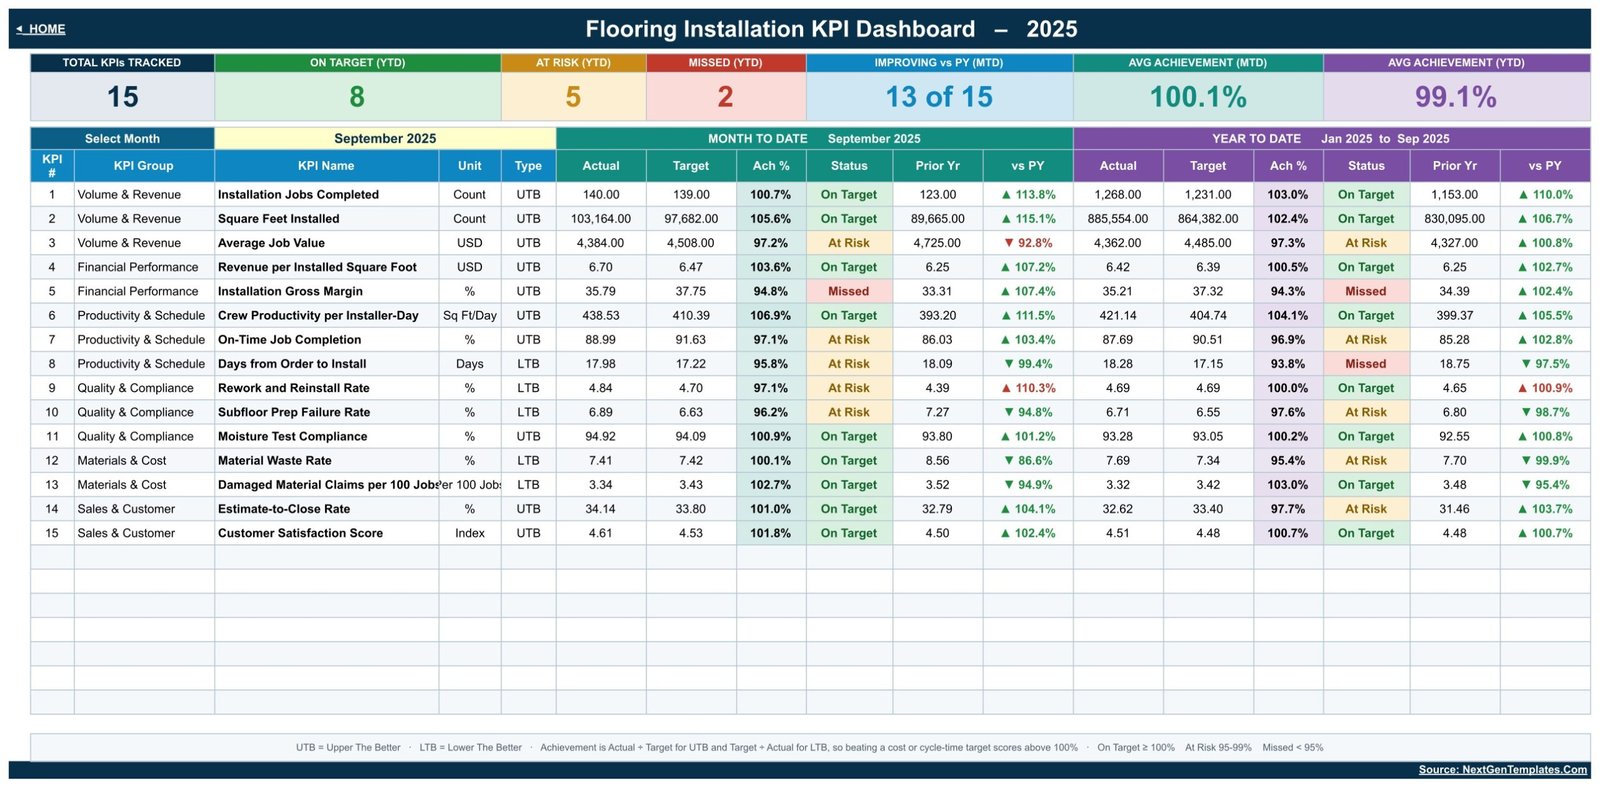
- MTD and YTD in the same row – each KPI shows Actual, Target, Achievement %, Status, Prior Year and a vs PY arrow, twice: once for the month, once for the year to date.
- Direction-aware scoring – every KPI is flagged UTB (upper the better) or LTB (lower the better). Achievement is Actual / Target for UTB and Target / Actual for LTB, so beating a waste, lead-time or rework target correctly scores above 100%.
- Traffic lights with published thresholds – On Target from 100%, At Risk 95% to 99%, Missed below 95%. The thresholds sit in the Status formulas, so you can move them.
- Seven header cards – Total KPIs Tracked, On Target, At Risk, Missed, Improving vs PY, Average Achievement MTD and Average Achievement YTD, all recalculated from the rows beneath.
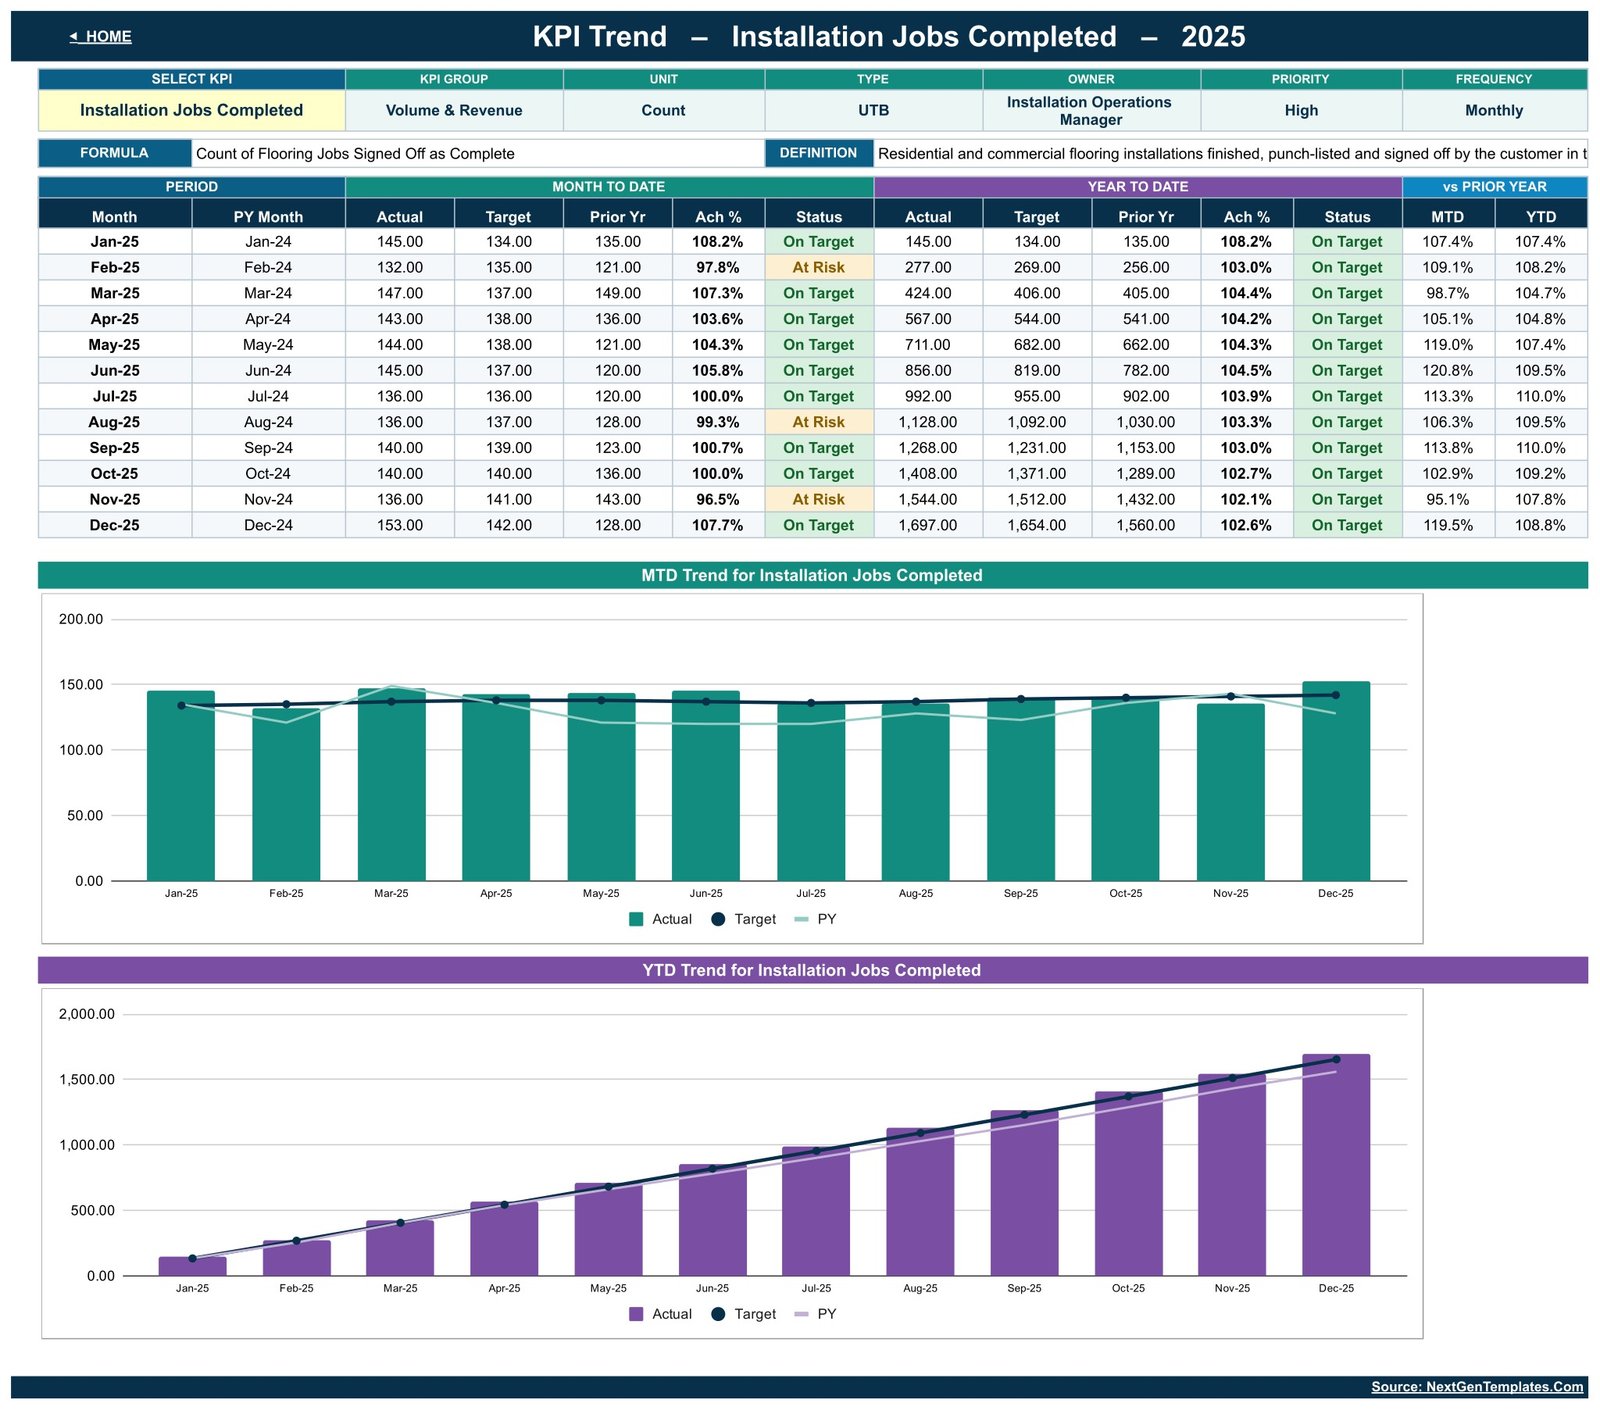
- KPI Trend page – pick any one KPI and see twelve months of MTD and YTD actual, target and prior year, plus two charts against target and last year.
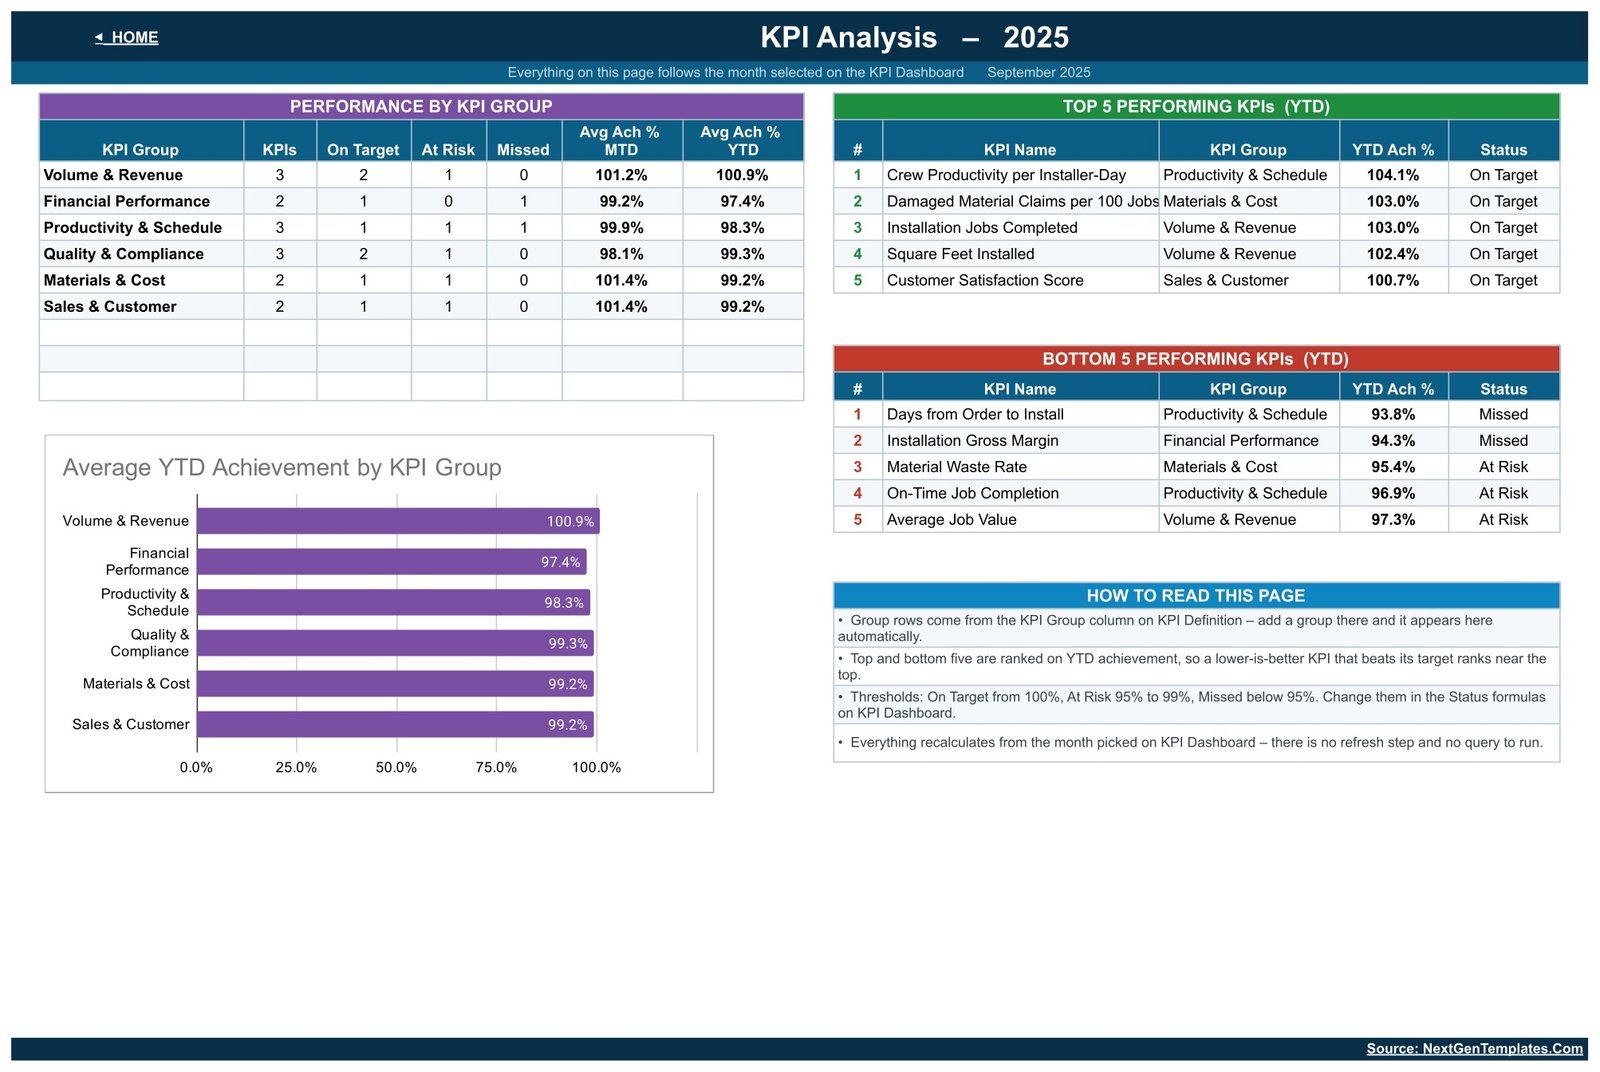
- KPI Analysis page – performance by KPI group, an average YTD achievement bar chart, and Top 5 / Bottom 5 performing KPIs ranked on YTD achievement.
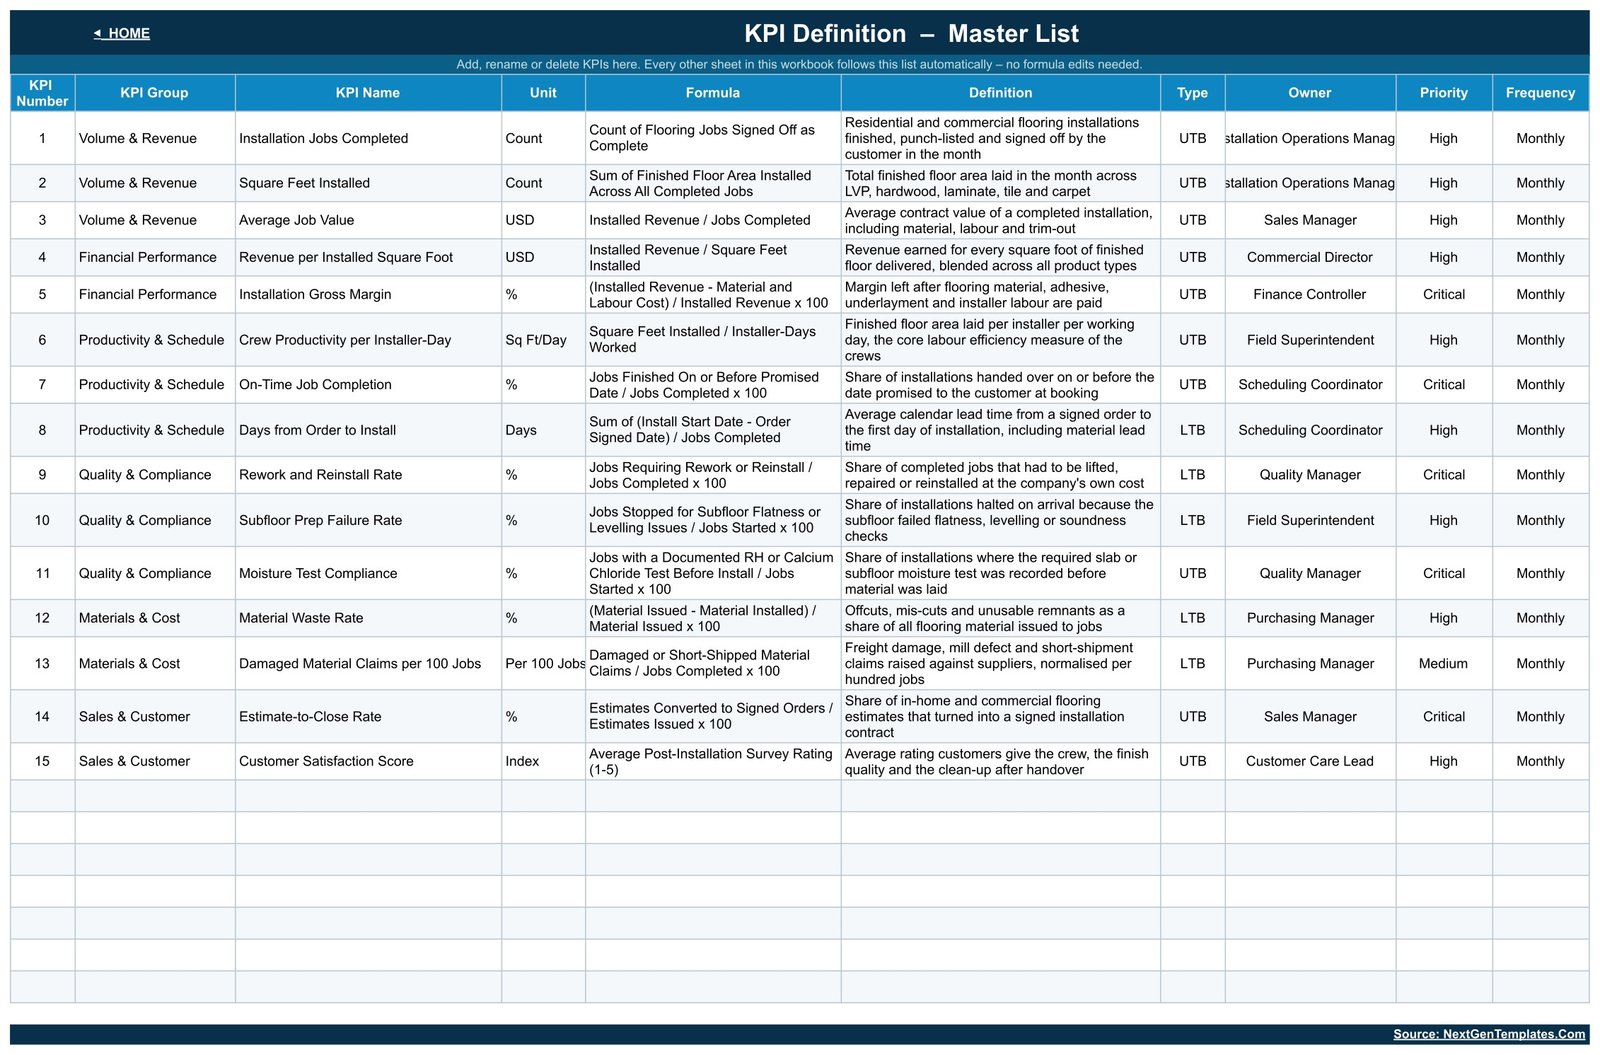
- The KPI list is data, not formulas – add, rename or delete a KPI on the KPI Definition sheet and every other sheet follows it. You never edit a formula to change the scorecard.
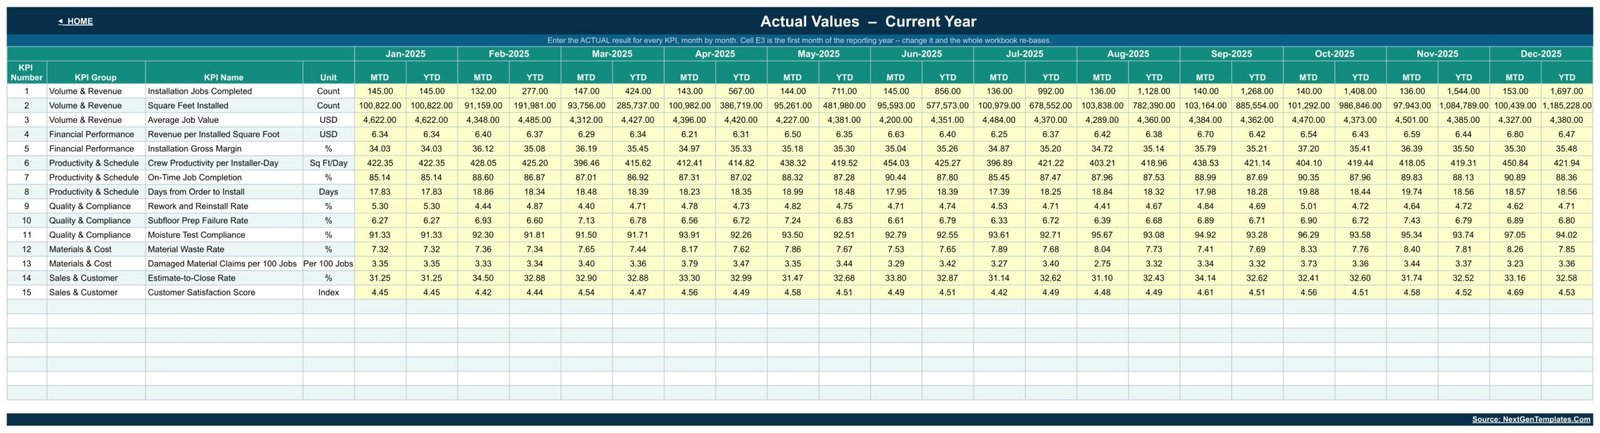
- Three yellow input sheets – Actual, Target and Prior Year, one row per KPI and one column pair per month. That is the only typing you do.
What’s Inside the Flooring Installation KPI Dashboard in Google Sheets
Ten tabs, linked from a Home page:
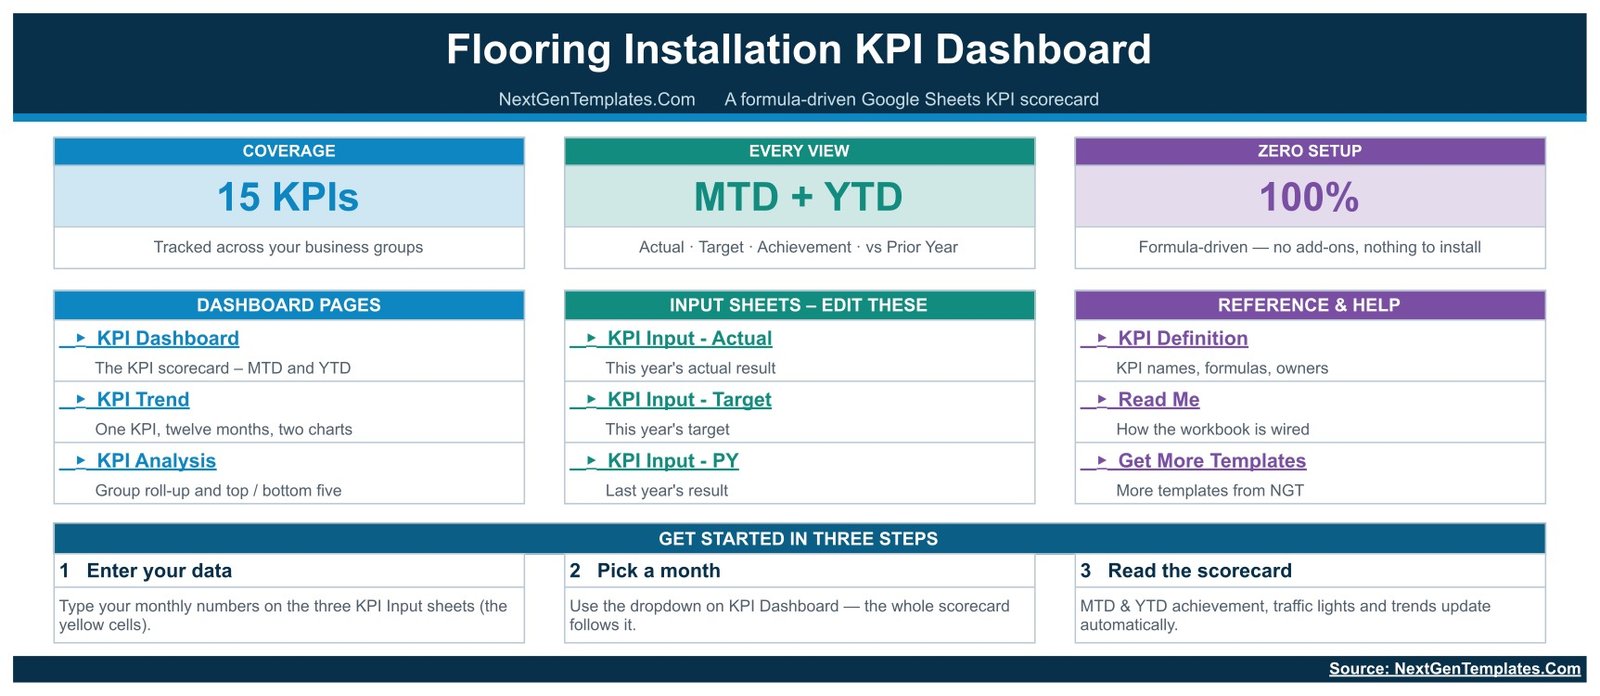
- Home – the launch page, with links to every sheet and a three-step start guide.
- KPI Dashboard – the scorecard. Month picker, seven header cards and all 15 KPIs with MTD and YTD blocks.
- KPI Trend – one KPI, twelve months, an MTD column chart and a YTD column chart, each with target and prior-year lines. The header restates that KPI’s group, unit, type, owner, priority, frequency, formula and definition.
- KPI Analysis – group roll-up (KPI count, On Target / At Risk / Missed counts, average MTD and YTD achievement), the average YTD achievement chart and the Top 5 / Bottom 5 tables.
- KPI Input – Actual, KPI Input – Target, KPI Input – PY – the three yellow entry sheets. Cell E3 on the Actual sheet is the first month of the reporting year; change it and the whole workbook re-bases to your fiscal calendar.
- KPI Definition – the master list: KPI number, group, name, unit, formula, definition, UTB/LTB type, owner, priority and frequency. This sheet is the single source of truth.
- Read Me – how the workbook is wired.
- Get More Templates – links to the rest of the NextGenTemplates catalogue.
The 15 KPIs shipped in the file are: Installation Jobs Completed, Square Feet Installed, Average Job Value, Revenue per Installed Square Foot, Installation Gross Margin, Crew Productivity per Installer-Day, On-Time Job Completion, Days from Order to Install, Rework and Reinstall Rate, Subfloor Prep Failure Rate, Moisture Test Compliance, Material Waste Rate, Damaged Material Claims per 100 Jobs, Estimate-to-Close Rate and Customer Satisfaction Score. Each one carries an owner – Installation Operations Manager, Field Superintendent, Scheduling Coordinator, Quality Manager, Purchasing Manager, Sales Manager, Commercial Director, Finance Controller or Customer Care Lead – so the review meeting has a name against every red light.
Google Sheets vs. Excel vs. Paid Field-Service SaaS – Where This Fits
| This template (Google Sheets) | Excel / Power BI version | Paid SaaS (Jobber, ServiceTitan) | |
|---|---|---|---|
| Cost | $8.99 one-time | $12.99 one-time | $49-$399 per user, per month |
| Platform | Google Sheets, any browser | Excel desktop / Power BI Desktop | Vendor cloud |
| Setup time | Under 15 minutes | Under 15 minutes | Days to weeks, often with onboarding fees |
| Real-time team collaboration | Yes, native | Only via OneDrive co-authoring | Yes |
| Mobile access | Yes, Google Sheets app | Limited | Yes |
| Customisable KPI list | Yes – edit the KPI Definition sheet | Yes | Usually fixed to the vendor’s metric set |
| Share with a link | Yes | No | Seat-based |
| Year-1 cost at 5 users | $8.99 | $12.99 | $2,940-$23,940 |
| Job scheduling and dispatch | No | No | Yes |
| Owns your data | You do, in your Drive | You do, on your disk | Vendor |
This is a measurement layer, not an operating system for the business. If you already run jobs through a field-service platform, this is the monthly scorecard you take into the management meeting. If you run jobs on paper and a calendar, it is the fastest way to start measuring.
Who This Template Is For – and Who It’s Not For
It fits a residential or commercial flooring contractor with two to fifty installers who already knows their monthly totals – jobs closed, square feet laid, revenue, material issued, rework, callbacks – and wants them scored against target and last year in one place. It fits an operations manager who reports to an owner monthly, a franchise reporting into a group, and a finance controller who wants margin and waste next to volume rather than in a separate file.
It does not fit if you want the numbers to arrive by themselves. This is a typed-input scorecard: there is no connector to QuickBooks, Jobber, ServiceTitan, RFMS or an ERP, and no import step. It is also not a job costing system, an estimating tool, a crew scheduler or an invoicing package – there are no per-job records anywhere in the file, only monthly totals. If you need to see a single job’s margin, this is the wrong template. And if you need more than one reporting year live at once, you will keep one copy per year: the three input sheets hold twelve months each.
How to Use the Flooring Installation KPI Dashboard in Google Sheets
- Make your copy. The PDF in your download carries the Google Sheets “Make a copy” link. Click it and the workbook lands in your own Drive – you own the copy outright.
- Set your reporting year. Open KPI Input – Actual and change cell E3 to the first month of your fiscal year. Every month header, every YTD roll-up and both trend charts re-base to it.
- Edit the KPI list if you need to. On KPI Definition, rename a KPI, change its group, unit, owner or – importantly – its UTB/LTB type. Everything downstream follows automatically.
- Type your numbers. Fill the yellow cells on KPI Input – Actual, KPI Input – Target and KPI Input – PY, one row per KPI, one column per month. Replace the 2025 sample data as you go.
- Pick a month. Use the dropdown on KPI Dashboard. The seven header cards, all 15 rows, the trend page and the analysis page recalculate instantly.
- Run the review. Start on KPI Analysis – the Bottom 5 table tells you what to talk about – then drill into KPI Trend for the KPI in question to see whether it is a bad month or a bad trend.
Real-World Use Cases
Marcus runs a 14-installer residential flooring company. In the sample September, 140 jobs were completed against a target of 139 and 103,164 square feet were laid against 97,682 – both green. But Installation Gross Margin came in at 35.79% against a 37.75% target: 94.8%, Missed. One glance at the scorecard tells him the shop is busy and the margin is leaking, which is a very different conversation from “we had a good month.”
Priya is the scheduling coordinator for a commercial flooring subcontractor. She owns two KPIs: On-Time Job Completion and Days from Order to Install. Days from Order to Install is LTB, so her 17.98 days against a 17.22-day target scores 95.8% – At Risk, not “we beat it because the number went down.” Year to date it sits at 93.8%, the worst KPI in the Bottom 5 table, which is exactly the evidence she needs to argue for earlier material ordering.
Dan is a finance controller in a three-branch flooring group. He keeps one copy of the file per branch, changes nothing but the input sheets, and compares the Average Achievement (YTD) card across the three. In the sample data that card reads 99.1% with 8 KPIs On Target, 5 At Risk and 2 Missed – a single line he can put in the board pack.
Frequently Asked Questions
Is this the same as the Flooring Installation KPI Scorecard?
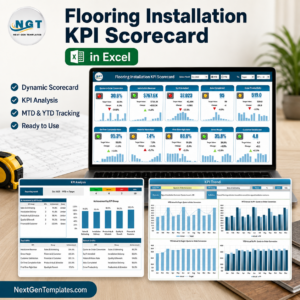
No. This is the KPI Dashboard line: a month picker, MTD and YTD blocks on every row, a dedicated KPI Trend page and a KPI Analysis page with group roll-ups and Top 5 / Bottom 5 tables. The Flooring Installation KPI Scorecard in Google Sheets is a different, simpler product – a card-based single-page scorecard. Some buyers own both; most only need one.
Do I need Excel or a paid Google Workspace plan?
Neither. A free Google account is enough. The workbook uses only standard spreadsheet functions – no add-ons, no Apps Script, no macros, nothing to install or authorise.
Can I add my own KPIs or remove the ones I don’t use?
Yes, and that is the point of the design. The KPI Definition sheet is the master list; add a row, rename one, or change a group and the dashboard, trend page, analysis page and all three input sheets follow it. You never touch a formula.
How does the achievement percentage handle “lower is better” KPIs?
Each KPI is marked UTB or LTB on the KPI Definition sheet. Achievement is Actual / Target for UTB and Target / Actual for LTB. So Material Waste Rate at 7.41% against a 7.42% target scores 100.1% and shows green, while Days from Order to Install at 17.98 against 17.22 scores 95.8% and shows amber. Rising cost, waste and cycle-time numbers are never rewarded.
Does it connect to my job management software or accounting system?
No. It is a typed-input scorecard by design – you enter monthly totals on the three input sheets. There is no connector to QuickBooks, Jobber, ServiceTitan or an ERP, and no import or refresh step. That is also why there is nothing to break.
What is in the download?
A PDF that contains the “Make a copy” link to the Google Sheet, plus a short guide. Click the link and a fully editable copy is created in your own Google Drive. Nothing is shared, nothing expires, and no one else can see your data.
Can more than one person use it at once?
Yes. It is a normal Google Sheet, so share it with your team, set edit or view rights per person, and everyone sees the same numbers live. Your licence covers your business – just don’t resell or redistribute the file.
About the Author
Built by PK – Microsoft Certified Professional with 15+ years of Excel, Google Sheets, and Power BI experience. Founder of NextGenTemplates, reaching 300K+ subscribers across YouTube channels. Every template is hand-built and tested before release.
Explore Related Templates
Same dashboard, other tools: Flooring Installation KPI Dashboard in Excel and Flooring Installation KPI Dashboard in Power BI – identical 15-KPI structure, built for Excel and Power BI Desktop instead.
Related but different: Flooring Installation KPI Scorecard in Google Sheets and Flooring Installation KPI Scorecard in Excel – the simpler single-page card layout.
Other trades on the same KPI dashboard engine: Roofing Contractor KPI Dashboard in Google Sheets, Electrical Contractor KPI Dashboard in Google Sheets and Plumbing Business KPI Dashboard in Google Sheets.
Running the whole business, not just the numbers? See the Carpet and Flooring Business Management System Web App. Or browse the full Google Sheets KPI Dashboard category and every Google Sheets template.
Get the Flooring Installation KPI Dashboard in Google Sheets for $8.99 (regular $13.99) – instant download, lifetime access, free bug fixes, no subscription. Add it to your cart and you can be looking at your own numbers inside fifteen minutes.
Watch the step-by-step video Demo:
Last updated: 1 September 2026.































Reviews
There are no reviews yet.