

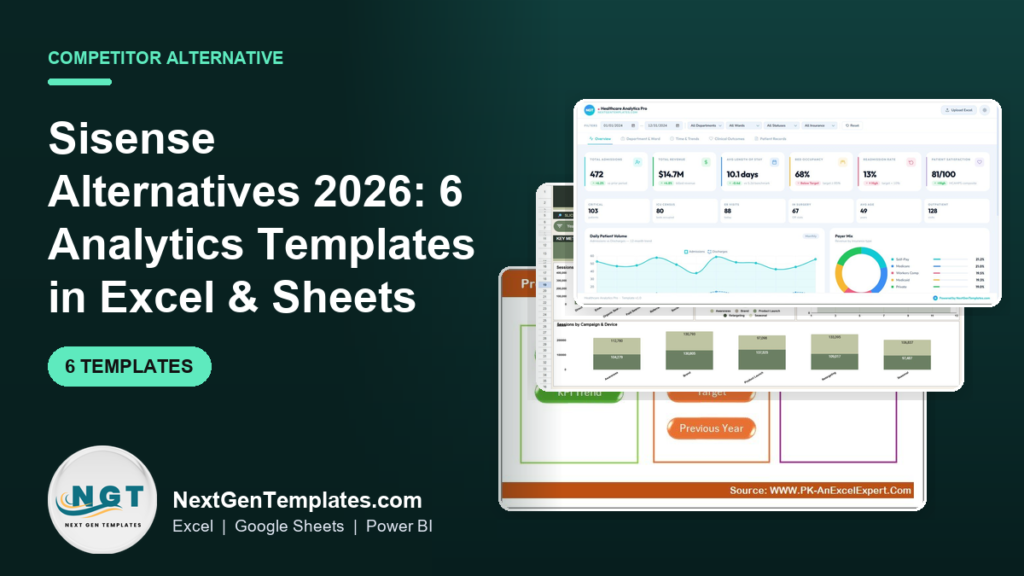
The best Sisense alternative dashboard for a small team is a one-time analytics template you own outright instead of a quote-only embedded analytics contract. Our top pick is the Healthcare Analytics Dashboard in HTML ($14.99), the only format here you can embed straight into your own web page.
Last updated: August 2026
Related guides: Comparing more than one platform? See our Qlik Sense alternatives: 8 BI templates in Excel & Sheets and Tableau alternatives: 8 BI & analytics templates.
Key takeaways
- Sisense publishes no list pricing at all – the official pricing page shows two tiers, Enterprise and Self-Serve, with zero dollar figures and a “contact us” button.
- Third-party contract trackers put self-hosted Sisense at roughly $10,000+ a year for five users, cloud at $21,000+, entry contracts near $25,000, and Vendr’s published average around $137,000 a year.
- All 6 templates in this guide are one-time purchases between $9.99 and $14.99 – no seats, no renewal, no negotiation.
- Best overall is the Healthcare Analytics Dashboard in HTML ($14.99) because it is genuinely embeddable; best value is the Data Analytics Dashboard in Google Sheets ($9.99).
- Sisense still wins on governed multi-tenant embedding, live warehouse queries and enterprise security – we say exactly when to stay, in its own section below.
 Launch offer
SUMIFS, XLOOKUP, FILTER, LAMBDA and checking AI-written formulas, with real business projects. 11h 47m of video by PK, with practice files, quizzes and a capstone.
How much does Sisense actually cost in 2026?
Here is the honest answer, and it matters more than any feature comparison: nobody outside Sisense’s sales team can tell you your price. The official Sisense pricing page lists two options – an Enterprise plan “built to your specifications” behind a contact form, and a Self-Serve trial – and publishes no dollar figures whatsoever. Anyone quoting you a confident single Sisense price is guessing.
What we can do is report what third parties who track real signed contracts consistently say. Independent pricing round-ups and buyer-data platforms put a self-hosted Sisense deployment at around $10,000 per year for five users at the low end, and a cloud deployment at around $21,000 per year for the same five users. Entry-level contracts are widely reported to land near $25,000 a year. Mid-market SaaS companies embedding Sisense into a product routinely report $100,000-$150,000 annually, and Vendr’s published average across its buyer base sits near $137,000 a year. Treat all of those as ranges, not quotes – and get your own quote before you budget.
Three reasons small teams churn off Sisense, in the order we hear them:
1. The seat and capacity cost compounds. Sisense is priced by a combination of users, data volume and deployment model, so the bill grows when your data grows even if your headcount does not. A five-figure renewal that arrives every year regardless of how much of the platform you used is a hard line item to defend in a small company.
2. You pay for modules you never open. Sisense sells a full stack – the Elasticube data engine, live warehouse connections, embedded SDKs, white-labelling, row-level security, AI/analytics add-ons. Reviewers repeatedly flag that AI features and premium connectors add roughly 20-30% on top of the base contract. Most teams that churn were using a handful of KPI charts and one export.
3. Admin overhead. Somebody has to model the Elasticube, maintain the connectors, manage upgrades and re-cut dashboards when a field changes. That is a part-time data engineer at minimum. For a team of five, the internal cost of running the platform can exceed the licence.
A one-time template inverts all three. You pay once, you own the file, every formula is visible, and there is no platform to administer. The trade-off is real and we cover it honestly further down – but for teams under roughly fifteen people, the arithmetic is not close.
Sisense vs the NGT template that covers it
Head-to-head. On the left, the job you are paying Sisense to do; in the middle, the NextGenTemplates file that covers that same job; on the right, what it costs you once.
| What Sisense charges for | NGT template that covers it | One-time price |
|---|---|---|
| Embedded analytics inside your own web page or portal | Healthcare Analytics Dashboard in HTML | $14.99 |
| Self-service cloud dashboards on a shared link | Data Analytics Dashboard in Google Sheets | $9.99 |
| Executive / stakeholder reporting packs | Project Management Stakeholder Reporting KPI Dashboard in Excel | $12.99 |
| Governed, refreshable reporting with row-level filters | Regulatory Reporting KPI Dashboard in Power BI | $11.99 |
| Ops and infrastructure monitoring dashboards | IT and Tech Stakeholder Reporting KPI Dashboard in Excel | $12.99 |
| Retail / e-commerce performance analytics | Retail and E-commerce Stakeholder Reporting KPI Dashboard in Excel | $12.99 |
| Elasticube data modelling & live warehouse queries | Not covered – see “when Sisense is still the right call” | — |
| Multi-tenant white-label embedding with per-customer security | Not covered – stay on Sisense | — |
Sisense alternative dashboard templates compared
Every template in this guide side by side. One row is flagged best overall and one best value.
| Template | Format | Best for | Price |
|---|---|---|---|
| Healthcare Analytics Dashboard (Best overall) | HTML | Embedding analytics in your own page or portal | $14.99 |
| Data Analytics Dashboard (Best value) | Google Sheets | Cloud self-service analytics on a shared link | $9.99 |
| Project Management Stakeholder Reporting KPI Dashboard | Excel | Board and client reporting packs | $12.99 |
| Regulatory Reporting KPI Dashboard | Power BI | Governed, auditable, refreshable reporting | $11.99 |
| IT and Tech Stakeholder Reporting KPI Dashboard | Excel | Uptime, incident and delivery metrics | $12.99 |
| Retail and E-commerce Stakeholder Reporting KPI Dashboard | Excel | Revenue, channel and conversion analytics | $12.99 |
How we picked these
We searched the NextGenTemplates catalogue of roughly 6,900 published products for analytics, reporting and KPI dashboards across HTML, Excel, Google Sheets and Power BI, then filtered to the ones that reproduce what small teams actually use Sisense for: an embeddable analytics view, self-service dashboards a non-analyst can read, and repeatable stakeholder reporting. We deliberately kept the list to six rather than padding it to eight – a Sisense buyer is evaluating a platform, not browsing, and six well-matched files beat eight loose ones. We excluded free downloads, anything with locked or hidden logic, and single-purpose trackers with no analytical layer. Every template below is paid, one-time, and editable so you can point it at your own metrics.
The 6 best Sisense alternative templates for 2026
1. Healthcare Analytics Dashboard in HTML – best overall

This is our #1 for one specific reason: embedding is Sisense’s headline feature, and HTML is the only format in this list you can genuinely embed. Drop the file on your own server or into an iframe and your customers, clients or internal portal users get an analytics screen inside your product – the job Sisense sells five- and six-figure contracts to do.
Who it is for: a product team, agency or clinic group that needs a self-contained analytics view inside a web page, without an embedded-analytics licence or an SDK integration project.
What is inside:
- Tabbed analytics: Overview, Department & Ward, Time & Trends, Clinical Outcomes and a Patient Records table
- KPI header with admissions, revenue, average length of stay, bed occupancy, readmission rate and satisfaction score, each with a trend delta and target flag
- Filter bar for date range, department, ward and insurance type, with a one-click reset
- Daily patient-volume trend line and a payer-mix donut that recalculate as filters change
- An Excel upload control so you replace the demo data with your own without touching code
Because it runs client-side, there is no server to license, no per-viewer charge and no renewal – the exact three costs that make embedded analytics expensive. Healthcare is the shipped data model, but the structure (KPI header, filter bar, tabbed drilldowns, records table) is generic enough to re-label for any operational domain. For the wider clinical range see our healthcare and hospital management templates.
Best for: replacing Sisense’s embedded analytics use case outright. $14.99 – view the template.
2. Data Analytics Dashboard in Google Sheets – best value
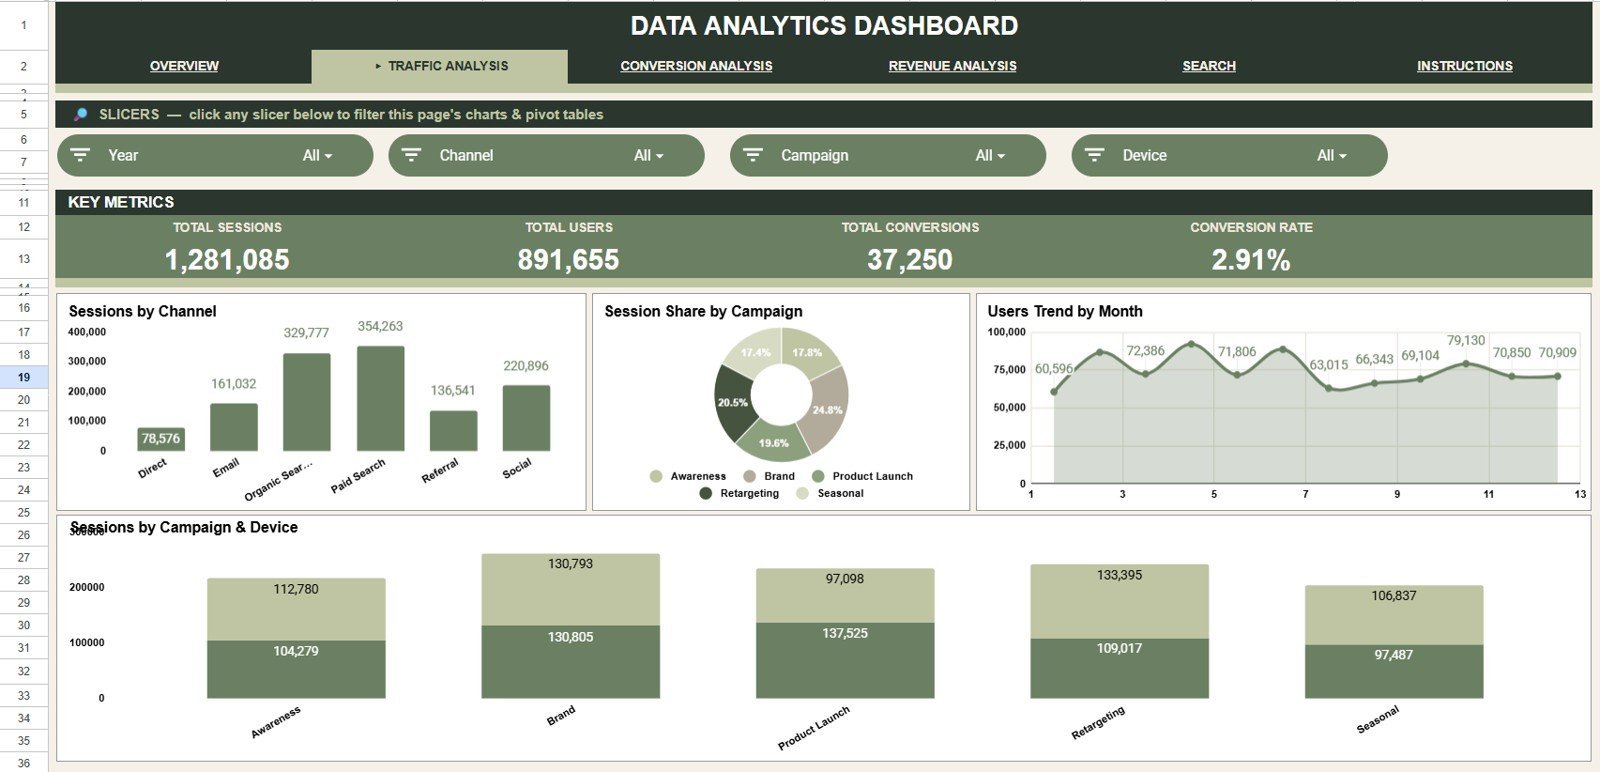
The single cheapest way to prove you do not need a BI platform. This is a general-purpose analytics dashboard – sessions, campaigns, channels, devices and conversion – built entirely in Google Sheets, so it runs on a free Google account and shares as a link.
Who it is for: a marketing, growth or ops team that wants Sisense-style self-service dashboards without asking anyone for a seat, and without a data engineer in the loop.
What is inside:
- Sessions-by-campaign-and-device analysis across awareness, brand, product-launch, retargeting and seasonal campaign types
- KPI cards with period-over-period movement and target comparison
- Trend and breakdown tabs driven by ordinary, visible spreadsheet formulas
- Cloud sharing with per-person edit or view-only rights, and full revision history
At $9.99 it costs roughly one four-thousandth of a typical entry Sisense contract, and the switching friction is close to zero: paste your export into the input tab, send the link. Revision history gives you a rough audit trail for free. If your stack is Google-first, pair it with our Looker Studio alternatives in Google Sheets.
Best for: the cheapest, fastest exit from a BI subscription. $9.99 – view the template.
3. Project Management Stakeholder Reporting KPI Dashboard in Excel
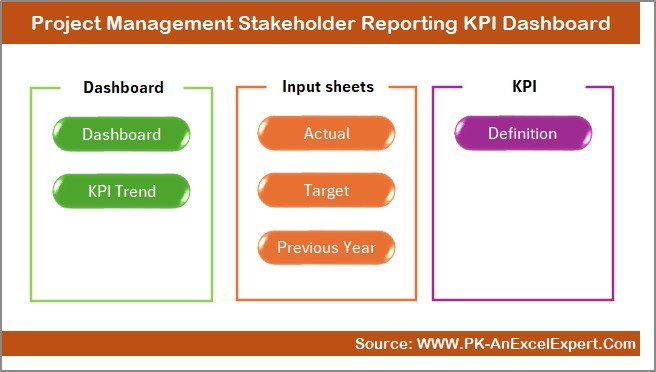
A large share of what Sisense actually produces in practice is a recurring report for people who are not analysts: a steering committee, a client, a board. This Excel dashboard is built for exactly that hand-off.
Who it is for: a PMO, delivery lead or consultancy that has to publish the same status pack every month and wants it to take twenty minutes rather than two days.
What is inside:
- Actual-vs-target input model with traffic-light status on every KPI
- Dashboard, KPI Trend and KPI Definition tabs, so stakeholders can see how each metric is calculated
- Schedule, cost, scope and risk indicators in one printable view
- Charts that redraw the moment a number changes – no pivot refresh, no data model
The KPI Definition tab matters more than it sounds. Half the arguments in a stakeholder meeting are about what a number means, and a platform dashboard rarely carries the definition next to the metric. Practically: enter this month’s actuals, export to PDF, send. A team producing a monthly pack for four clients saves the best part of a working day every cycle. For the wider set, see our Smartsheet alternatives in Excel and Google Sheets.
Best for: recurring board and client reporting packs. $12.99 – view the template.
4. Regulatory Reporting KPI Dashboard in Power BI
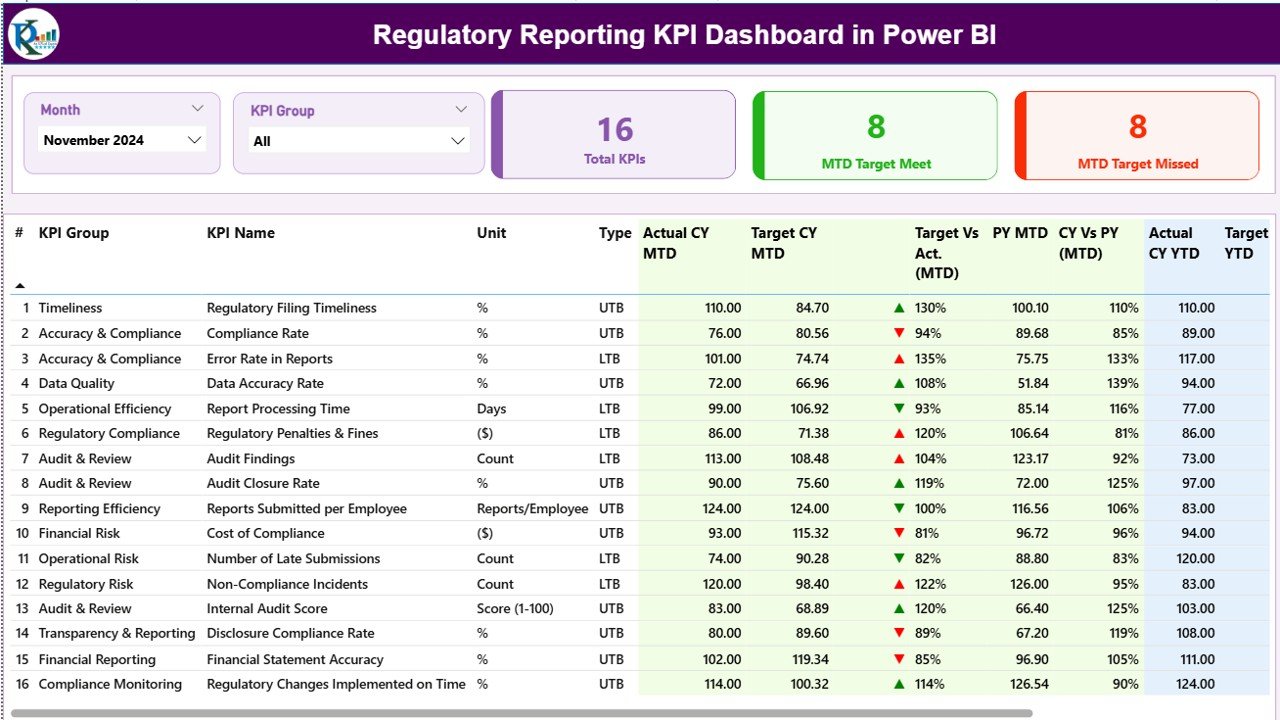
If you are leaving Sisense but cannot lose governance, this is the landing spot. Power BI gives you a real semantic model, scheduled refresh and organisational sharing – the parts of a BI platform that a spreadsheet honestly cannot replicate – and this template ships the model already built.
Who it is for: finance, compliance and risk teams in regulated sectors who need an auditable, repeatable reporting pipeline rather than a file someone edits by hand.
What is inside:
- Semantic model with a date table and pre-written DAX measures for compliance rates, breaches, overdue items and submission timeliness
- Slicers for period, entity, regulation type and status, synced across pages
- KPI cards with period-over-period deltas and RAG thresholds
- Drill-through detail pages so any figure in the summary can be traced to its underlying rows
Traceability from a headline number down to source rows is the specific thing auditors ask for, and it is the reason we did not put a spreadsheet in this slot. If your organisation already has Microsoft 365, viewing costs you nothing extra internally. Compare the wider set in our Power BI dashboard templates ranked by industry.
Best for: governed, auditable reporting after a BI platform exit. $11.99 – view the template.
5. IT and Tech Stakeholder Reporting KPI Dashboard in Excel
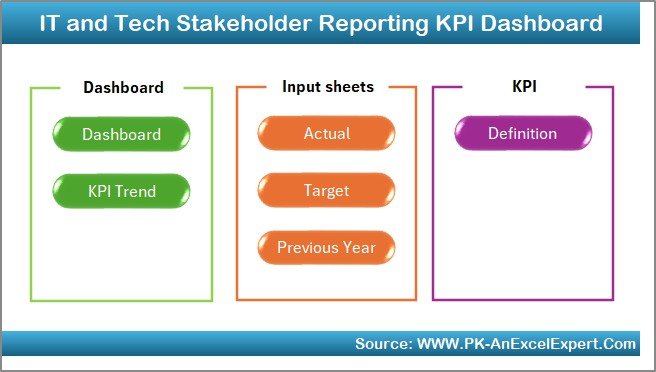
Engineering and IT teams are often the ones who inherited the Sisense contract and are now asked to justify it. This dashboard covers the metrics those teams actually report upward, in a file no one needs a licence to open.
Who it is for: an IT manager, CTO or platform lead reporting uptime, incidents and delivery throughput to a leadership team.
What is inside:
- Actual-vs-target tracking for uptime, incident volume, mean time to resolve, ticket backlog and change success rate
- KPI Trend tab showing twelve months of movement per metric
- Traffic-light conditional formatting that flags a metric the moment it crosses its threshold
- Definition tab documenting each metric’s formula and data source
The practical win is speed of assembly. Pulling MTTR and uptime out of a ticketing export and into a leadership-ready page is a twenty-minute job here, against a modelling exercise on a BI platform. Run it monthly for a steering group, quarterly for a board, or weekly during an incident-heavy period. Teams migrating off a wider enterprise suite should also read our Oracle Fusion alternatives in Excel.
Best for: IT and engineering metrics reported upward. $12.99 – view the template.
6. Retail and E-commerce Stakeholder Reporting KPI Dashboard in Excel
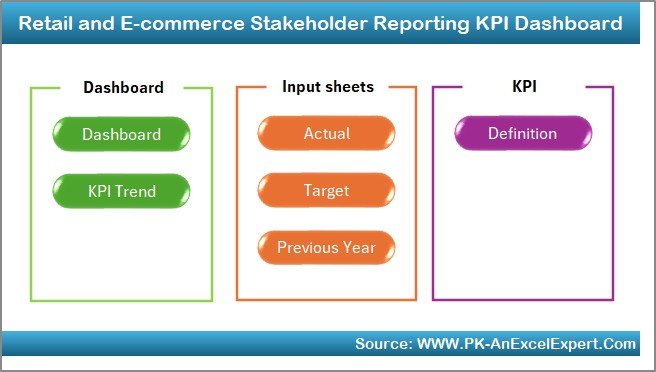
Retail and e-commerce is where Sisense contracts get expensive fastest, because order and event data volume drives the bill. This template covers the commercial reporting layer without any relationship between your row count and your cost.
Who it is for: a retail operator, D2C brand or marketplace seller reporting revenue, margin and channel performance to owners or investors.
What is inside:
- Revenue, gross margin, average order value, conversion rate, return rate and sell-through against targets
- Channel and category breakdowns in a single stakeholder-facing view
- KPI Trend tab for twelve-month seasonality and year-on-year comparison
- Editable target column so the same file carries budget, forecast and actual
Concretely: load last month’s platform export, and you have an investor update page plus a category review in one file. Because the cost is fixed at $12.99, a Black Friday spike that would push a usage-priced platform into a higher tier costs you nothing. If you also sell through a CRM-driven pipeline, our Salesforce alternatives in Excel and Sheets covers the front end of the same funnel.
Best for: commercial reporting where data volume would drive a platform bill. $12.99 – view the template.
How to choose between them
Pick by the job, not by the format. This table maps the Sisense use case you are actually replacing to the file you should buy:
| If you… | Buy this | Price |
|---|---|---|
| Need analytics inside your own web page or client portal | Healthcare Analytics Dashboard (HTML) | $14.99 |
| Want the cheapest cloud dashboard on a shared link | Data Analytics Dashboard (Google Sheets) | $9.99 |
| Publish a recurring board or client reporting pack | Project Management Stakeholder Reporting KPI Dashboard (Excel) | $12.99 |
| Must keep governance, refresh and audit traceability | Regulatory Reporting KPI Dashboard (Power BI) | $11.99 |
| Report uptime, incidents and delivery metrics | IT and Tech Stakeholder Reporting KPI Dashboard (Excel) | $12.99 |
| Report revenue, margin and channel performance | Retail and E-commerce Stakeholder Reporting KPI Dashboard (Excel) | $12.99 |
Still undecided? Use this four-step test. One: does anyone outside your company need to see the dashboard? If yes, go HTML. Two: does anyone need to edit it at the same time as you? If yes, go Google Sheets. Three: will someone audit the numbers? If yes, go Power BI. Four: if none of those apply, buy the Excel dashboard that matches your department and stop shopping – it is the fastest route from export to finished report.
Ready to switch? The two files that replace the most Sisense functionality for the least money are the Healthcare Analytics Dashboard in HTML at $14.99 for the embedded use case, and the Data Analytics Dashboard in Google Sheets at $9.99 for shared self-service dashboards. Together that is $24.98 paid once – less than a single day of a typical Sisense cloud contract.
The switching maths, worked through
Take a realistic case: an eight-person team on a cloud Sisense deployment. Using the widely reported cloud figure of roughly $21,000 a year for five users as a floor, and allowing for three more users plus the 20-30% that reviewers report for AI and premium connectors, a plausible annual cost sits somewhere between $30,000 and $40,000 – and that is before the internal time to maintain the data model.
Buying all six templates in this guide costs $75.94, once. Against a $30,000 contract that is about 0.25% of one year’s spend, and it never renews. Even if you value the internal admin you save at nothing, and even if a template only covers 60% of what the platform did, the break-even arrives on roughly the first working day.
The honest counterweight: you are also buying back a job. Someone has to paste the export in each period. Budget an hour a month per dashboard. At any sensible internal rate that is still an order of magnitude cheaper than the licence – but it is not zero, and anyone who tells you a template is free of effort is selling you something.
When Sisense is still the right call
We would rather keep a customer than sell them the wrong file. There are real situations where Sisense earns its contract, and if any of these describes you, stay:
- You embed analytics for many customers with per-tenant security. Serving hundreds of clients their own filtered view, with row-level security, SSO and white-labelling, is precisely what Sisense’s embedded SDK exists for. A static HTML file gives you one view, not a governed multi-tenant one.
- Your data is genuinely large or live. The Elasticube engine and live warehouse connections handle volumes that will simply break a spreadsheet. If you are querying tens of millions of rows, or need sub-minute freshness against Snowflake or BigQuery, no template in this list is a substitute.
- You need enterprise security and compliance guarantees. SOC 2 attestations, audited access controls, retention policies and a vendor to name in a security questionnaire are things a file cannot provide. Regulated enterprises usually need the paperwork as much as the product.
- Analytics is your product. If dashboards are what your customers pay you for, the licence is cost of goods sold, not overhead. Build on a platform.
- You have more than about twenty dashboard consumers. Past that point, version control across spreadsheet copies becomes a real operational risk, and a central platform starts to pay for itself.
The sweet spot for these templates is a team of roughly one to fifteen people who need clear, repeatable reporting and self-service dashboards – not a governed data platform. If that is you, the arithmetic is one-sided. If it is not, Sisense is a fair price for something a spreadsheet genuinely cannot do. Weighing several vendors at once? Our Domo alternatives and NetSuite alternatives guides run the same comparison for those platforms.
Comparing e-commerce reporting tools? See our guide to Shopify Analytics alternatives in Excel & Sheets for 8 affordable dashboard templates from $6.99.
Frequently asked questions
What is the best Sisense alternative for a small team?
The Healthcare Analytics Dashboard in HTML ($14.99) if you need an embeddable analytics view, or the Data Analytics Dashboard in Google Sheets ($9.99) if you just need shared dashboards. Both are one-time purchases with no seats, no renewal and no sales call to get a price.
How much does Sisense cost per year?
Sisense does not publish list prices – its pricing page is quote-only. Third-party contract trackers report roughly $10,000 a year self-hosted for five users, about $21,000 cloud, entry contracts near $25,000, and an average around $137,000. Always get your own quote.
Does Sisense publish its pricing publicly?
No. The official Sisense pricing page shows two options – an Enterprise plan built to specification and a Self-Serve trial – with no dollar figures at all. Every published Sisense price you will find online comes from third-party buyer data or customer reviews, not from Sisense.
Is there a free Sisense alternative?
Google Sheets itself is free, so the only cost of the Google Sheets template here is $9.99 once. Sisense offers a self-serve trial but no permanent free tier for production use. For most small teams a paid-once template is cheaper than the first month of any BI platform.
Can a spreadsheet really replace embedded analytics?
Partly. An HTML dashboard embeds into your own page and covers the single-view case well. What it cannot do is per-customer row-level security, SSO or white-labelled multi-tenant delivery. If you serve many external customers their own filtered data, keep a platform.
Which template is best for regulated industries?
The Regulatory Reporting KPI Dashboard in Power BI ($11.99). It ships a semantic model with DAX measures, synced slicers and drill-through pages, so any headline number can be traced to its underlying rows – the traceability auditors ask for and the one thing a flat file cannot offer.
How do I migrate my Sisense dashboards to a template?
Export the underlying data from your Elasticube or source system to CSV or Excel, then paste it into the template’s input tab – or use the HTML dashboard’s Excel upload control. The visuals recalculate automatically. Budget an hour per dashboard for the first pass.
Will I lose Sisense’s AI features if I switch?
Yes, and that is the trade-off. Natural-language querying, automated insight detection and forecasting do not exist in a spreadsheet. Reviewers report those AI tiers add 20-30% to a Sisense contract, so the question is whether your team uses them enough to justify that premium.
Do these templates work in Excel, Google Sheets and Power BI?
Each is built for one platform. This guide covers three Excel dashboards, one Google Sheets dashboard, one Power BI report and one HTML dashboard, so you can match whatever your team already uses. Nothing here requires a new subscription to open.
Are one-time templates cheaper than Sisense over a year?
Overwhelmingly, for small teams. All six templates together cost $75.94 once. Against a reported entry contract near $25,000 a year that is about 0.3% of a single year’s spend, and there is no renewal, no seat count and no usage tier to cross.
Get more analytics dashboard templates
Leaving Sisense does not mean losing your reporting – it means owning it. Start with the Healthcare Analytics Dashboard in HTML ($14.99) if you need to embed analytics in your own page, or the Data Analytics Dashboard in Google Sheets ($9.99) if you want the cheapest possible exit. All six files together come to $75.94 – a rounding error against any quote you will be given. Browse the wider range of Power BI dashboard templates by industry to fill any gaps.
Want to see the dashboards working before you buy? We publish build walk-throughs and full tutorials on our YouTube channel: youtube.com/@NextGenTemplates.
Related: Evaluating other BI platforms? Read our Tableau alternatives, Qlik Sense alternatives and Looker Studio alternatives guides.
Switching a support desk too? Compare our Zendesk alternatives in Excel & Google Sheets — 8 helpdesk templates that replace Zendesk ticketing, SLA and CSAT reporting from $6.99.