

The best NetSuite alternative Excel dashboard is a one-time ERP reporting template that tracks financials, inventory and order performance without a base licence or a per-user fee. Our top pick is the Finance and Accounting Inventory Management KPI Dashboard in Excel ($14.99, paid once), which covers NetSuite’s two busiest modules in a single file.
Last updated: August 2026
Related guide: Replacing the CRM side of your stack too? See our Salesforce alternatives: 8 CRM templates in Excel & Sheets.
Key takeaways
- Oracle does not publish a NetSuite price list. Independent ERP consultancies consistently report a base platform licence starting near $999 per month plus roughly $129 to $199 per full user per month, with a one-time implementation typically starting around $25,000.
- On those reported figures a ten-user mid-market deployment lands near $27,500 a year in licences before implementation, so year one commonly clears $50,000.
- All 8 templates in this guide are one-time purchases between $9.99 and $14.99. Buying every one of them costs $99.92 once, with no renewal and no per-seat charge.
- Best overall is the Finance and Accounting Inventory Management KPI Dashboard in Excel ($14.99); best value is the Enterprise Resource Planning KPI Dashboard in Google Sheets ($9.99).
- Templates replace ERP reporting, not the ERP transaction ledger. We say plainly below when NetSuite is still the correct purchase, including multi-entity consolidation and audited revenue recognition.
 Launch offer
SUMIFS, XLOOKUP, FILTER, LAMBDA and checking AI-written formulas, with real business projects. 11h 47m of video by PK, with practice files, quizzes and a capstone.
What does NetSuite actually cost in 2026?
Start with the honest answer: NetSuite has no public price list. The official NetSuite pricing page explains the structure rather than the numbers. Your annual bill is assembled from three parts — the core platform licence, the optional modules you switch on, and the number of user licences — and a separate one-time implementation fee is added on top. Every figure is quoted deal by deal.
Because of that, the only numbers available are the ones ERP implementation partners and buyer-advisory firms publish from real quotes. As of mid-2026, ERP Research’s NetSuite pricing breakdown and several independent NetSuite partners put the ranges at roughly:
| Cost component | Widely reported range (2026) | Billing shape |
|---|---|---|
| Base platform licence | $999 – $5,000 / month | Annual contract, renews |
| Full user licence | $129 – $199 / user / month | Per seat, renews |
| Add-on modules (WMS, Manufacturing, SuitePeople, Planning & Budgeting) | Priced individually per module | Annual, renews |
| Implementation | $25,000+ one-time, often 1–2× the annual licence | One-time, partner-billed |
Treat those as directional, not as a quote. But run the arithmetic once and you can see why small teams start looking: a ten-user deployment at the entry base licence works out to $999 + (10 × $129) = $2,289 a month, about $27,468 a year. Add a lean $25,000 implementation and year one clears $52,000 before a single module upgrade. That bill arrives again next year.
Three reasons small teams churn off NetSuite
1. Seat cost scales with headcount, not with value. The per-user model is rational when every user is transacting. It is punishing when half your licence holders only ever look at numbers. A warehouse supervisor who opens a stock report twice a week costs the same as a controller posting journals all day, unless you carefully manage the cheaper employee-centre licence tiers — and most small teams never get round to it.
2. You are paying for modules you never switch on. NetSuite ships an enormous surface area: financials, inventory, order management, procurement, warehouse management, manufacturing, SuiteCommerce, SuitePeople, planning and budgeting, and OneWorld multi-subsidiary consolidation. A single-entity company with one warehouse and 400 SKUs typically uses financials, inventory and order management, then pays maintenance on a platform sized for a business ten times larger.
3. Administration is a real job. Saved searches, custom fields, workflow scripts, role permissions, quarterly release regression testing — someone owns all of it. Smaller companies either hire a NetSuite administrator or keep a partner on retainer. Either way, the ongoing cost of running the system is routinely underestimated at purchase and appears on no quote.
A spreadsheet or Power BI reporting template inverts all three. Nobody has a seat. Nothing is licensed that you do not open. And the entire logic sits in the formula bar, so the person who maintains it is the person who already reads the report.
NetSuite module vs the NGT template that covers it
This is the head-to-head that matters. On the left, the NetSuite capability you are paying for. On the right, the NGT template that reproduces its reporting output, and the one-time price.
| What NetSuite charges for | NGT template that covers the reporting | One-time price |
|---|---|---|
| Financial Management + Inventory reporting | Finance and Accounting Inventory Management KPI Dashboard in Excel | $14.99 |
| SuiteAnalytics executive ERP scorecard | Enterprise Resource Planning KPI Dashboard in Google Sheets | $9.99 |
| Supply Chain Management and demand planning views | Supply Chain and Logistics Inventory Management KPI Dashboard in Excel | $14.99 |
| Order Management + warehouse fulfilment KPIs | Order Fulfilment KPI Dashboard in Power BI | $11.99 |
| Order-to-cash: AR ageing and collections | Accounts Receivable KPI Dashboard in Excel | $12.99 |
| Procure-to-pay: AP ageing and vendor terms | Accounts Payable KPI Dashboard in Excel | $12.99 |
| Order cycle time and fulfilment SLA analysis | Order Cycle Time KPI Dashboard in Power BI | $11.99 |
| Cash management and rolling liquidity forecast | Cash Flow KPI Dashboard in Google Sheets | $9.99 |
Eight templates, $99.92 in total, paid once. On the reported ranges above, that is roughly what one NetSuite full-user licence costs for about three weeks.
NetSuite alternative templates compared
Every template in this guide side by side. One row is flagged best overall and one best value.
| Template | Format | Best for | Price |
|---|---|---|---|
| Finance and Accounting Inventory Management KPI Dashboard (Best overall) | Excel | Financials and stock health in one offline file | $14.99 |
| Enterprise Resource Planning KPI Dashboard (Best value) | Google Sheets | Cross-module ERP scorecard for the leadership team | $9.99 |
| Supply Chain and Logistics Inventory Management KPI Dashboard | Excel | Multi-site stock, lead time and logistics cost | $14.99 |
| Order Fulfilment KPI Dashboard | Power BI | Perfect-order rate and warehouse throughput | $11.99 |
| Accounts Receivable KPI Dashboard | Excel | DSO, ageing buckets and the collections chase | $12.99 |
| Accounts Payable KPI Dashboard | Excel | DPO, early-payment discounts and vendor terms | $12.99 |
| Order Cycle Time KPI Dashboard | Power BI | Stage-by-stage order-to-delivery bottlenecks | $11.99 |
| Cash Flow KPI Dashboard | Google Sheets | Rolling cash position shared with the board | $9.99 |
How we picked these
We searched the NextGenTemplates catalogue of roughly 6,900 published products for finance, inventory, supply chain, order management and ERP reporting templates across Excel, Google Sheets and Power BI. We then mapped every candidate against NetSuite’s actual module list and kept only the templates that reproduce a job a real NetSuite customer performs weekly: closing the numbers, ageing the ledger, turning stock, and getting orders out on time. Single-industry dashboards were excluded, because a report that only fits dental clinics is not an ERP replacement. So were files without editable KPI logic — if you cannot rename a metric or change a target, it cannot follow your chart of accounts. Every template below is a paid, one-time product with visible formulas or an open Power BI model, and the eight together give you at least one option in each of the three formats a finance team is likely to already own.
The 8 best NetSuite alternative templates for 2026
1. Finance and Accounting Inventory Management KPI Dashboard in Excel — best overall

This is the closest single-file substitute for NetSuite’s core, because it does the one thing no other template here does: it puts financial KPIs and inventory KPIs on the same page. In NetSuite those live in two separately licensed modules and get stitched together with a saved search. Here they are one Excel file with an Actual-versus-Target input model.
Who it is for: a finance lead or operations controller at a product business who wants the month-end picture — margin, spend, stock value, turns — without opening an ERP.
What is inside:
- Dashboard, KPI Trend and Definition tabs with a clean input area for actuals and targets
- Accounting KPIs beside inventory KPIs: gross margin, cost variance, stock value, turnover, carrying cost
- Traffic-light conditional formatting, so a red cell is a decision rather than a chart to interpret
- Charts that recalculate the instant you type — no pivot refresh, no data-model rebuild
The number worth benchmarking here is inventory turnover. Commonly cited ranges put fast-moving retail around 6–12 turns a year and discrete manufacturing nearer 4–6; if this dashboard shows you at 2, you have working capital sitting in a rack. A ten-user team leaving a reported $27,500-a-year licence recovers this $14.99 file in the first four hours of the first month. Pair it with our Power BI dashboard templates ranked by industry when you outgrow one sheet.
Best for: the most complete single-file NetSuite-to-spreadsheet swap. $14.99 — view the template.
2. Enterprise Resource Planning KPI Dashboard in Google Sheets — best value

This is the template built explicitly for the job NetSuite’s SuiteAnalytics executive dashboards do: one cross-module scorecard a leadership team looks at together. Finance, operations, procurement and fulfilment metrics on one screen, at a $9.99 one-time price, running on a free Google account.
Who it is for: the founder, COO or finance director of a 5–50 person business who wants the ERP view before committing to the ERP bill.
What is inside:
- MTD and YTD KPI cards with variance to target and a traffic-light status column
- A month-picker that re-drives every metric from a single input cell
- KPI Trend and KPI Analysis tabs, so a bad month can be traced rather than merely noticed
- Native Google sharing — view-only for the board, edit for the two people who own the numbers
The practical advantage over NetSuite is distribution: you send a link. There is no seat to buy for the non-executive director who reads the pack once a quarter, and no read-only licence tier to negotiate. For a distributed leadership team this is the cheapest way to get everyone looking at the same twelve numbers. Teams that also run projects in a spreadsheet often pair it with the templates in our Asana alternative project management templates guide.
Best for: a shared, cloud-native ERP scorecard on the smallest possible budget. $9.99 — view the template.
3. Supply Chain and Logistics Inventory Management KPI Dashboard in Excel
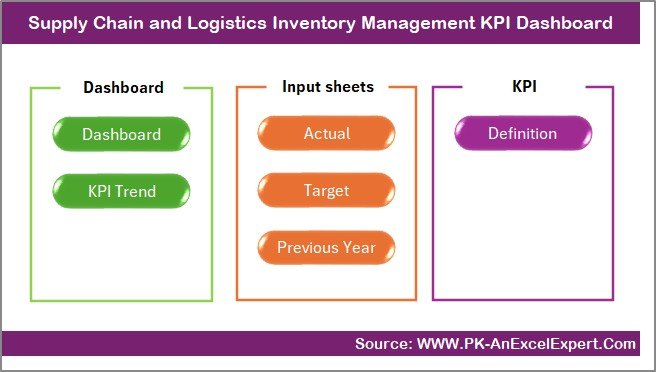
NetSuite’s Supply Chain Management module is one of the pricier things you can switch on, and for most mid-market shippers the payoff is a set of reports rather than automated planning. This Excel dashboard delivers that reporting layer directly.
Who it is for: distributors, wholesalers and light manufacturers running more than one stock location or more than one carrier.
What is inside:
- Stock cover, reorder-point breach and stockout tracking by location
- Supplier lead-time variance — the metric that actually explains a stockout
- Freight and logistics cost per unit shipped, trended month over month
- An actual-versus-target model consistent with the other Excel dashboards here
Lead-time variance is the section to use first. Average lead time is a comforting number; the spread is the one that sets your safety stock. If a supplier averages 21 days but ranges from 14 to 40, you are carrying buffer stock for the 40. Surface that and you can either renegotiate the term or dual-source, and either conversation is worth more than the licence you cancelled. It reads naturally alongside the fulfilment dashboards at #4 and #7.
Best for: multi-site stock control and supplier performance. $14.99 — view the template.
4. Order Fulfilment KPI Dashboard in Power BI
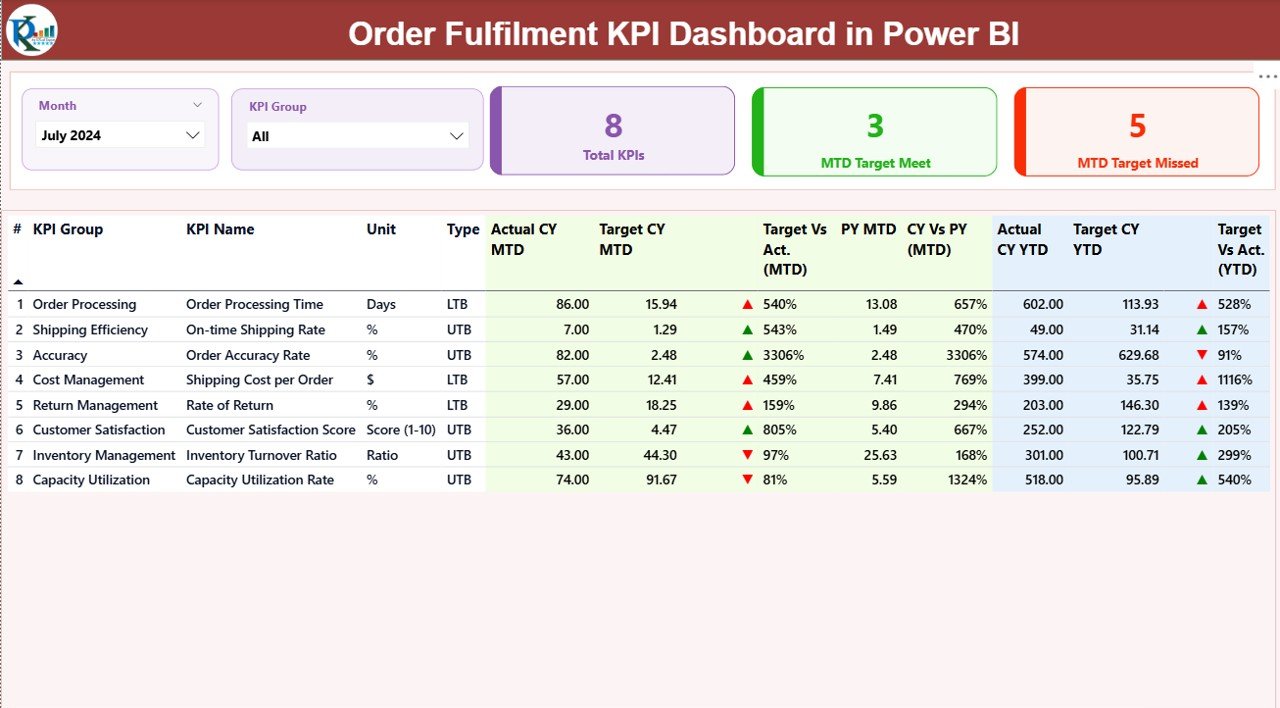
When your order volume outgrows a worksheet but your budget has not grown at all, Power BI is the sensible middle step. This report models fulfilment — orders picked, packed, shipped, delivered, returned — into a filterable model with slicers for warehouse, channel and period.
Who it is for: ecommerce and distribution teams already exporting order data who need NetSuite-grade fulfilment reporting without NetSuite-grade licensing.
What is inside:
- A semantic model with a proper date table and pre-written DAX measures
- Perfect-order rate, on-time-in-full, fill rate and return rate
- Slicers for warehouse, channel, carrier and period, synced across pages
- Drill-through detail pages down to an individual order line
Perfect-order rate is the benchmark to hold yourself to, and the arithmetic surprises people. It multiplies four independent success rates — on time, complete, undamaged, correctly documented — so four steps at 97% compound to roughly 88% overall. That is why a team that feels “about 97% reliable” gets quoted 88% by its largest retail customer. Getting that single number onto a wall is often the highest-value thing an ERP reporting project delivers. See the wider set in our Power BI dashboard template roundup.
Best for: warehouse throughput and perfect-order tracking. $11.99 — view the template.
5. Accounts Receivable KPI Dashboard in Excel
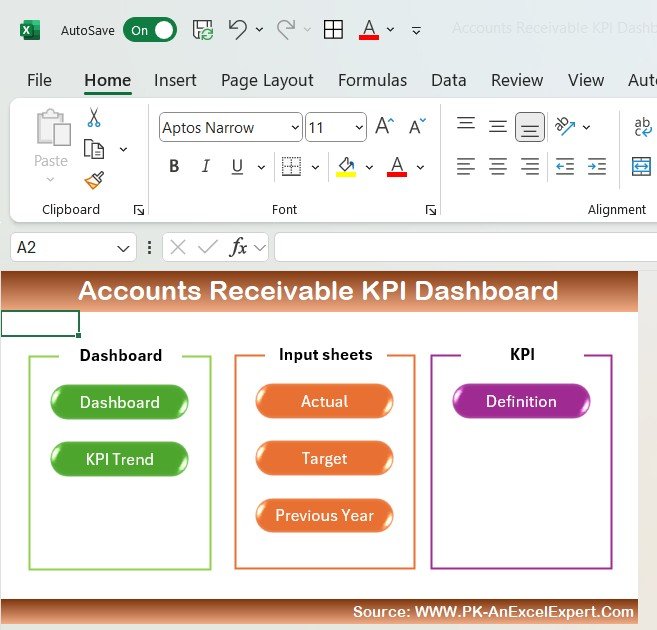
Order-to-cash is where ERP spend is most often justified and least often measured. This dashboard takes the AR half of it — ageing, DSO, collection effectiveness — and puts it in a file your credit controller can run without a licence.
Who it is for: any B2B business invoicing on terms, especially one where cash is tighter than profit.
What is inside:
- Ageing buckets (current, 30, 60, 90, 90+) with customer-level drilldown
- Days Sales Outstanding trended monthly against a target you set
- Collection Effectiveness Index and bad-debt provision tracking
- Top-debtor concentration, so you can see the one account that is the problem
Use the DSO trend as your scoreboard. Commonly cited benchmarks put best-in-class B2B DSO under 30 days and mid-market medians nearer 40–45. On $3m of annual revenue, pulling DSO from 45 days to 35 releases roughly $82,000 of cash permanently — more than a year of the NetSuite licence in the worked example above, unlocked by a $12.99 file and a weekly chase list. Run it beside #6 to see both sides of the cash cycle.
Best for: collections discipline and DSO reduction. $12.99 — view the template.
6. Accounts Payable KPI Dashboard in Excel

The procure-to-pay mirror of #5. NetSuite’s Procurement module handles approvals and three-way matching; what most finance teams actually check each week is far simpler, and this file covers it.
Who it is for: a finance manager who wants to stop paying early by accident and stop paying late by surprise.
What is inside:
- Days Payable Outstanding trended against negotiated terms
- Invoice ageing and an on-time payment rate
- Early-payment discount captured versus discount available — usually the fastest win in the file
- Cost per invoice processed, plus exception and dispute volume by vendor
The discount-capture metric pays for the template on day one. A 2/10 net 30 term is worth roughly a 36% annualised return on the ten days of cash you give up, so every missed discount is expensive money. Most teams have never measured what percentage they capture, because ERP reports show the invoice, not the missed opportunity. Combine #5 and #6 and you have the full cash conversion cycle — days inventory outstanding plus DSO minus DPO — for $25.98 once.
Best for: vendor terms, DPO and discount capture. $12.99 — view the template.
7. Order Cycle Time KPI Dashboard in Power BI
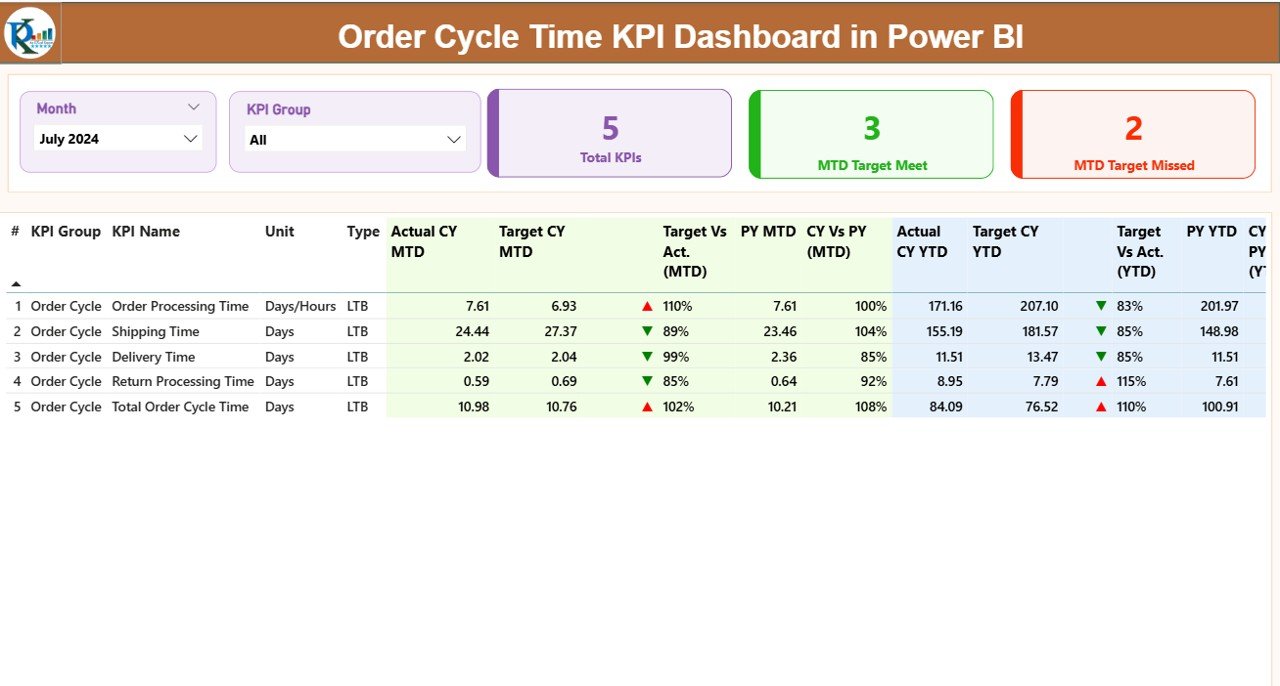
Where #4 tells you whether the order went out correctly, this one tells you where the time went. It breaks the order-to-delivery journey into stages and measures each, which is exactly the analysis NetSuite customers usually assemble by hand in saved searches.
Who it is for: operations managers whose customers are complaining about speed and who need to know which stage to fix first.
What is inside:
- Stage timings: order entry to approval, approval to pick, pick to pack, pack to ship, ship to delivery
- Median and 95th-percentile cycle time, not just the average
- Slicers by product line, warehouse, carrier and customer segment
- Tooltip and drill-through pages for outlier investigation
Insist on the 95th percentile. Average cycle time hides the tail, and the tail is what generates the complaints, the escalations and the refund requests. A business with a 2.1-day average and a 9-day P95 does not have a speed problem, it has a stuck-order problem, and those are two entirely different fixes with two entirely different costs. This report is the cheapest way to tell them apart. Teams tracking delivery promises alongside internal work often also use our Jira alternative issue tracking templates.
Best for: finding the bottleneck stage in order-to-delivery. $11.99 — view the template.
8. Cash Flow KPI Dashboard in Google Sheets
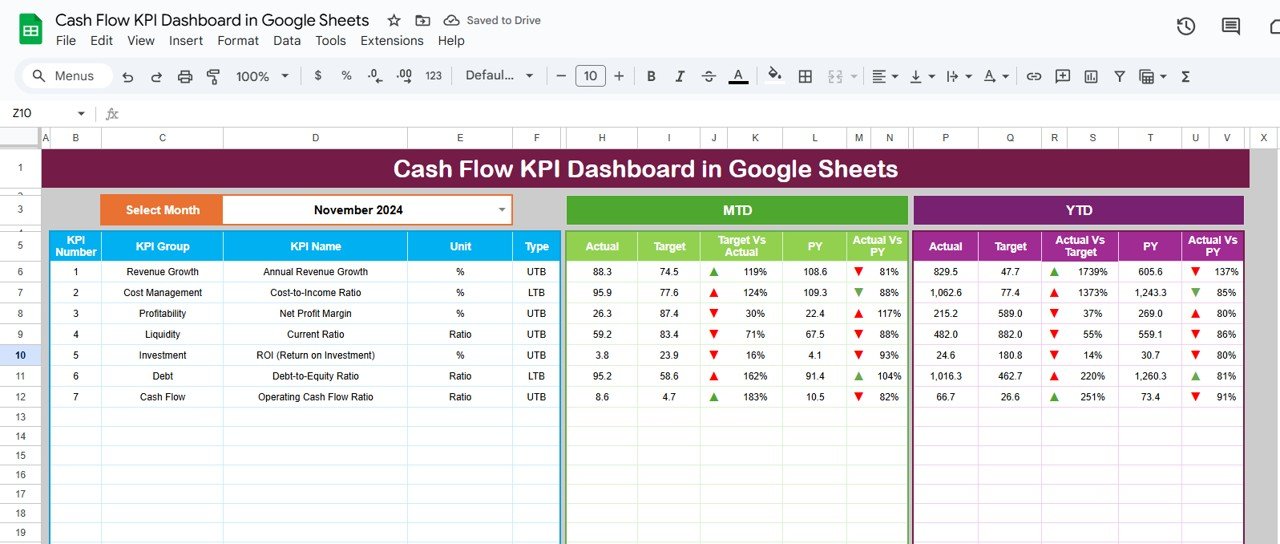
NetSuite’s cash management and rolling-forecast capability sits behind the Planning and Budgeting module, which is licensed separately from the core platform. For a single-entity business, this $9.99 Google Sheets dashboard covers the reporting side of it.
Who it is for: owner-managed and investor-backed businesses that need a defensible cash position to show a board or a lender every month.
What is inside:
- Opening balance, inflows, outflows and closing position by month
- Operating, investing and financing split for a clean cash-flow statement view
- Runway and burn tracking with variance to forecast
- Live cloud sharing, so the board pack is a link rather than an attachment
The cheapest useful discipline here is a 13-week rolling forecast, and this file gives you the structure for it without a planning module. Because it lives in Google Sheets, your accountant can be given edit rights for two days at close and removed afterwards — a permission change that in a seat-licensed ERP is a procurement conversation. Together with #5 and #6 it completes the working-capital picture for $35.97 once.
Best for: rolling cash forecasting shared with a board or lender. $9.99 — view the template.
How to choose between them
Pick by the question that is currently unanswered in your business, not by the module name on a NetSuite quote:
| If your unanswered question is… | Buy this | Price |
|---|---|---|
| “Are we profitable, and is our stock healthy?” | Finance and Accounting Inventory Management KPI Dashboard (Excel) | $14.99 |
| “What should the leadership team look at every month?” | Enterprise Resource Planning KPI Dashboard (Google Sheets) | $9.99 |
| “Why do we keep running out of stock?” | Supply Chain and Logistics Inventory Management KPI Dashboard (Excel) | $14.99 |
| “Are orders going out complete and on time?” | Order Fulfilment KPI Dashboard (Power BI) | $11.99 |
| “Why is cash tight when sales are fine?” | Accounts Receivable KPI Dashboard (Excel) | $12.99 |
| “Are we paying vendors on the right terms?” | Accounts Payable KPI Dashboard (Excel) | $12.99 |
| “Which stage is slowing delivery down?” | Order Cycle Time KPI Dashboard (Power BI) | $11.99 |
| “How many months of runway do we have?” | Cash Flow KPI Dashboard (Google Sheets) | $9.99 |
Still undecided? Buy the $9.99 ERP KPI Dashboard in Google Sheets first. It is the cheapest way to find out which module you actually needed, and whichever number it exposes as your weakest tells you which of the other seven to buy next.
When NetSuite is still the right call
We would rather you keep the right system than buy the wrong file, so here is the honest boundary. These templates are a reporting layer. They read your numbers and make them decidable. They are not a transactional system of record. Stay on NetSuite — or buy a comparable ERP — when any of the following is true.
- You consolidate multiple legal entities or currencies. This is what NetSuite OneWorld exists for: intercompany eliminations, multi-book accounting, statutory reporting per jurisdiction, and automatic currency revaluation. Rebuilding that in spreadsheets is not thrift, it is restatement risk.
- You need an auditable transaction trail. If an external auditor, an investor or a regulator has to trace a posted journal back to its approval, you need immutable records and role-based permissions. A spreadsheet’s version history is not an audit trail.
- Revenue recognition is complex. Subscription, multi-element, percentage-of-completion or deferred revenue under ASC 606 or IFRS 15 belongs in a revenue engine. Getting this wrong is expensive in a way no licence saving offsets.
- You need real-time inventory across many locations with serial or lot traceability. Recalls, expiry dating and regulated goods require live stock records, not a weekly extract.
- Twenty or more people transact concurrently. Past roughly ten heavy editors a shared file becomes a coordination problem. Templates suit teams where a handful of people own the numbers and everyone else reads them.
- You want workflow automation and native integration. Approval routing, three-way matching, EDI, tax engines and payment gateways come built in. Recreating them around a spreadsheet is possible and rarely worth it.
The honest sweet spot for these templates is a single-entity business with one to about ten heavy finance and operations users, and an existing accounting package — QuickBooks, Xero, Zoho Books, Sage — that records transactions well but reports on them badly. That describes a very large number of companies currently being quoted for an ERP they do not yet need. If it describes you, buy the reporting and revisit the ERP when the boundary above is crossed. For the in-between cases where a template is too thin but an ERP is too much, see how teams handle similar decisions in our ClickUp alternative spreadsheet templates roundup.
Frequently asked questions
What is the best NetSuite alternative Excel dashboard?
The Finance and Accounting Inventory Management KPI Dashboard in Excel ($14.99) is the best NetSuite alternative Excel dashboard for most small businesses. It puts financial and inventory KPIs on one page, which NetSuite splits across two separately licensed modules, and it is a one-time purchase with no per-user fee.
How much does NetSuite cost in 2026?
Oracle does not publish a NetSuite price list. Independent ERP consultancies report a base platform licence from about $999 to $5,000 per month, full user licences around $129 to $199 per user per month, and one-time implementation from roughly $25,000. Always request a written quote, as pricing is negotiated per deal.
Can a spreadsheet really replace an ERP?
It can replace ERP reporting, not the ERP ledger. For a single-entity business with under about ten heavy users, templates cover the KPI, ageing, inventory and fulfilment reporting people open daily. They cannot provide multi-entity consolidation, immutable audit trails, three-way matching or automated revenue recognition.
What is the cheapest NetSuite alternative?
Among the templates here, the Enterprise Resource Planning KPI Dashboard in Google Sheets at $9.99 is the cheapest, and Google Sheets itself is free, so there is no platform cost at all. All eight templates in this guide together cost $99.92 once, with no renewal and no seat licences.
Do these templates connect to my accounting software?
They import rather than integrate. Export a CSV from QuickBooks, Xero, Sage or Zoho Books, then paste it into the template’s input tab and the dashboards recalculate. Power BI templates connect the CSV or Excel file as a refreshable data source. Budget about an hour for the first mapping.
Which format should I choose: Excel, Google Sheets or Power BI?
Choose Excel for offline work and heavy formula editing, Google Sheets when several people need one shared live link with nothing to install, and Power BI when your data volume outgrows a worksheet or you want slicers and drill-through. This guide includes four Excel, two Google Sheets and two Power BI templates.
Is NetSuite worth it for a small business?
Usually only once you cross a structural threshold: multiple legal entities, audited accounts, complex revenue recognition, or roughly twenty concurrent transacting users. Below that, most small businesses get more value from a solid accounting package plus a reporting template than from an ERP platform they will use a fraction of.
What ERP KPIs should I track first?
Start with five: Days Sales Outstanding, Days Payable Outstanding, inventory turnover, perfect-order rate and gross margin. Together they cover cash in, cash out, working capital, delivery quality and profitability. Every template in this guide reports at least one of them against a target you set.
Can I customise these ERP dashboards?
Yes, and that was a selection criterion. Every template exposes its formulas or its Power BI model, so you can rename KPIs to match your chart of accounts, change targets, add metrics and restyle charts. You own the file outright, with no vendor to raise a change request with.
How long does it take to switch from NetSuite to templates?
Plan a parallel month rather than a hard cutover. Export your ledger, inventory and order history, load the templates, then run both systems in parallel for one close cycle to confirm the numbers tie. Most single-entity teams complete this in two to four weeks of part-time work.
Get more ERP reporting templates
Leaving NetSuite is not a downgrade if what you actually needed was the reporting. Start with the Finance and Accounting Inventory Management KPI Dashboard in Excel ($14.99) if your team lives in Excel, or the Enterprise Resource Planning KPI Dashboard in Google Sheets ($9.99) for the cheapest cloud switch. All eight are $99.92 in total, paid once — roughly three weeks of one reported NetSuite full-user licence. Browse the full range of business analytics dashboard templates to mix formats, and see our Zoho CRM alternative Excel templates and HubSpot alternative spreadsheet templates if you are unpicking the front office as well.
Prefer to see a dashboard working before you buy? Watch full build walk-throughs and tutorials on our YouTube channel: youtube.com/@NextGenTemplates.
Related: Moving off another subscription? See our Pipedrive alternatives — 8 sales pipeline templates in Excel & Sheets and Trello alternatives — 8 kanban board templates in Excel & Sheets.
Comparing analytics platforms? See our guide to the best Tableau alternatives: 8 BI & analytics templates in Excel & Sheets.
Early-stage and watching every dollar? Compare these ERP tools with our budget-first startup reporting stack templates, a 10-template stack that delivers enterprise-grade reporting without the per-seat subscription.