

The best Looker Studio alternative in Google Sheets or Excel is a one-time reporting template that renders instantly, works offline and never asks for a per-user licence. Our top pick is the Marketing Analytics Dashboard in Google Sheets ($6.99, paid once), which turns the Sheet you already connect to Looker Studio into the finished report.
Last updated: August 2026
Related guide: Comparing the wider BI field? See our Tableau alternatives — 8 BI and analytics templates in Excel & Sheets.
Key takeaways
- Looker Studio is genuinely free. Google’s own page states it is “available at no charge for creators and report viewers” — so unlike Tableau or Domo, seat cost is not why people leave.
- Google renamed Looker Studio back to Data Studio on 16 April 2026, ending the 3.5-year Looker Studio branding. Same product, same links, new name.
- The paid tier, Looker Studio Pro (now Data Studio Pro), is $9 per user per project per month — billed per Google Cloud project and per licensed user, used or not. Five people across two projects is $1,080 a year.
- The real churn reasons are performance, paid third-party connectors for non-Google data, no offline access, and rebuilding every report from a blank canvas.
- All 8 templates here are one-time purchases from $4.99 to $49.99. Best overall is the Marketing Analytics Dashboard in Google Sheets ($6.99); best value is the 7-template Marketing and Social Media Analytics Kit ($49.99).
 Launch offer
SUMIFS, XLOOKUP, FILTER, LAMBDA and checking AI-written formulas, with real business projects. 11h 47m of video by PK, with practice files, quizzes and a capstone.
Why do people look for a Looker Studio alternative if it is free?
This is where most “alternatives” posts get it wrong. They run the standard per-seat argument — and it does not apply here. Looker Studio has a permanently free tier, and on the official Google Cloud Data Studio page Google states plainly that it “is available at no charge for creators and report viewers”. You can build, share and view reports for $0 forever.
So the switchers are not running from a bill. When we looked at what people actually complain about, five reasons came up again and again.
1. It got slow, and the paid tier does not fix that. Looker Studio queries the underlying source every time a report loads or a filter changes, and it does not cache aggressively. A ten-widget report pulling from three sources routinely takes 10 to 20 seconds to render, and performance was the single most-flagged issue in 2025 user reviews. Upgrading to Pro does not help — Pro adds governance, not query speed. The bottleneck is architectural.
2. Pro is where the money is, and it is priced per project. Google’s published figure for Data Studio Pro is $9 per user per project per month. Two details matter more than the number. It is billed per Google Cloud project, so an agency running four clients in four projects buys four subscriptions. And it is billed per licensed user, not per active user — someone who has not opened a report since March still costs $9 a month until you remove the licence. Twelve licences across four projects is $108 a month, $1,296 a year.
3. Non-Google data costs extra. Google’s own connectors — GA4, Google Ads, Search Console, Sheets, BigQuery — are free. Facebook Ads, LinkedIn, TikTok, Shopify, Amazon and most CRMs are not: they need a partner connector, and partner connectors are their own monthly subscriptions. Entry plans from the main vendors start around €29 to $37 a month billed annually, and rise with every extra data source, account and user. That is frequently more than the reporting tool it feeds.
4. There is no offline mode. Looker Studio is browser-only and needs a live Google session. No plane, no client site with locked-down Wi-Fi, no handing a single file to a stakeholder who does not have a Google account. A spreadsheet is a file; you email it, you open it, it works.
5. Every report starts from a blank canvas. The template gallery gives you layouts, not logic. Cost per lead, ROI, revenue per lead, month-over-month variance, channel efficiency — you build every one of those as a calculated field, chart by chart, then rebuild them next quarter for the next client. A finished dashboard template ships with the metric definitions already written and tested.
The scale limits are real too: the Extract Data connector caps at 100 MB per extract, and a blend is capped at five data sources. Both are workable, and both are the point at which people start exporting to a spreadsheet anyway.
Is Looker Studio the same thing as Data Studio now?
Yes. On 11 April 2026 Google confirmed in its official Google Cloud announcement that Looker Studio was reverting to its original name, and the change went live on 16 April 2026. The positioning is the split you would expect: Data Studio is self-serve reporting and ad-hoc exploration, while Looker remains the governed enterprise BI platform sold on an annual commitment. Existing reports, data sources, permissions and shared links carried over automatically — nothing to migrate, no embeds to fix. If you search for “Looker Studio pricing” in 2026 and land on a page headed Data Studio, that is why. We use both names in this guide because both are still in circulation.
Looker Studio vs the NGT template that covers it
Here is the head-to-head. On the left, the job you use Looker Studio for; in the middle, the NGT template that covers the same job; on the right, what it costs once.
| What you use Looker Studio for | NGT template that covers it | One-time price |
|---|---|---|
| Marketing report built on a Google Sheet | Marketing Analytics Dashboard in Google Sheets | $6.99 |
| Whole marketing + social reporting stack | Marketing and Social Media Analytics Kit (7 templates) | $49.99 |
| Interactive, drillable multi-source report | Marketing Analytics Dashboard in Power BI | $17.99 |
| Offline campaign and channel reporting | Marketing Analytics Dashboard in Excel | $13.99 |
| Paid ads, web traffic and social in one view | Digital Marketing KPI Dashboard in Google Sheets | $12.99 |
| Monthly report for the board or the client | Sales and Marketing Stakeholder Reporting KPI Dashboard in Excel | $14.99 |
| Region and store-level performance (Geo charts) | Location-Based Marketing KPI Dashboard in Excel | $14.99 |
| A quick one-page scheduled report | Marketing Analytics Report in Excel | $4.99 |
Looker Studio alternative templates compared
Every template in this guide, side by side. Two rows are flagged: one best overall and one best value.
| Template | Format | Best for | Price |
|---|---|---|---|
| Marketing Analytics Dashboard (Best overall) | Google Sheets | The straight Looker Studio swap on data you already keep in Sheets | $6.99 |
| Marketing and Social Media Analytics Kit (Best value) | Excel + Google Sheets + Power BI | Agencies and teams that need the whole reporting stack | $49.99 |
| Marketing Analytics Dashboard | Power BI | Interactive, drillable reporting across campaigns and channels | $17.99 |
| Marketing Analytics Dashboard | Excel | Offline, file-based campaign and ROI reporting | $13.99 |
| Sales and Marketing Stakeholder Reporting KPI Dashboard | Excel | MTD/YTD reporting for boards and clients | $14.99 |
| Location-Based Marketing KPI Dashboard | Excel | Regional, store and territory performance | $14.99 |
| Digital Marketing KPI Dashboard | Google Sheets | Paid ads, traffic and social in one live sheet | $12.99 |
| Marketing Analytics Report | Excel | The cheapest way to test the switch | $4.99 |
How we picked these
We searched the NextGenTemplates catalogue of roughly 6,900 published products for marketing, campaign, channel and analytics reporting templates across Excel, Google Sheets and Power BI, then filtered to the ones that reproduce what people actually build in Looker Studio: cost versus revenue, cost per lead, ROI by channel, conversion rate, and month-by-month trend. We excluded single-industry dashboards that only fit one niche, anything without editable metric logic, and free files that fall over past a few hundred rows. Every template below is a paid, one-time product with visible formulas, because a Looker Studio replacement you cannot re-point at your own fields is not a replacement. We put the Google Sheets version first on purpose — Sheets is the single most common Looker Studio data source, so it is the shortest possible migration.
The 8 best Looker Studio alternative templates for 2026
1. Marketing Analytics Dashboard in Google Sheets — best overall

This is the shortest migration path off Looker Studio in the whole guide, because it removes a step rather than adding one. Most Looker Studio reports are already fed by a Google Sheet. Here the Sheet is the report: you paste campaign, channel, cost, lead and revenue data into the input tab and the dashboard is finished.
Who it is for: anyone whose Looker Studio report reads from Sheets and who is tired of waiting for the canvas to redraw after every filter change.
What is inside:
- Cost vs revenue ROI analysis, with cost per lead and revenue per lead calculated for you
- Campaign, channel and campaign-manager breakdowns on one page
- Monthly trend and seasonality view
- Instant search and filter across the raw data, with no blend limit to design around
Because it runs entirely inside Google Sheets, it renders at spreadsheet speed rather than at query speed — there is no connector round-trip, so filters respond immediately instead of in 10 to 20 seconds. It costs $6.99 once, which is less than one month of a single Data Studio Pro licence, and there is no project to attach it to and no licence to reclaim when someone leaves. It also stays inside the Google account and sharing model your team already uses. For the wider Google Sheets versus Excel versus Power BI decision, see our dashboard format comparison.
Best for: the direct Looker Studio swap when your data already lives in Sheets. $6.99 — view the template.
2. Marketing and Social Media Analytics Kit — best value

If you are replacing Looker Studio for more than one report, buy the stack rather than the file. This is seven premium templates covering marketing analytics, social media performance and campaign planning, delivered across all three formats — Excel, Google Sheets and Power BI — in a single purchase.
Who it is for: agencies, freelancers and in-house teams who report on paid, organic and social together, and who would otherwise be running several Looker Studio reports across several Google Cloud projects.
What is inside:
- 7 ready-to-use templates spanning marketing analytics, social performance and campaign planning
- All three platforms in one kit, so each client or stakeholder gets the format they prefer
- Social KPI tracking: likes, reach, engagement, impressions and clicks
- Campaign and ROI analytics: CPL, conversions and return by channel
The bundle maths is the reason it is our best-value pick. Bought individually the seven templates come to $84.93; the kit is $49.99, a saving of $34.94. Set against Data Studio Pro, a five-person team on one project pays $45 a month, so the entire kit costs about five weeks of that subscription — and then never bills again. This is also the answer to the per-project pricing trap: one purchase covers every client you report on, because there is no project to license.
Best for: replacing a whole Looker Studio reporting stack in one purchase. $49.99 — view the bundle.
3. Marketing Analytics Dashboard in Power BI
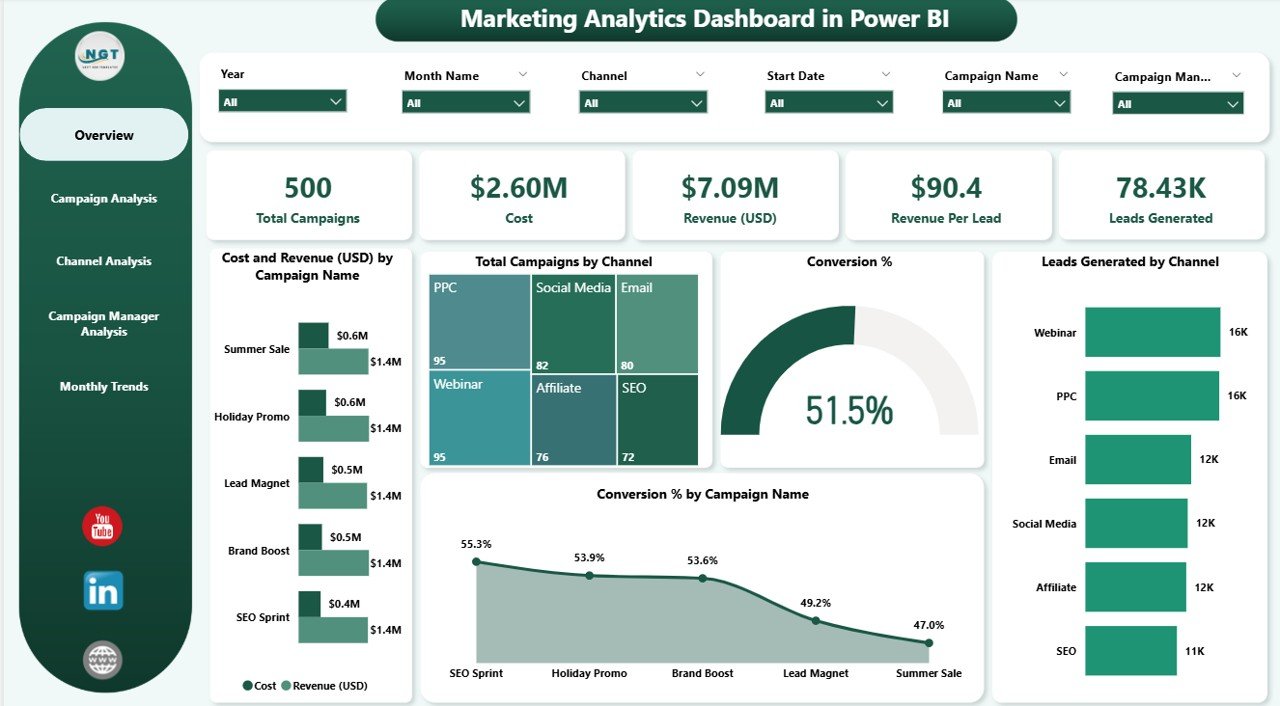
This is the pick for people who liked Looker Studio’s interactivity and only wanted it to be faster. Power BI imports and compresses the data into a model, so slicing hundreds of thousands of rows is instant rather than a fresh query against a connector every time somebody clicks.
Who it is for: teams who outgrew Looker Studio’s blend limit of five sources, or who need drill-down that survives a real dataset.
What is inside:
- Overview page with high-level KPIs and visuals
- Campaign analysis: cost per lead and conversion rate by campaign
- Channel analysis comparing ROI across channels
- Manager analysis and a monthly trends page for seasonality
At $17.99 it is the most expensive single template here and still less than a month of Pro for two people. Power BI Desktop is free to build in, and reports can be shared as a file, so you can hand the finished report to a colleague without buying anyone a licence. Where Looker Studio makes you re-derive cost per lead as a calculated field in every report, here the DAX measures ship written and tested. Browse the full range of Power BI dashboard templates ranked by industry if marketing is only one of the reports you owe.
Best for: interactive, drillable reporting at a data volume Looker Studio starts to struggle with. $17.99 — view the template.
4. Marketing Analytics Dashboard in Excel
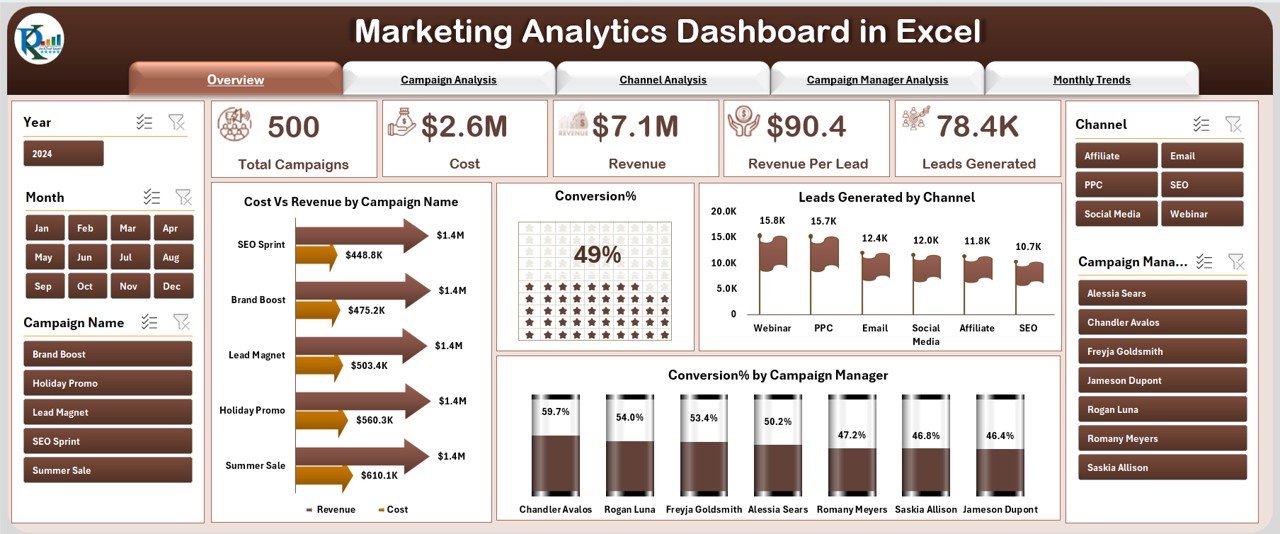
The same five-page analysis as the Google Sheets and Power BI versions, in a file that does not need a browser, a Google account or an internet connection. This is the answer to the offline gap, and it is the version to send a client who will never log in to anything.
Who it is for: marketers who present from a laptop on a client site, and finance-adjacent stakeholders who want the workbook, not a link.
What is inside:
- Five analytical pages: Overview, Campaign, Channel, Manager and Trends
- KPI tracking for cost vs revenue, conversions and ROI in one place
- Leads, conversions and cost-per-lead by campaign
- Channel efficiency and revenue contribution comparison
$13.99 once, and the file keeps working in ten years with no account attached to it. Excel also gives you something Looker Studio deliberately does not: the ability to type an override into a cell when a number is wrong, without going back to fix the source first. A monthly reporting pack that used to take an hour of Looker Studio screenshotting becomes a saved workbook you refresh and print. It sits naturally next to our sales dashboard templates if marketing hands leads to a sales team.
Best for: offline, file-based reporting and stakeholders without Google accounts. $13.99 — view the template.
5. Sales and Marketing Stakeholder Reporting KPI Dashboard in Excel

Looker Studio is an exploration tool. A board pack is not exploration — it is the same fifteen numbers, every month, against target. This scorecard is built for that job: MTD, YTD and prior-year comparison with target versus actual on every line.
Who it is for: marketing managers who present to a leadership team or a client retainer meeting and need the same layout to hold from month to month.
What is inside:
- KPI tracking for sales revenue, lead conversion and ROI
- MTD, YTD and previous-year performance comparison
- Campaign effectiveness measured on CPA and ROI
- Target vs actual with a status indicator on every KPI
The specific thing Looker Studio makes hard is the YTD-versus-prior-year column, which needs a date range comparison plus a calculated field for every metric. Here it is a column. At $14.99 once, a team producing twelve board packs a year is paying about $1.25 a pack. If you also report on people metrics, our HR dashboard templates in Excel follow the same scorecard pattern, so the two packs look like one system.
Best for: recurring monthly reporting to a board or a client. $14.99 — view the template.
6. Location-Based Marketing KPI Dashboard in Excel
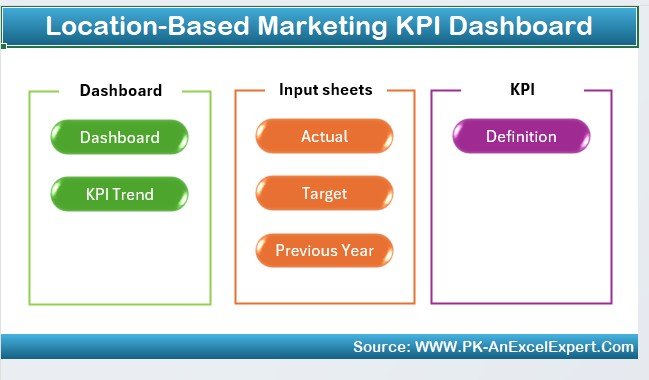
Geo maps are one of Looker Studio’s nicest visuals and one of its least useful, because a heat map of countries rarely answers “which of my 40 branches is underperforming”. This dashboard treats location as a dimension you can rank, not just colour in.
Who it is for: multi-site retailers, franchises, clinics and field marketing teams reporting by region, city, store or territory.
What is inside:
- Regional sales performance by geographic area
- Customer engagement tracking across foot traffic and online interactions
- Campaign ROI measured per location, not just per channel
- Charts and maps for regional comparison at a glance
Run it monthly and the value shows up as a ranked list: the bottom five locations by ROI, which is the actionable output a geo heat map never quite gives you. At $14.99 it costs less than one Pro licence for two months, and there is no per-project fee if you report on several regions as separate books. Retail teams usually pair it with our retail and e-commerce dashboard templates to line up store performance against online.
Best for: regional, store and territory-level marketing performance. $14.99 — view the template.
7. Digital Marketing KPI Dashboard in Google Sheets
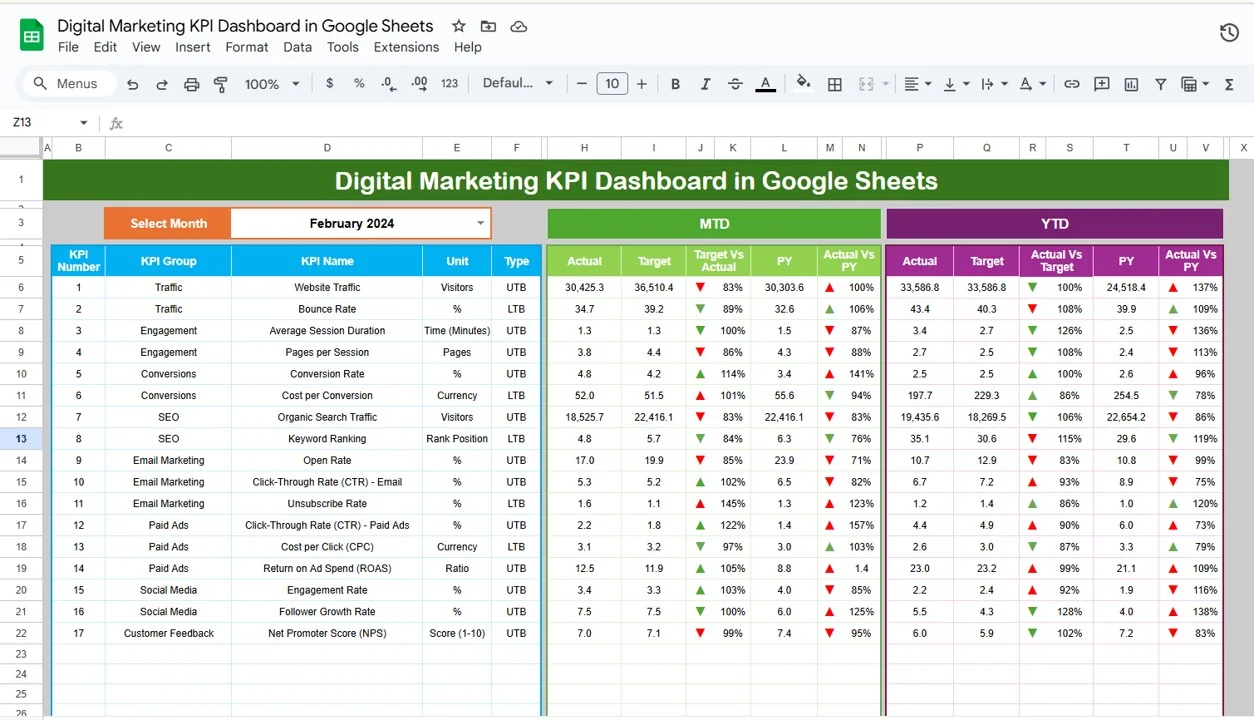
This is the template that meets the connector problem head-on. Website traffic, paid ads, social engagement and email all land in one Google Sheets dashboard — and because you control the input tab, the sources that would need a paid partner connector in Looker Studio are just columns you paste or script into.
Who it is for: digital marketers reporting across several channels, at least one of which Google does not have a free connector for.
What is inside:
- Real-time tracking of website traffic, paid ads and social media engagement
- Goal comparison so every KPI shows performance against target
- Conversion rate, email campaign and ROI tracking
- A fully customisable KPI list for whatever your channel mix actually is
At $12.99 it is a one-off cost against a connector subscription that starts around €29 to $37 a month and climbs with each extra source and account. Over a year that is roughly a $400-plus difference for a small team, before any Pro licences. Being cloud-native it also keeps the part of Looker Studio people liked — one shared link, view or edit permissions per person, everyone on the same numbers. Teams tracking leads through to close often add our lead tracker and pipeline stack underneath it.
Best for: multi-channel digital reporting without paying for connectors. $12.99 — view the template.
8. Marketing Analytics Report in Excel
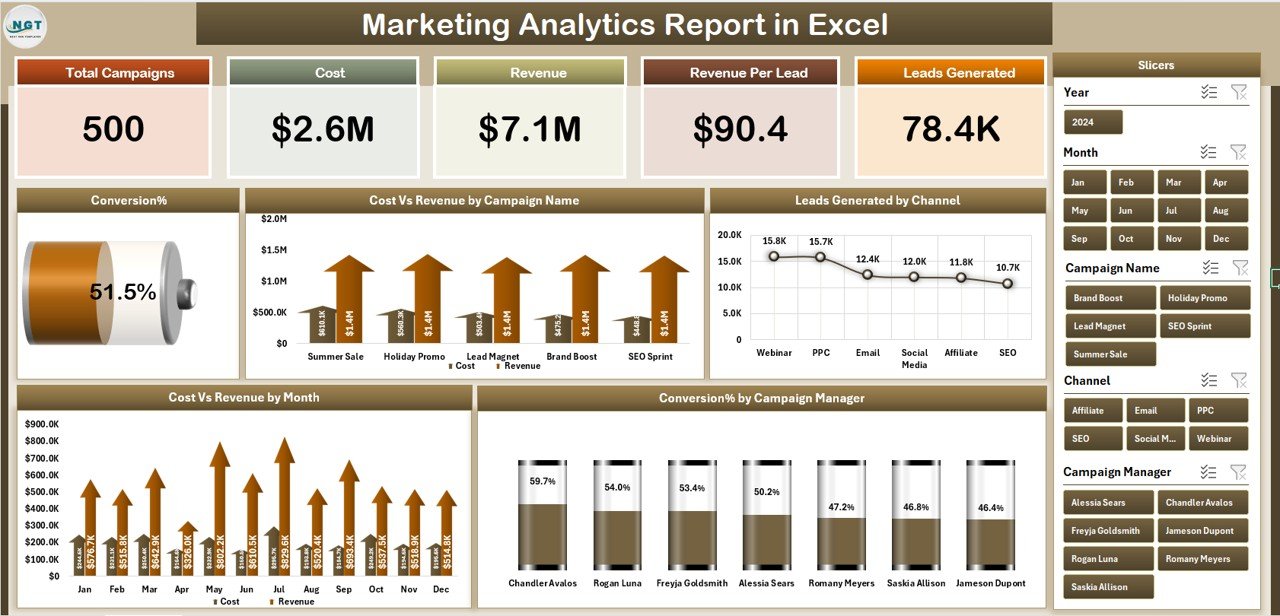
The cheapest way to find out whether a spreadsheet report is enough for you. Five KPI cards, three slicers and a detailed report view — roughly the scope of a first Looker Studio page, for the price of a coffee.
Who it is for: solo marketers, small businesses and anyone who wants to test the switch before committing to a full dashboard or the bundle.
What is inside:
- Five KPI cards: leads, cost, revenue, ROI and conversion percentage
- Interactive slicers to filter by campaign, channel or month
- Cost vs revenue ROI comparison at a glance
- A detailed report view underneath the summary
At $4.99 this is a deliberate low-risk entry point. Buy it, paste one month of campaign data in, and you will know within twenty minutes whether the slicer-and-KPI-card model covers your reporting. If it does, upgrade to the full dashboard or the kit; if it does not, you are out five dollars rather than a year of Pro licences. It is also the right file for a one-page monthly report you email rather than link.
Best for: testing the switch at the lowest possible cost. $4.99 — view the template.
Is the bundle cheaper than buying single templates?
Yes, and it is worth doing the arithmetic because this row of the catalogue spans $4.99 to $49.99 and the answer is not obvious.
| What you buy | One-time cost | Equivalent in Data Studio Pro |
|---|---|---|
| Marketing Analytics Report in Excel (entry test) | $4.99 | About 17 days of one $9 licence |
| Best-overall pick alone (Google Sheets) | $6.99 | About 23 days of one $9 licence |
| The three Marketing Analytics Dashboards (Sheets + Excel + Power BI) | $38.97 | About 4.3 months of one licence |
| All 7 single templates in this guide | $86.93 | About 1.9 months for a 5-user project |
| Marketing and Social Media Analytics Kit (7 templates) | $49.99 | About 5 weeks for a 5-user project |
The kit’s own published maths: the seven templates inside it total $84.93 bought separately, so at $49.99 you save $34.94 — a 41% discount, and you get all three platforms rather than picking one. The rule of thumb is simple. If you need one report in one format, buy the single template. If you need two or more, or you report for more than one client, the kit wins on the second purchase and every purchase after that.
The comparison against Pro is the one to keep in mind at renewal time. Every figure in the right-hand column recurs annually and scales with headcount and with the number of Google Cloud projects; every figure in the middle column is paid once.
How to choose between them
Match the template to where your data lives and who has to read the output:
| If you… | Buy this | Price |
|---|---|---|
| Already feed Looker Studio from a Google Sheet | Marketing Analytics Dashboard (Google Sheets) | $6.99 |
| Report for more than one client or brand | Marketing and Social Media Analytics Kit | $49.99 |
| Have hundreds of thousands of rows and need drill-down | Marketing Analytics Dashboard (Power BI) | $17.99 |
| Present offline or send files, not links | Marketing Analytics Dashboard (Excel) | $13.99 |
| Owe a board or client the same pack every month | Sales and Marketing Stakeholder Reporting KPI Dashboard | $14.99 |
| Report by store, branch, region or territory | Location-Based Marketing KPI Dashboard | $14.99 |
| Pull from sources Google has no free connector for | Digital Marketing KPI Dashboard (Google Sheets) | $12.99 |
| Just want to test the idea | Marketing Analytics Report (Excel) | $4.99 |
Still unsure? Start at $4.99 with the Excel report or $6.99 with the Google Sheets dashboard. Both are cheap enough to be a decision rather than a project, and you can move up to the kit later without wasting either purchase.
When Looker Studio is still the right call
We would rather keep a customer than sell them the wrong file, and Looker Studio is free, so the honest answer matters more here than in most alternatives guides. Stay on Looker Studio — now Data Studio — when any of these is true:
- Your data is entirely inside Google and it refreshes itself. If you report on GA4, Google Ads, Search Console and BigQuery, the native connectors are free, the refresh is automatic, and no spreadsheet will beat “it is already up to date when I open it”. This is the strongest case for staying, and it is a common one.
- You need many people to view, not edit. Viewing is free and unlimited. Sending fifty stakeholders a live link costs nothing; sending fifty people a spreadsheet creates fifty versions of the truth.
- Your reports are genuinely exploratory. If people change date ranges, add breakdowns and drill on the fly every day, a fixed dashboard layout will frustrate them. Templates are strongest for recurring reporting and weakest for open-ended analysis.
- You are already on BigQuery. With a well-modelled warehouse behind it, the performance complaint mostly disappears and Looker Studio becomes a thin, fast presentation layer. The right fix there is BigQuery, not a spreadsheet.
- You need reports embedded in a website or portal. Looker Studio embeds with an iframe. Spreadsheet dashboards do not do that well.
- You are governed. If you need audit logging, organisation-owned assets, team workspaces and an uptime SLA, that is exactly what Pro is sold for. Pay the $9.
The sweet spot for these templates is the opposite case: recurring monthly or weekly reporting, mixed Google and non-Google sources, a small number of editors, output that has to survive being emailed, and metric definitions you want written down rather than rebuilt. Many teams run both — Looker Studio for the live GA4 view, a template for the pack that goes to the client. That is a perfectly sensible answer, and it is what we would do.
Frequently asked questions
Is Looker Studio free in 2026?
Yes. Google states on its official product page that Data Studio, formerly Looker Studio, is available at no charge for creators and report viewers. The paid tier, Data Studio Pro, costs $9 per user per project per month and adds team workspaces, organisation asset ownership, audit logging, Google Cloud support and an uptime SLA.
What is the best Looker Studio alternative in Google Sheets?
The Marketing Analytics Dashboard in Google Sheets ($6.99) is the best Looker Studio alternative in Google Sheets for most teams. Because Sheets is already the most common Looker Studio data source, it removes the connector step entirely: your data and your finished report live in the same file, and filters respond instantly.
Why did Looker Studio change its name to Data Studio?
Google announced the rename on 11 April 2026 and it went live on 16 April 2026, reversing the 2022 change. The stated reason is product separation: Data Studio is self-serve reporting and ad-hoc exploration, while Looker remains the governed enterprise BI platform. Existing reports, permissions and shared links transferred automatically.
How much does Looker Studio Pro cost per user?
Looker Studio Pro, now Data Studio Pro, is $9 per user per project per month. Two things catch people out: it is billed per Google Cloud project, so four client projects mean four subscriptions, and it is billed per licensed user whether or not that person ever opens a report.
Why is my Looker Studio report so slow?
Looker Studio re-queries the data source on every load and every filter change, with limited caching, so a report with ten widgets on three sources can take 10 to 20 seconds. Upgrading to Pro does not help, because Pro adds governance rather than query speed. Pre-aggregating your data, or moving the report into a spreadsheet, does.
Can Excel or Google Sheets really replace Looker Studio?
For recurring reporting, yes. A template covers cost per lead, ROI by channel, conversion rate and monthly trend with the formulas already written. What it cannot replace is automatic refresh from Google sources, unlimited free viewers on a live link, and iframe embedding. If those matter most, keep Looker Studio.
Do I need to pay for connectors with Looker Studio?
Google’s own connectors for GA4, Google Ads, Search Console, Sheets and BigQuery are free. Non-Google sources such as Facebook Ads, LinkedIn, TikTok and Shopify need partner connectors, which are separate monthly subscriptions starting around 29 euros to 37 dollars a month and rising with each extra source, account and user.
What are Looker Studio’s data limits?
The two that bite most often are the Extract Data connector’s 100 MB cap per extract and the five-data-source limit on a single blend. Individual tables are also limited to ten dimensions and metrics. None of these is fatal, but all three push larger reporting jobs toward a modelled tool or a spreadsheet.
Which template should an agency buy?
The Marketing and Social Media Analytics Kit at $49.99. It bundles seven templates across Excel, Google Sheets and Power BI, saving $34.94 against the $84.93 individual total, and one purchase covers every client — unlike Data Studio Pro, which is licensed per Google Cloud project.
Can I use these templates offline?
The Excel and Power BI templates work entirely offline once downloaded, which Looker Studio cannot do at all. The Google Sheets templates need a browser, but support Google’s offline mode and are shareable by link. That is the main reason the Excel versions sit alongside the Sheets ones in this guide.
Get more marketing reporting templates
Leaving Looker Studio is not about escaping a bill — it is about owning the report instead of rebuilding it. Start with the Marketing Analytics Dashboard in Google Sheets ($6.99) if your data is already in Sheets, or take the Marketing and Social Media Analytics Kit ($49.99) if you report for more than one brand and want Excel, Sheets and Power BI covered in one purchase. Testing the water? The Marketing Analytics Report in Excel is $4.99.
Prefer to see a dashboard working before you buy? Watch build walk-throughs and tutorials on our YouTube channel: youtube.com/@NextGenTemplates.
Related: Moving off another BI platform? See our Qlik Sense alternatives — 8 BI templates in Excel & Sheets, our Domo alternatives — 8 BI templates in Excel & Sheets, our Sisense alternatives, and our Oracle Fusion alternatives — 8 enterprise reporting templates. Replacing marketing software rather than the reporting layer? Try our HubSpot alternatives — 8 CRM and marketing templates.
On a startup budget? Read the full startup reporting stack templates guide, which ranks 10 Excel, Google Sheets, Power BI and HTML reporting templates and shows the exact bundle-vs-single maths.
Looking beyond Looker Studio? Our roundup of the best Power BI Premium alternatives covers Excel, Power BI and HTML dashboards that replace a costly BI subscription.