

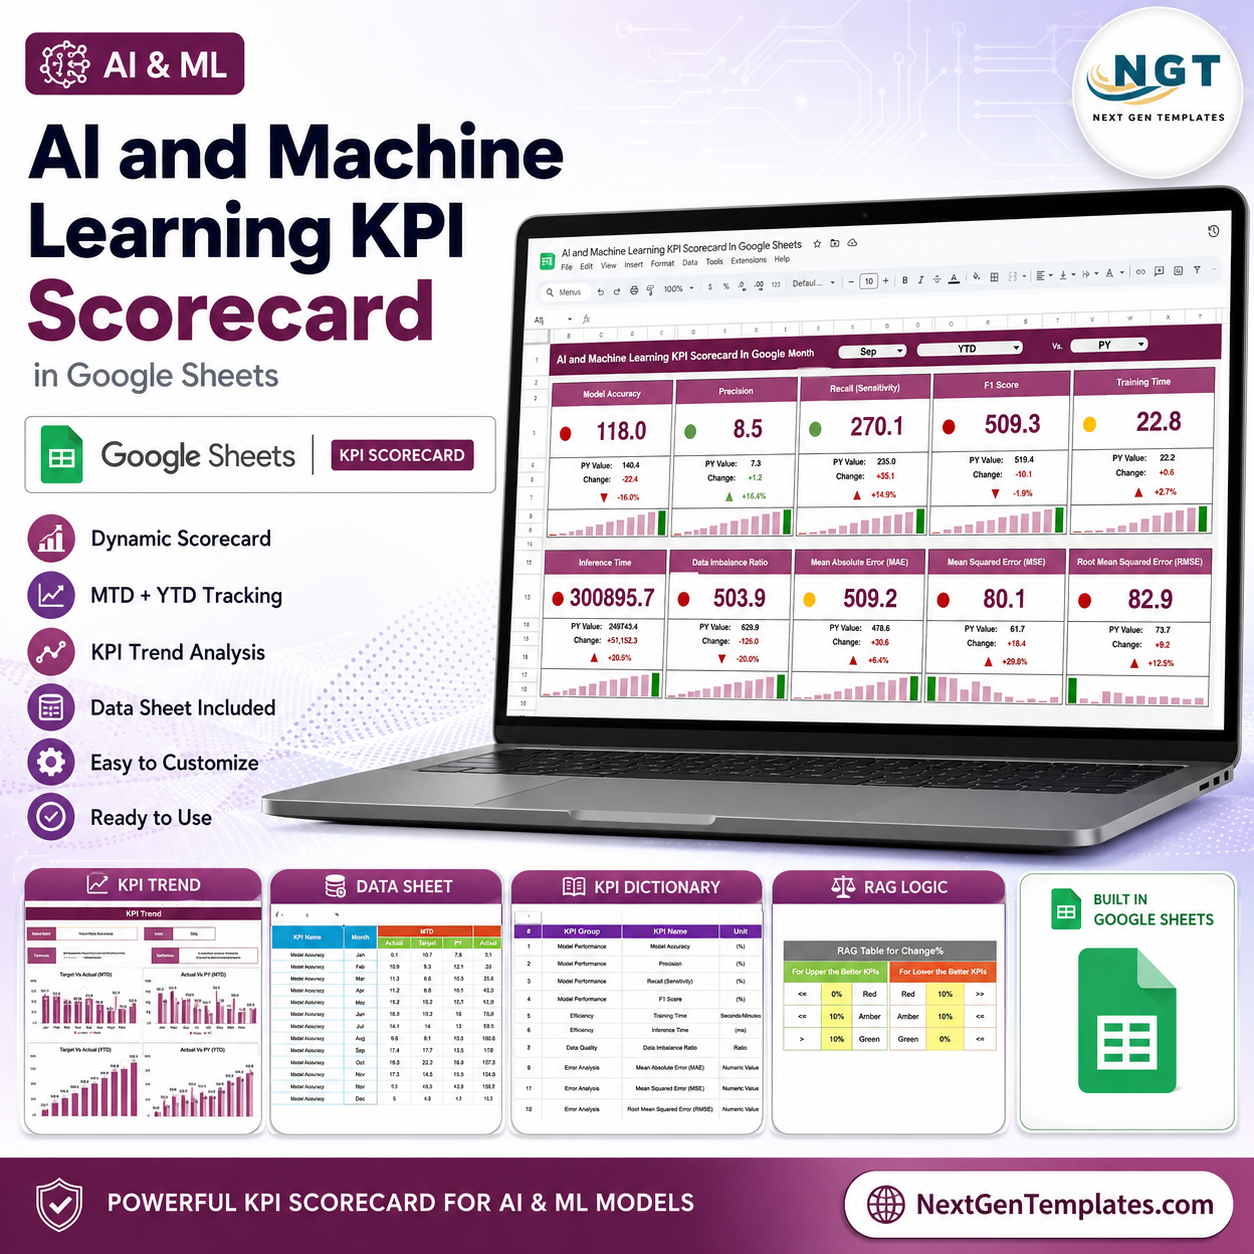
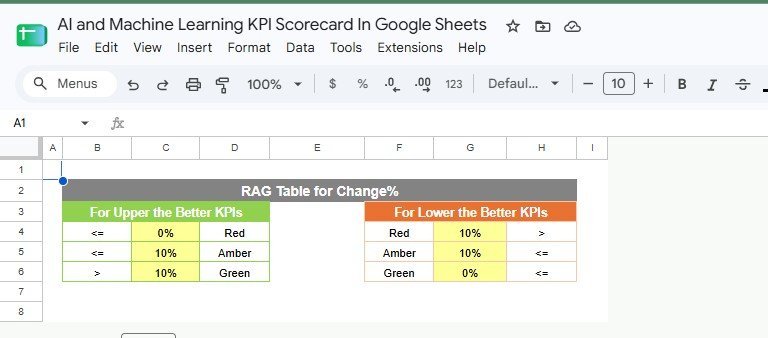
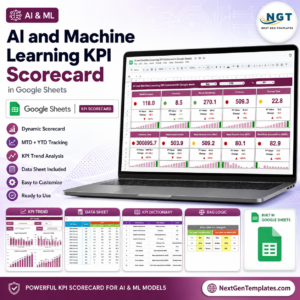
AI and Machine Learning KPI Scorecard in Google Sheets gives AI teams 5 linked sheet tabs, 10 headline KPI cards, 10 month-by-month overview charts, 4 target and prior-year trend views, and a red-amber-green change table in one editable spreadsheet. The template is listed at $8.99 sale price instead of $16.99 regular price, a one-time purchase with no per-user dashboard subscription. Built by PK, a Microsoft Certified Professional with 15+ years of Excel, Google Sheets, and Power BI experience, this file is designed for practical model review meetings. Replace the sample values with your own metrics before reporting.
Key Features of AI and Machine Learning KPI Scorecard In Google Sheets
- 10 model-performance KPIs – Model Accuracy, Precision, Recall, F1 Score, Training Time, Inference Time, Data Imbalance Ratio, MAE, MSE, and RMSE.
- Overview cards and charts – high-level scorecards plus monthly charts for every KPI.
- MTD and YTD tracking – compare Actual, Target, and Previous Year values by month.
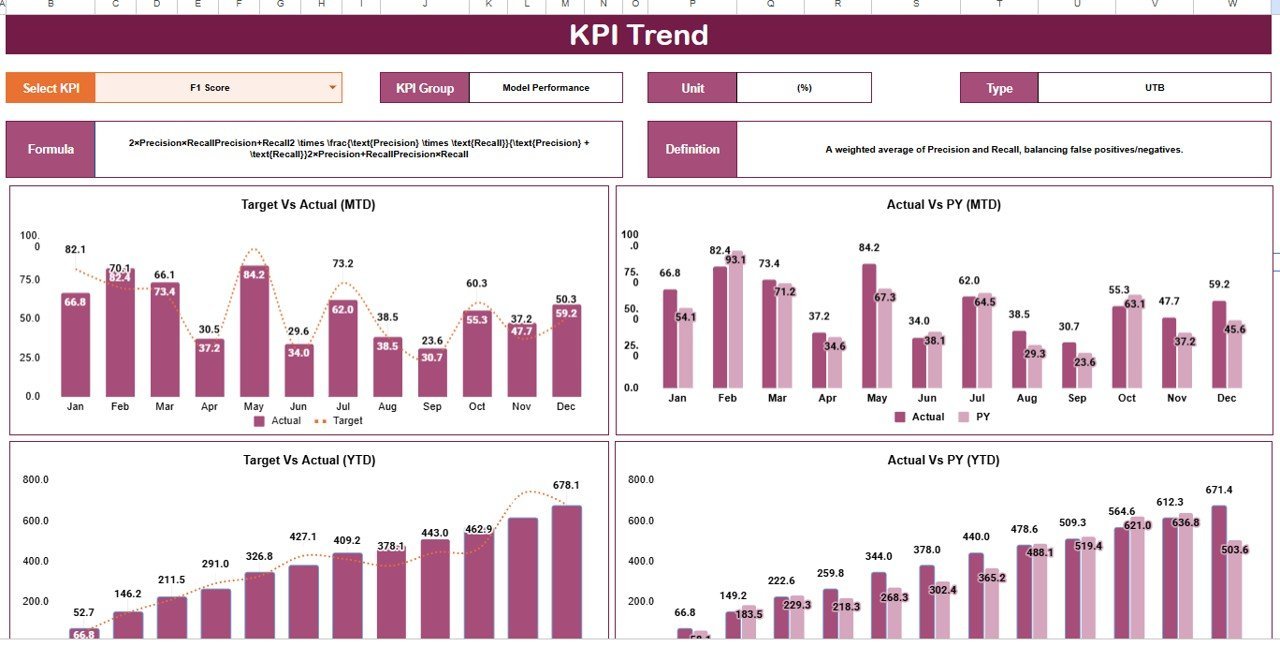
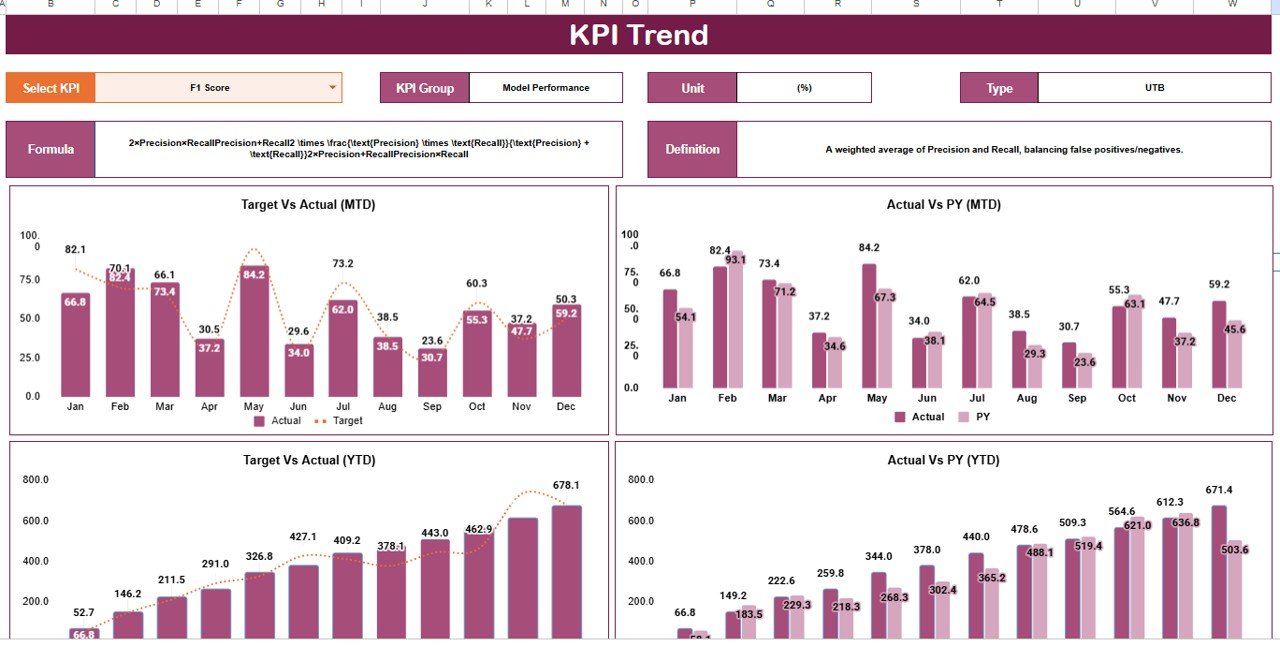
- KPI Trend tab – review Target vs Actual and Actual vs PY for MTD and YTD.
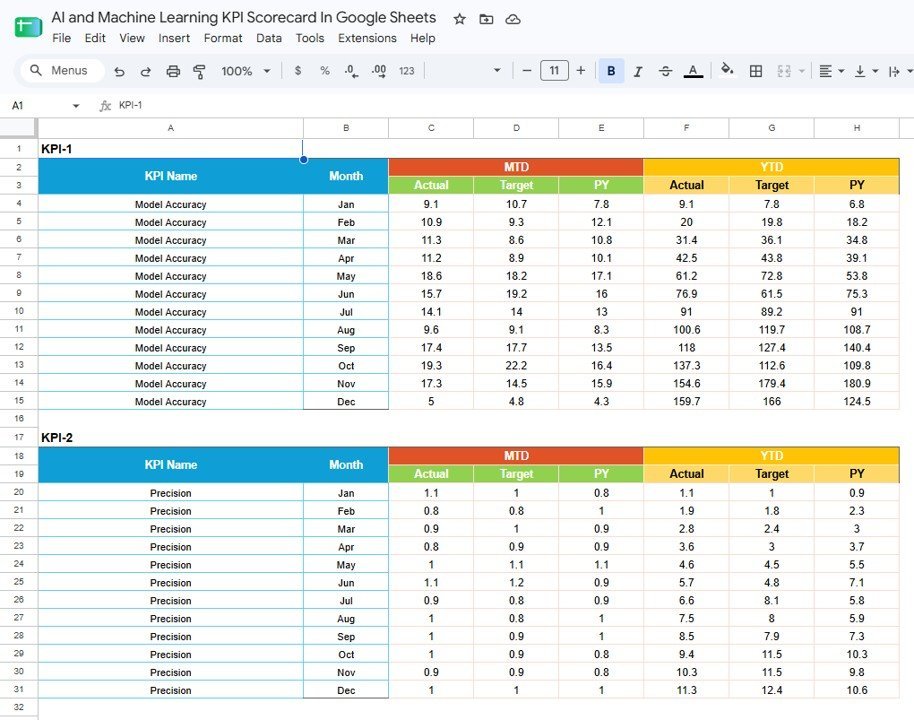
- KPI data sheet – maintain monthly values in a clean structure that feeds the visuals.
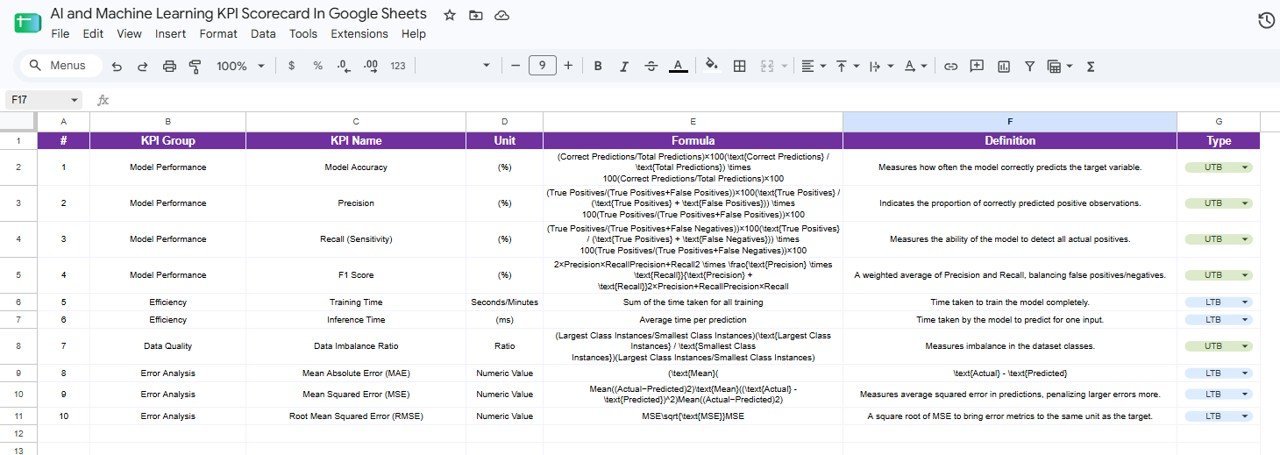
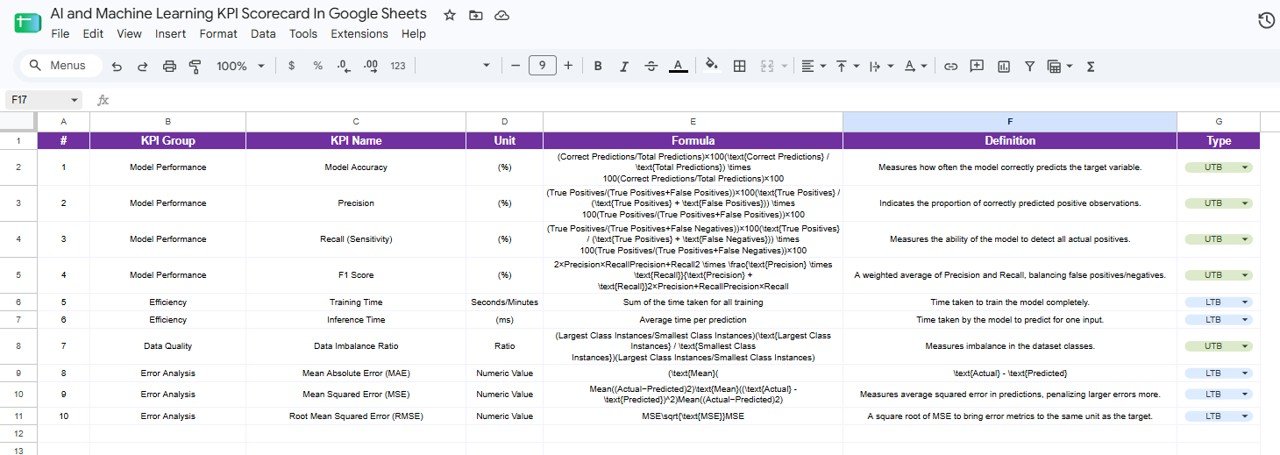
- KPI definition setup – document unit, formula, definition, group, and KPI type.
- RAG status logic – set different change-percent color rules for upper-the-better and lower-the-better KPIs.
- Google Sheets sharing – collaborate through Drive and keep the scorecard accessible to technical and non-technical stakeholders.
What’s Inside the AI and Machine Learning KPI Scorecard In Google Sheets
1 – Overview Page
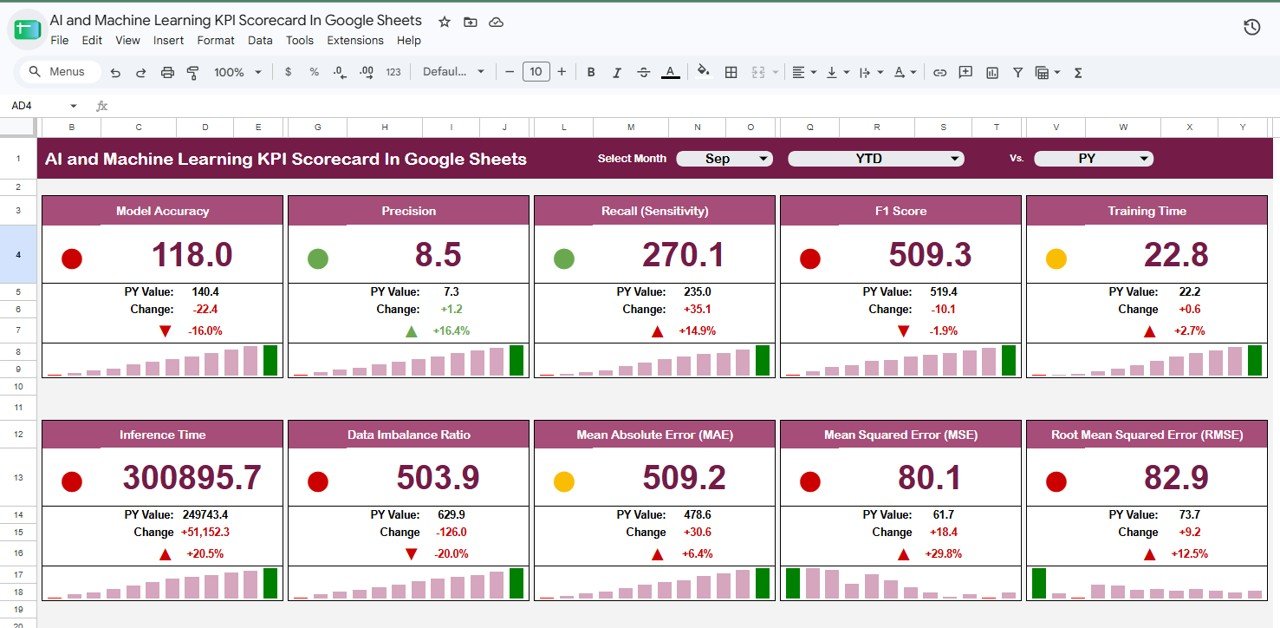
The Overview Page shows the 10 KPI cards across the top so leadership can read model health quickly before checking the charts. The monthly charts show Model Accuracy, Precision, Recall, F1 Score, Training Time, Inference Time, Data Imbalance Ratio, MAE, MSE, and RMSE by month, with slicers for fast filtering.
2 – KPI Trend
The KPI Trend tab focuses on target and historical comparison. It includes Target vs Actual by Month (MTD), Actual vs PY by Month (MTD), Target vs Actual by Month (YTD), and Actual vs PY by Month (YTD), so each selected KPI can be reviewed across current and year-to-date views.
3 – KPI Data Sheet
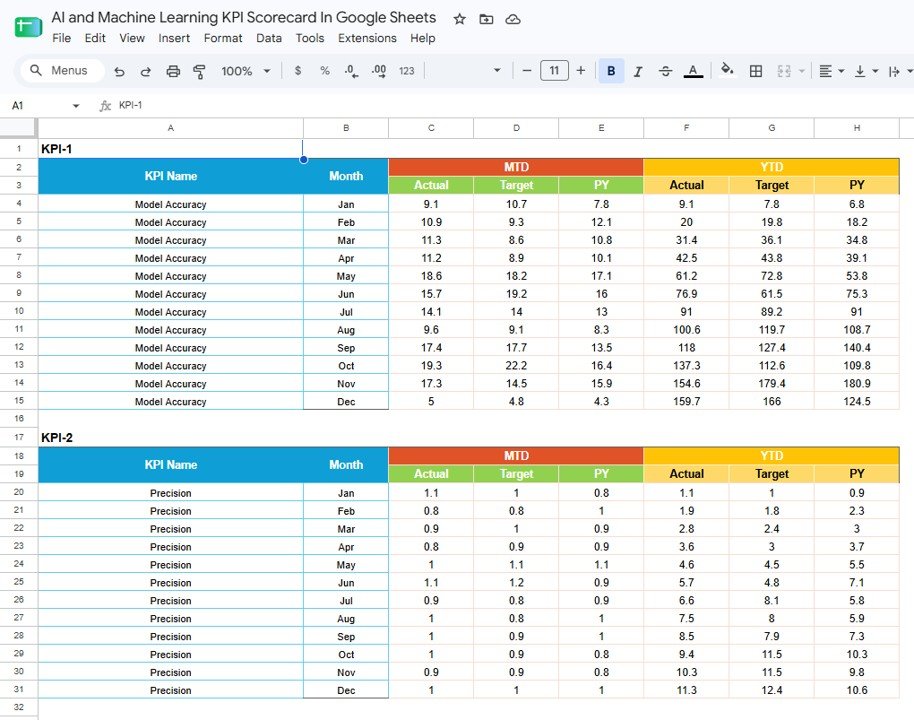
The KPI Data Sheet stores the reporting values behind the scorecard. It supports MTD Actual, Target, and PY by Month, YTD Actual, Target, and PY by Month, Model Accuracy by Month, Precision by Month, and KPI Records by KPI Name.
4 – KPI Definition Setup
The KPI Definition Setup tab keeps the scorecard governed. It lists KPI Group by KPI Name, Unit by KPI Name, Formula by KPI Name, Definition by KPI Name, and Type by KPI Name, which helps teams read the numbers consistently.
5 – RAG Table for Change%
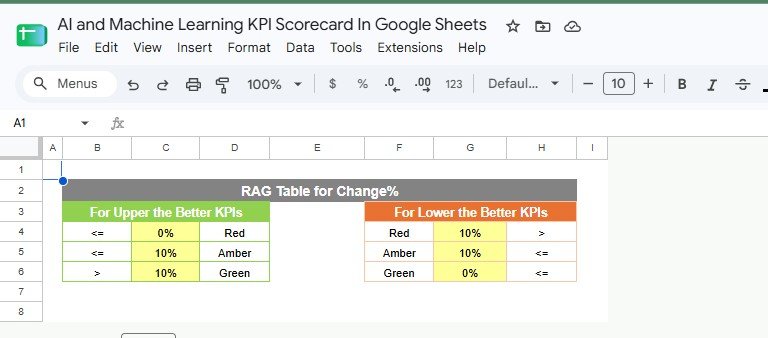
The RAG Table controls status color by change percent. It separates rules for upper-the-better KPIs and lower-the-better KPIs, so a higher accuracy score and a lower inference-time value are both interpreted correctly.
AI and Machine Learning KPI Scorecard In Google Sheets vs. Microsoft Excel Scorecard vs. Paid MLOps/SaaS – Where This Fits
| Feature | This Google Sheets scorecard | Microsoft Excel scorecard | Paid MLOps/SaaS tool |
|---|---|---|---|
| Cost | $8.99 sale price, one-time | Template cost plus Microsoft access | Monthly, annual, or usage-based fees |
| Platform | Google Sheets in browser | Excel desktop or web | Vendor-hosted web app |
| Setup time | Copy file, edit KPIs, enter monthly data | Open workbook and maintain locally | Requires onboarding and integrations |
| Real-time collaboration | Native Google Drive sharing | Requires OneDrive or SharePoint | Usually included by plan |
| Custom KPI formulas | Editable definition setup tab | Editable workbook | Depends on vendor model |
| Share with link | Yes, with Drive permissions | Yes, if cloud-hosted | Usually login-controlled |
| Year-1 cost at 5 users | $8.99 before workspace costs | Template plus software access | Often hundreds or thousands |
| Best fit | Monthly AI KPI review and target tracking | Offline spreadsheet reporting | Live telemetry, alerts, and experiment tracking |
Who This Template Is For – and Who It’s Not For
This template is for machine learning leads, AI project managers, data science teams, analytics managers, software departments, consultants, and leadership teams that need a clear monthly model-performance review in Google Sheets.
It is not a live model-monitoring platform, experiment tracker, API connector, governance system, or automatic drift detector. If you need production alerts, lineage, role-based controls, or automated telemetry, use this scorecard as a reporting companion to your MLOps stack.
How to Use the AI and Machine Learning KPI Scorecard In Google Sheets
- Open the PDF guide from your download and copy the Google Sheets template into your Drive.
- Review the KPI Definition Setup tab and adjust formulas, units, definitions, and KPI type if needed.
- Enter monthly Actual, Target, and Previous Year values in the KPI Data Sheet.
- Use the Overview Page to review all KPIs together.
- Open KPI Trend when you need one selected KPI’s target and prior-year movement.
- Adjust the RAG Table if your team uses different change-percent thresholds.
Real-World Use Cases
Priya, machine learning lead: reviews Model Accuracy, Precision, Recall, and F1 Score before a monthly model-quality meeting.
Marcus, AI operations manager: checks Training Time and Inference Time to see whether model improvements are increasing runtime cost.
Elena, analytics director: uses MAE, MSE, and RMSE trend views to compare forecast-model performance against target and prior-year baselines.
Frequently Asked Questions
What KPIs are included?
The scorecard includes Model Accuracy, Precision, Recall, F1 Score, Training Time, Inference Time, Data Imbalance Ratio, MAE, MSE, and RMSE.
Does this connect automatically to ML platforms?
No. It is a Google Sheets scorecard for structured KPI entry and reporting. You can paste exports from your ML tools or extend the sheet later with your own connector workflow.
Can I change the KPI list?
Yes. Edit KPI names, formulas, units, definitions, groups, and KPI types in the KPI Definition Setup tab.
How does the RAG table work?
The RAG table maps change percent to status colors. It includes separate logic for upper-the-better KPIs, such as accuracy, and lower-the-better KPIs, such as error or time metrics.
Can multiple people work in the scorecard?
Yes. After copying it to Google Drive, you can share it with view, comment, or edit access like any other Google Sheets file.
What do I receive after purchase?
For Google Sheets products, the download is normally a PDF guide with the Make a copy link and setup notes.
About the Author
Built by PK – Microsoft Certified Professional with 15+ years of Excel, Google Sheets, and Power BI experience. Founder of NextGenTemplates, reaching 300K+ subscribers across YouTube channels. Every template is hand-built and tested before release.
Explore Related Templates
- AI & Machine Learning KPI Dashboard in Google Sheets – the broader dashboard version of this AI/ML reporting theme.
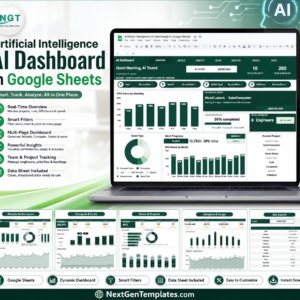
- Artificial Intelligence AI Dashboard in Google Sheets – project, compute, cost, and adoption analysis.
- Web Development KPI Dashboard in Google Sheets – website and technical performance KPIs.
- Google Analytics KPI Dashboard in Google Sheets – web analytics targets and trend reporting.
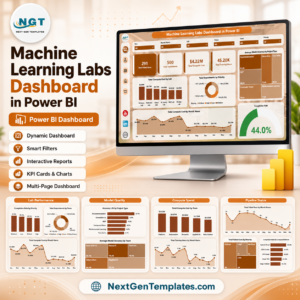
- Machine Learning Labs KPI Dashboard in Power BI – a Power BI alternative for ML lab KPIs.
- Browse more Google Sheets KPI dashboard templates and all Google Sheets templates.
Get the AI and Machine Learning KPI Scorecard In Google Sheets to track model accuracy, precision, recall, error, runtime, and target status in one editable monthly scorecard.
Watch the step-by-step video Demo:
Last updated: 18 August 2026.






























Reviews
There are no reviews yet.