

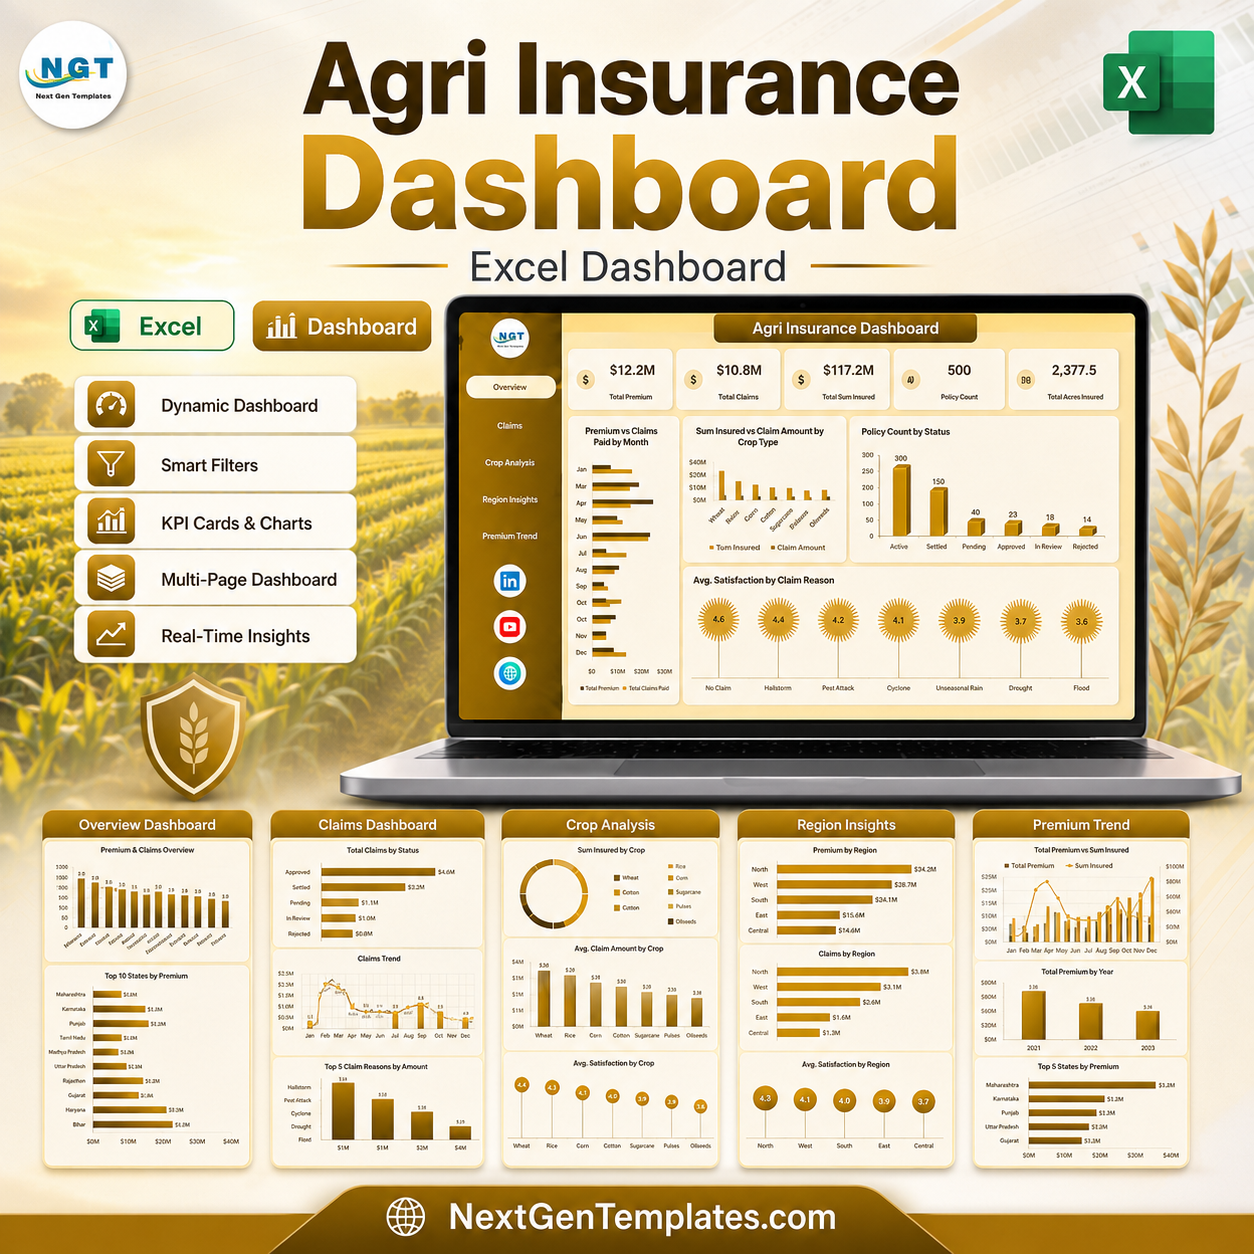
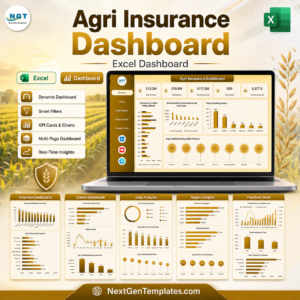
Agri Insurance Dashboard in Excel gives agricultural insurers, crop insurance teams, farm-risk analysts, and cooperative managers a ready reporting workbook for premium, claims, sum insured, policy status, crop type, region, subsidy, settlement, and loss ratio analysis. A crop insurance portfolio can include thousands of policies across seasons, districts, crops, farmer categories, channels, and claim reasons; this dashboard turns those records into 5 focused Excel pages for a $17.99 one-time sale price. It is a downloadable Excel dashboard with sample data, slicers, KPI cards, charts, and a practical refund-friendly digital product workflow.
Key Features of Agri Insurance Dashboard in Excel
- 5 dashboard pages: Overview, Claims, Crop Analysis, Region Insights, and Premium Trend.
- 5 high-level cards: Total Premium, Total Claim Paid, Total Sum Insured, Policy Count, and Total Area Insured.
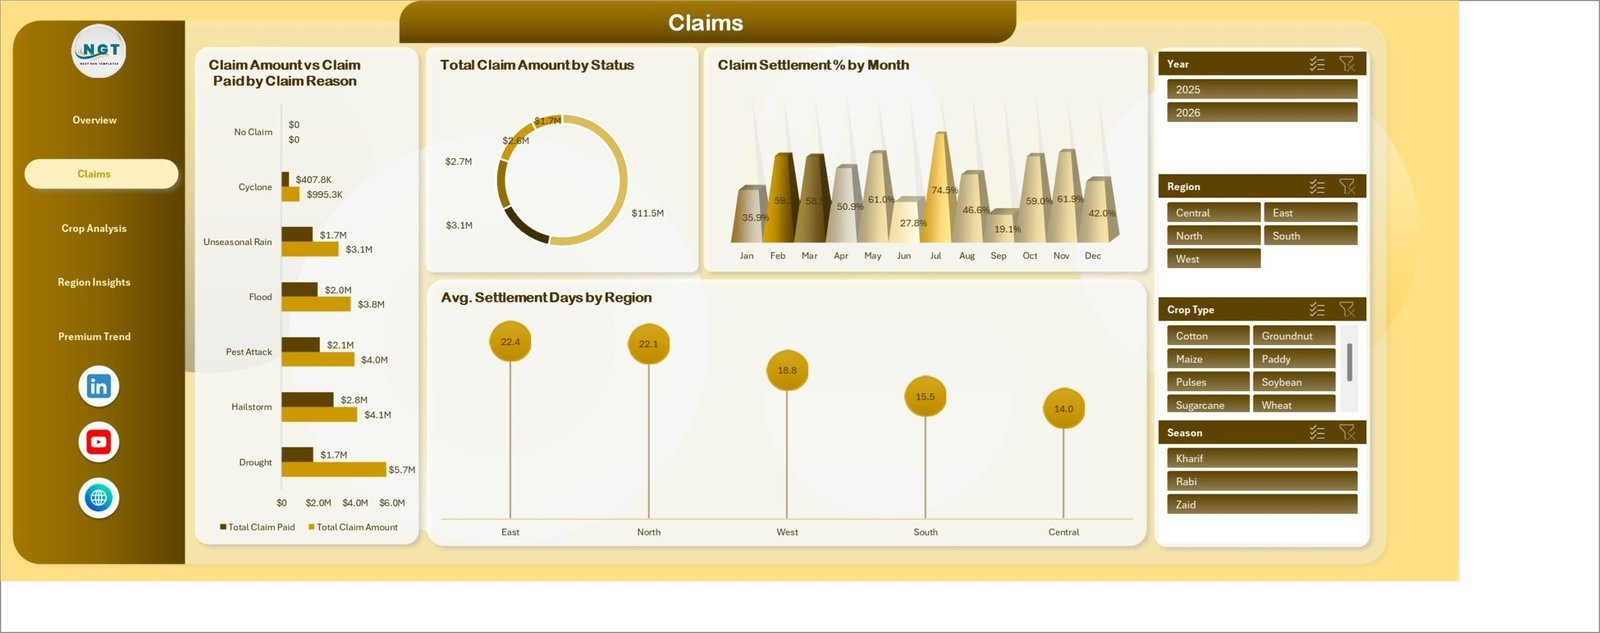
- Insurance claim analysis: Compare claim amount, claim paid, settlement percentage, settlement days, claim reasons, and statuses.
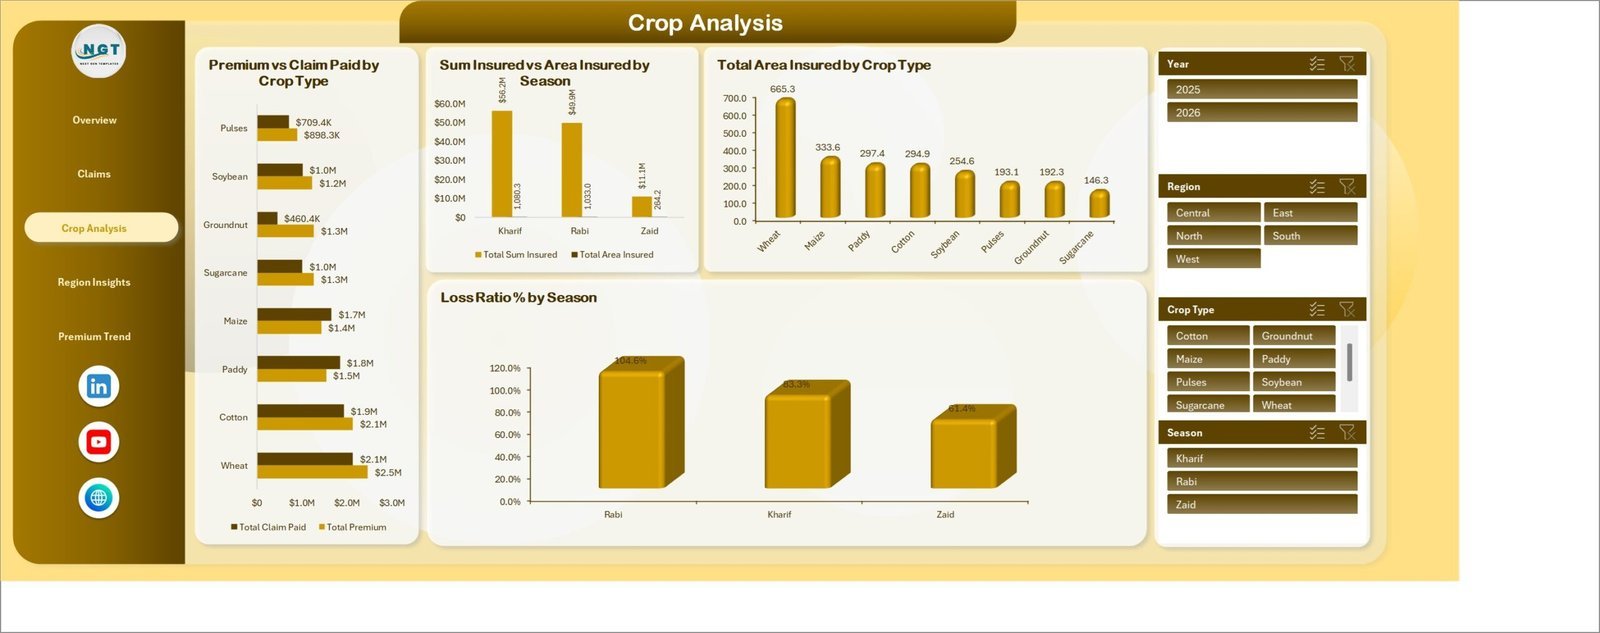
- Crop-level reporting: Review premiums, claim paid, sum insured, area insured, and loss ratio by crop type and season.
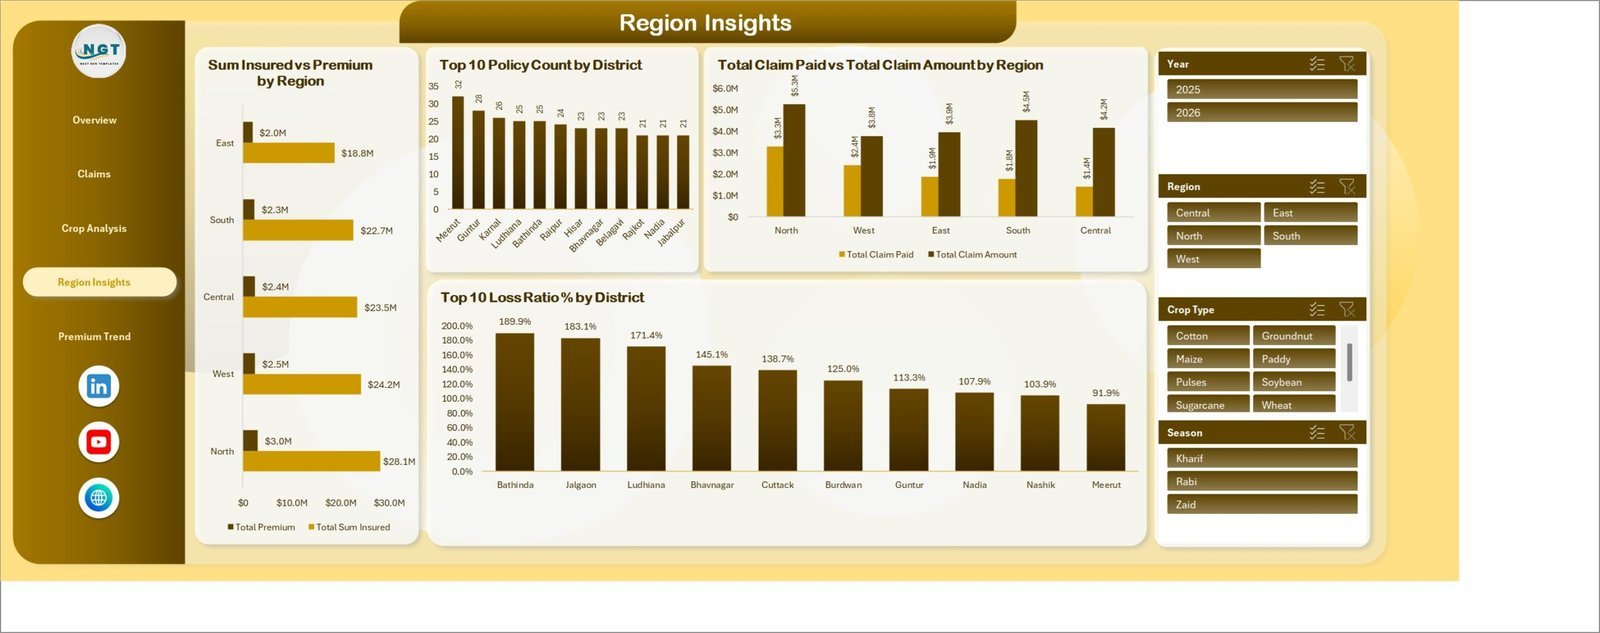
- Regional insights: Analyze region and district performance for policy count, premium, claims, sum insured, and loss ratio.
- Premium and subsidy trends: Track premium, subsidy, retained premium, channels, quarters, and farmer categories.
- Interactive slicers: Filter the workbook quickly without changing formulas or rebuilding reports.
What’s Inside the Agri Insurance Dashboard in Excel
1. Overview Page
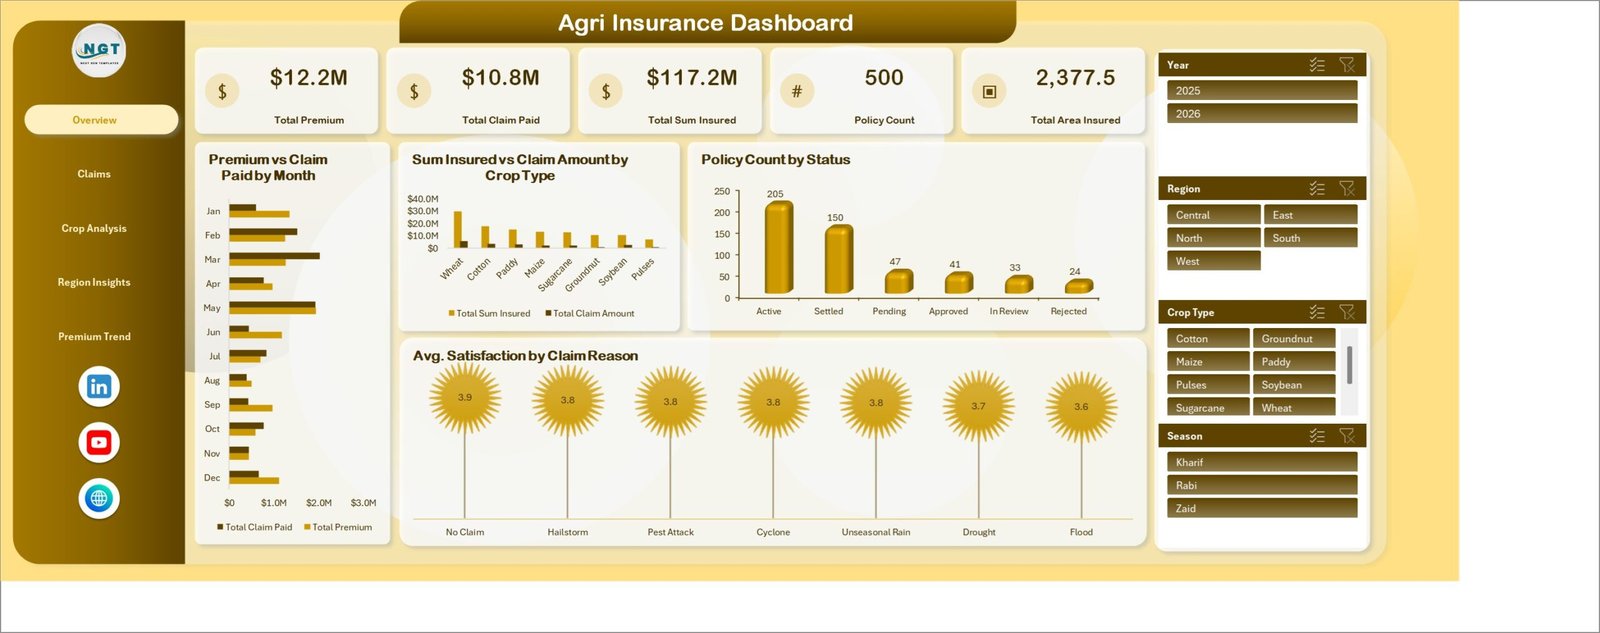
The Overview page summarizes the most important agri insurance metrics in one view. The cards show Total Premium, Total Claim Paid, Total Sum Insured, Policy Count, and Total Area Insured, helping teams see portfolio size, risk exposure, claim payouts, and insured acreage before moving into detailed pages.
Premium vs Claim Paid by Month: This chart compares premium inflow and paid claims month by month. It helps users identify months where claims are consuming a larger share of premium.
Sum Insured vs Claim Amount by Crop Type: This visual compares covered exposure against claim amount for each crop type. It helps underwriters spot crop categories with higher claim pressure.
Policy Count by Status: This chart shows how policies are distributed across statuses such as active, expired, pending, or closed. It helps operations teams monitor portfolio movement.
Average Satisfaction by Claim Reason: This chart connects claim reason with farmer satisfaction. It helps service teams understand which claim scenarios need better communication or faster resolution.
2. Claims
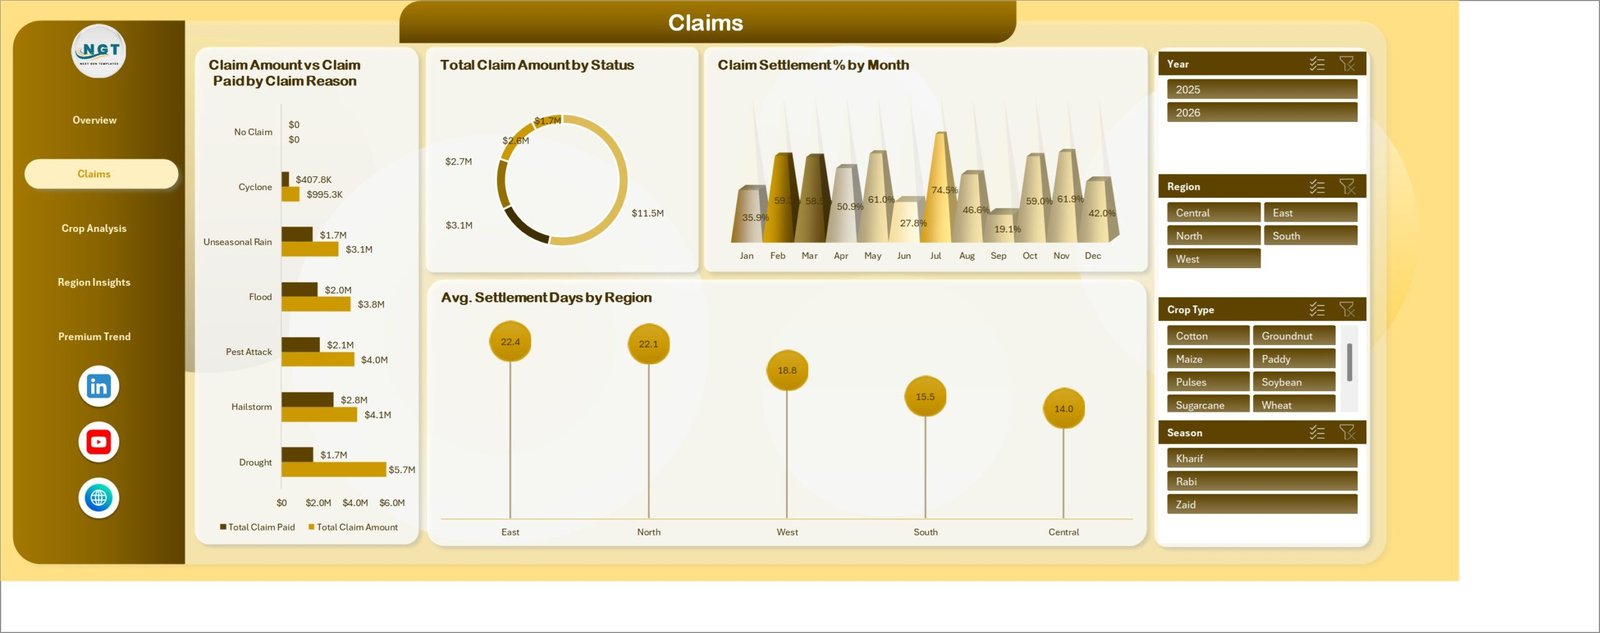
The Claims page focuses on claim behavior and settlement performance. It includes Claim Amount vs Claim Paid by Claim Reason, Total Claim Amount by Status, Claim Settlement Percentage by Month, and Average Settlement Days by Region.
3. Crop Analysis
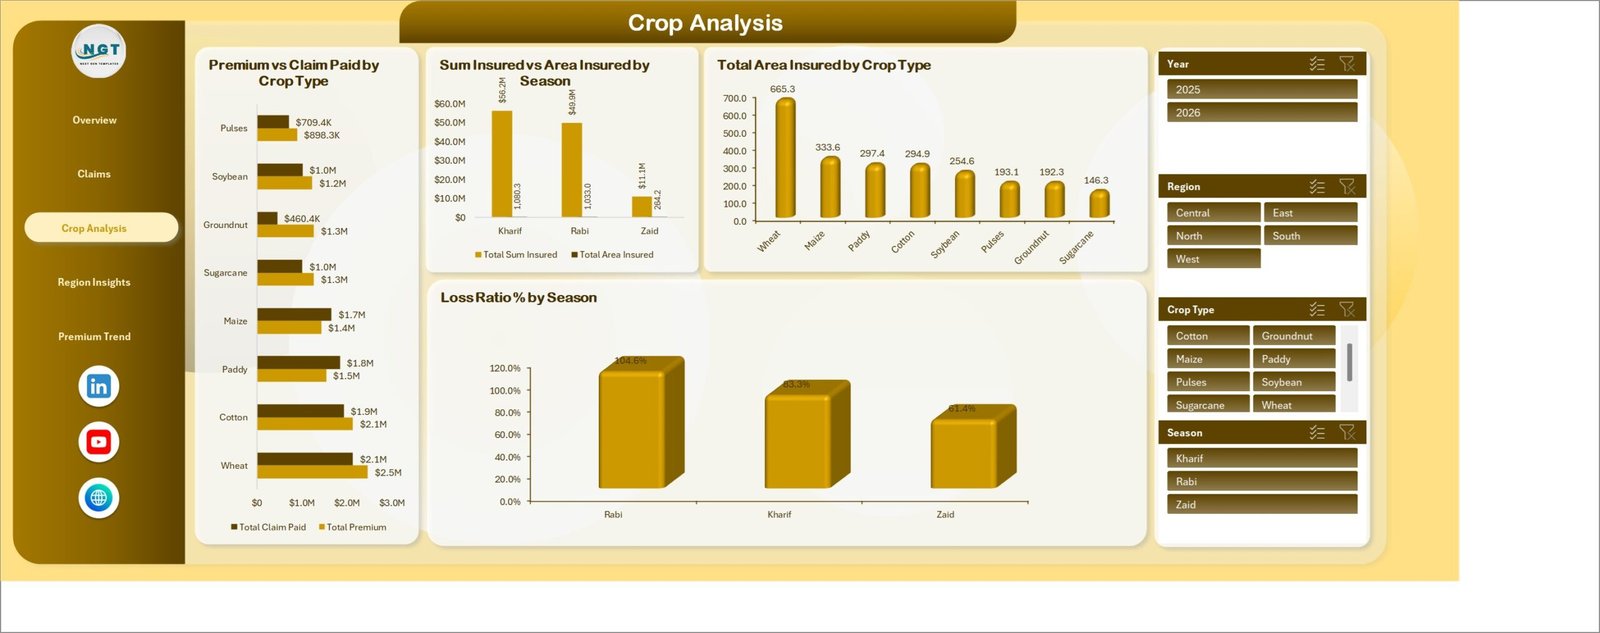
The Crop Analysis page helps users review crop-wise risk and insurance performance. It includes Premium vs Claim Paid by Crop Type, Sum Insured vs Area Insured by Season, Total Area Insured by Crop Type, and Loss Ratio Percentage by Season.
4. Region Insights
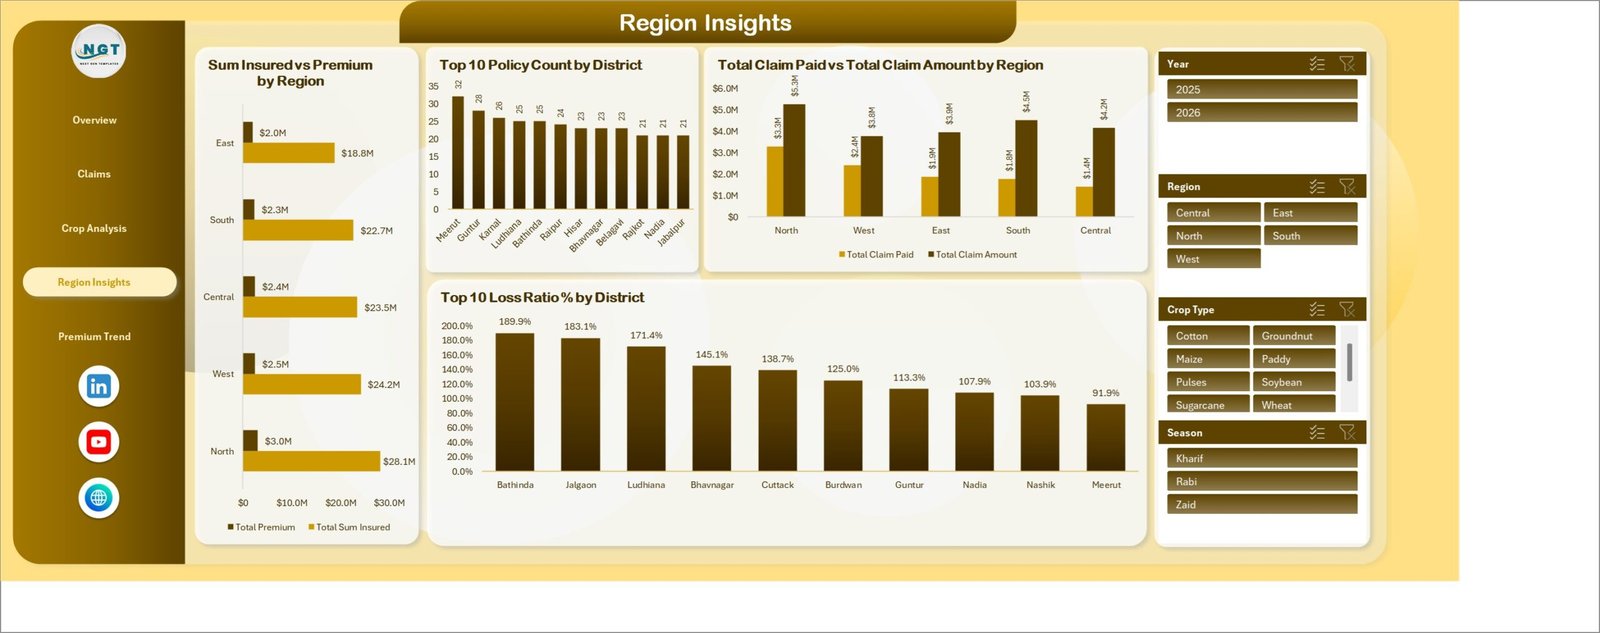
The Region Insights page compares geographic insurance performance. It includes Sum Insured vs Premium by Region, Top 10 Policy Count by District, Total Claim Paid vs Total Claim Amount by Region, and Top 10 Loss Ratio Percentage by District.
5. Premium Trend
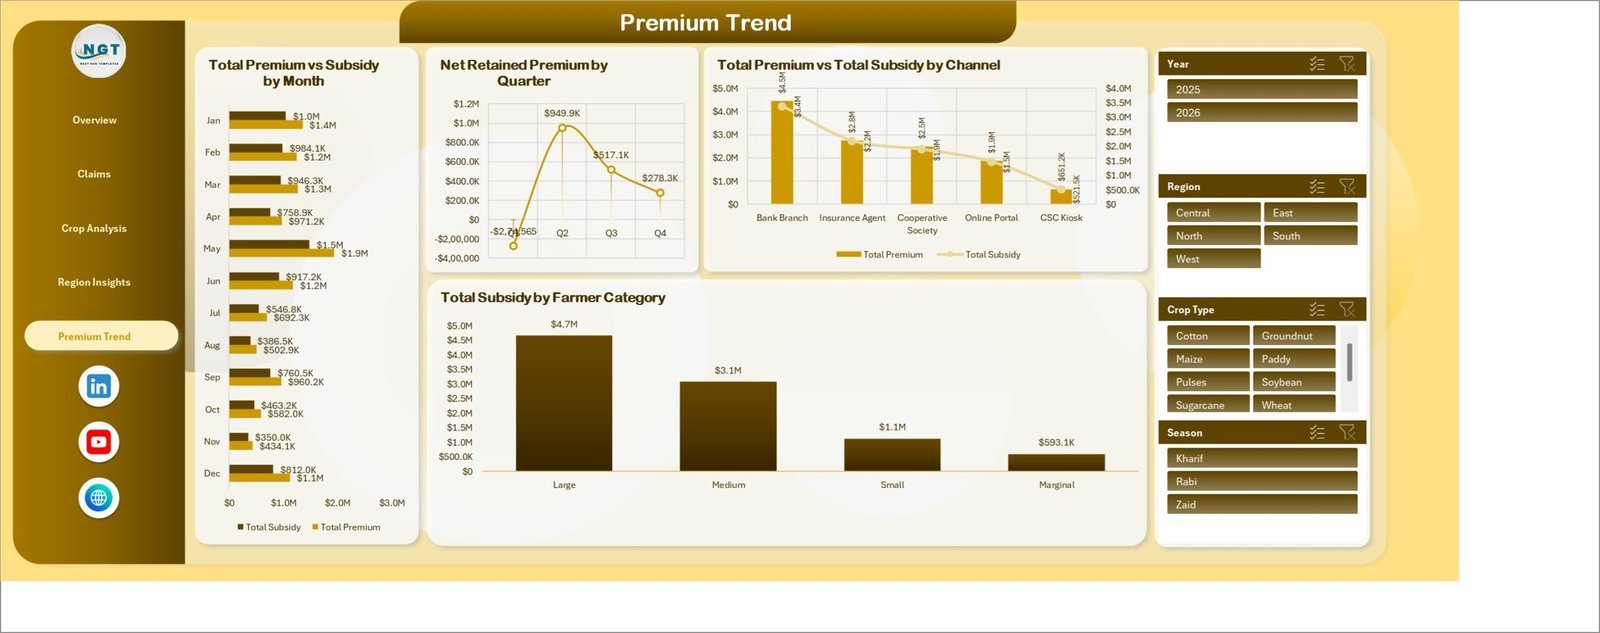
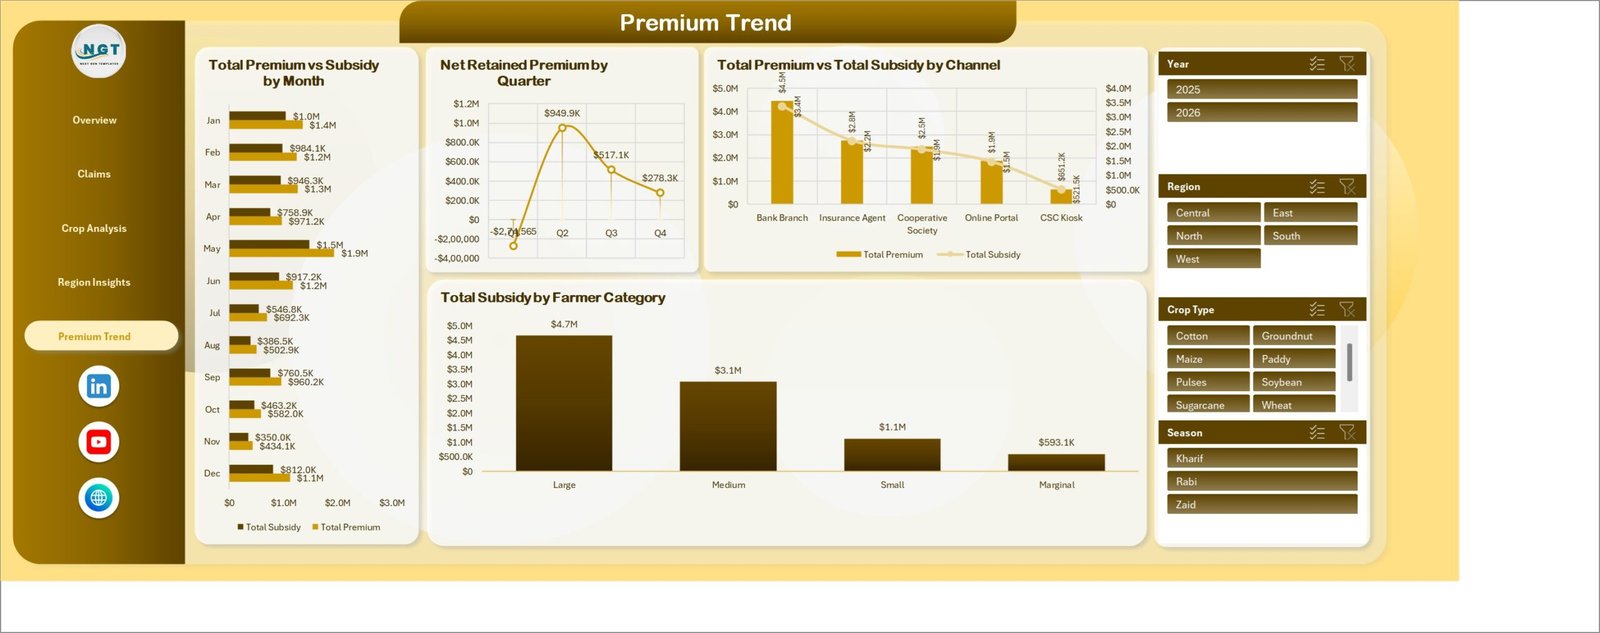
The Premium Trend page is built for finance and subsidy review. It includes Total Premium vs Subsidy by Month, Net Retained Premium by Quarter, Total Premium vs Total Subsidy by Channel, and Total Subsidy by Farmer Category.
Agri Insurance Dashboard in Excel vs. Google Sheets vs. Paid CRM/SaaS – Where This Fits
| Feature | This Excel dashboard | Google Sheets alternative | Paid insurance SaaS |
|---|---|---|---|
| Cost | $17.99 one-time sale price | Low software cost but manual build required | Recurring subscription |
| Platform | Microsoft Excel | Browser-based spreadsheet | Vendor-hosted application |
| Setup time | Replace data and refresh pivots | Build formulas, pivots, charts, and filters manually | Configuration and onboarding required |
| Real-time team collaboration | Available through OneDrive or SharePoint | Native browser collaboration | Usually included |
| Mobile access | Excel mobile or web for review | Google Sheets mobile app | Usually included |
| Customizable fields | Editable workbook, data, pivots, charts, and slicers | Editable but manual | Depends on vendor permissions |
| Share with link | Available through Microsoft 365 sharing | Native link sharing | Role-based access |
| Year-1 cost at 5 users | $17.99 plus Excel access if needed | Workspace cost plus build time | Often hundreds or thousands per year |
| Agri insurance metrics | Premium, claim paid, sum insured, policy count, area insured, settlement, loss ratio, subsidy, crop, season, region, district, and farmer category | Must be designed manually | Depends on reporting module |
Who This Template Is For – and Who It’s Not For
Best for: crop insurance teams, agriculture finance analysts, farm cooperatives, rural insurance branches, claims managers, underwriting support teams, and consultants preparing recurring portfolio reports in Excel.
Not for: teams needing policy issuance, claims workflow automation, payment processing, legal insurance documents, live API integrations, actuarial modeling, or a multi-user insurance administration system.
How to Use the Agri Insurance Dashboard in Excel
- Download and unzip the product file.
- Open the workbook in Microsoft Excel.
- Replace the sample records with your own agri insurance data in the same structure.
- Go to the Excel Data ribbon and click Refresh All.
- Use slicers to filter by crop, region, status, season, channel, claim reason, farmer category, and time period.
- Review the Overview first, then move into Claims, Crop Analysis, Region Insights, and Premium Trend for deeper decisions.
Real-World Use Cases
Anika, crop insurance manager: reviews total premium, paid claims, sum insured, and policy count before weekly portfolio meetings.
Rohan, regional claims lead: compares claim settlement percentage, settlement days, claim reasons, and region-level payouts to spot process delays.
Meera, agri finance analyst: tracks premium, subsidy, retained premium, channels, and farmer category subsidy trends before monthly reporting.
Frequently Asked Questions
What does this dashboard track?
It tracks premium, claim paid, claim amount, sum insured, policy count, area insured, policy status, claim reason, satisfaction, settlement percentage, settlement days, crop type, season, region, district, subsidy, channel, quarter, and farmer category.
Do I need advanced Excel skills?
No. Replace the sample data and click Refresh All. Users who know pivot tables can customize the workbook further, but basic use does not require advanced Excel skills.
Can I use my own crop insurance records?
Yes. Add your records in the same data structure and refresh the workbook so the cards, charts, slicers, and pages update.
Does this template require macros?
No. The dashboard is designed around Excel tables, pivot tables, charts, and slicers.
Can I filter by region, crop type, and claim reason?
Yes. The dashboard includes slicers so users can quickly create focused views for specific regions, crop types, claim reasons, statuses, channels, seasons, and time periods.
Is this a full insurance management system?
No. It is a reporting dashboard for prepared agri insurance data, not a policy administration or claims processing system.
About the Author
Built by PK – Microsoft Certified Professional with 15+ years of Excel, Google Sheets, and Power BI experience. Founder of NextGenTemplates, reaching 300K+ subscribers across YouTube channels. Every template is hand-built and tested before release.
Explore Related Templates
Pair this workbook with Insurance Agency Dashboard in Excel, Agriculture and Farm Dashboard in Excel, Remote Crop Monitoring Dashboard in Excel, and Insurance Policy and Premium Tracker in Google Sheets. Browse more Excel Dashboard templates and MS Excel templates.
Detailed blog post: Agri Insurance Dashboard in Excel.
Download the Agri Insurance Dashboard in Excel to review crop insurance premiums, claims, insured area, policy status, loss ratio, settlement performance, regional exposure, and subsidy trends in one editable workbook.
Last updated: August 11, 2026.





















Reviews
There are no reviews yet.