

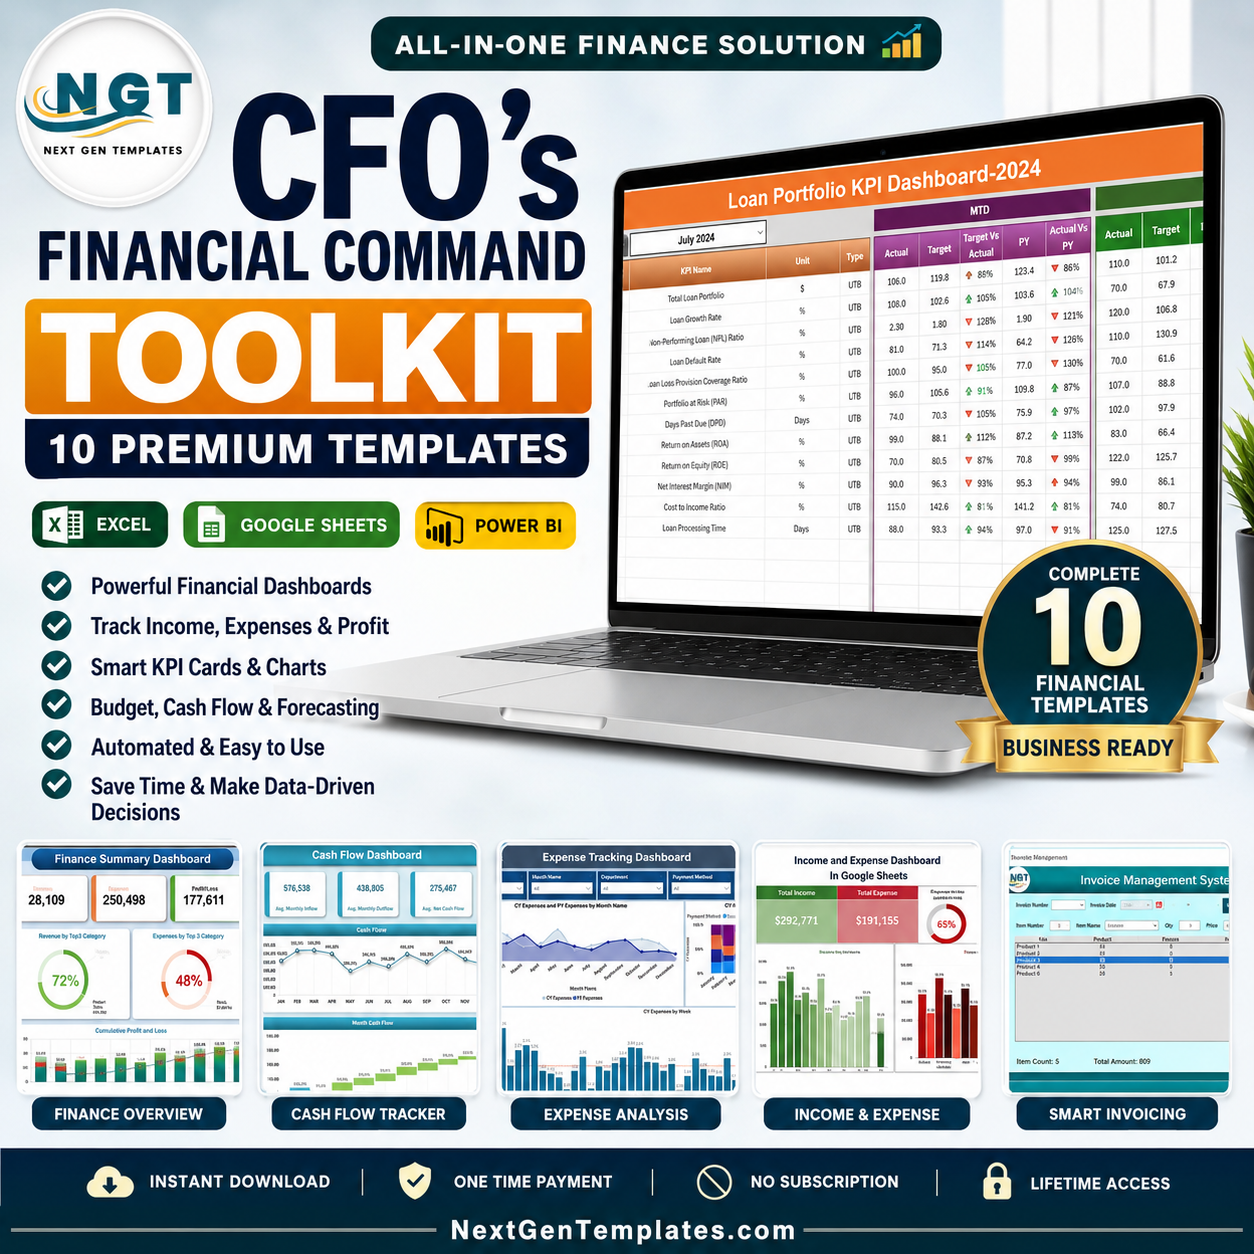


The CFO’s Financial Command Toolkit is a complete, role-built analytics arsenal for finance leaders who are tired of stitching together spreadsheets at 11pm before a board meeting. Instead of buying ten separate templates, you get every core finance function — cash flow, budgeting, expense control, invoicing, reimbursements, loan exposure and profit analysis — in a single package across Excel, Google Sheets and Power BI. Purchased individually these ten templates cost $111.90. As a bundle, you pay just $62.99 — a saving of $48.91 (44% off).
Every template is plug-and-play. Replace the sample data with your own numbers and every KPI card, chart, pivot and variance calculation refreshes instantly. No macros to configure, no BI consultant to hire, no monthly SaaS fee. This is the Financial Tools collection distilled into one CFO-grade command centre.
🔑 Key Features of the CFO’s Financial Command Toolkit
📊 Full-Spectrum Financial Coverage – Ten templates covering the entire CFO remit: liquidity, budget control, spend management, receivables, debt and profitability. Nothing left to build from scratch.
🔄 Three Platforms, One Price – Excel for deep modelling, Google Sheets for real-time team collaboration, Power BI for executive-level interactive reporting. Your whole finance function is covered regardless of what tools they live in.
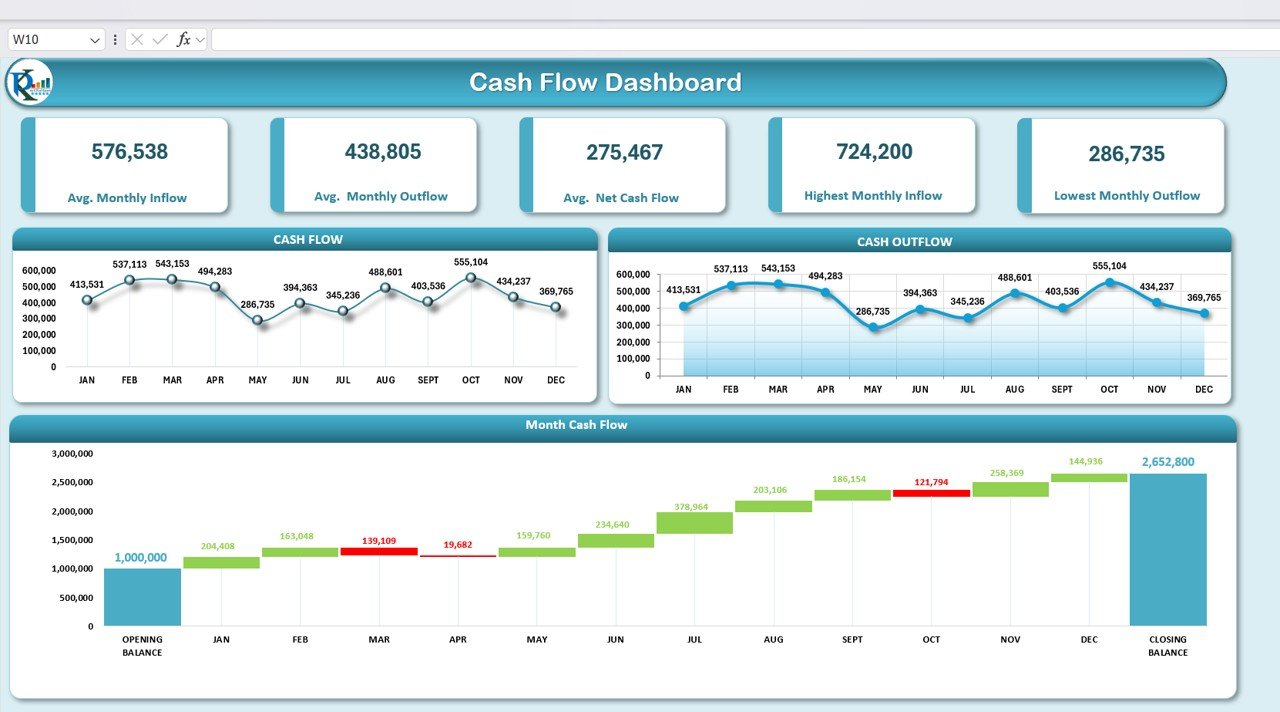
💰 Automated Cash Flow Waterfall – Track monthly inflows, outflows, net cash and closing balance with a built-in waterfall chart that shows exactly how you got from opening to closing position.
📈 Budget vs Actual Variance Control – Dynamic slicers, category breakdowns and automatic variance calculations so overspend is caught in-month, not in the year-end audit.
🏢 Enterprise Expense Analytics in Power BI – Current-year vs prior-year variance, department drill-down, employee-level spend, vendor comparison and payment method analysis with fully interactive filters.
🧾 Invoice & Reimbursement Workflow – A VBA-driven invoice management system for issuing and tracking receivables, plus a complete expense reimbursement tracker with approval status monitoring.
🏦 Loan Portfolio KPI Monitoring – Keep debt exposure, repayment schedules and portfolio health visible at all times — essential for covenant compliance and lender reporting.
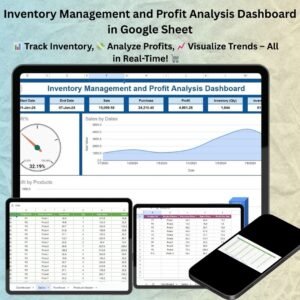
📦 Inventory Profit Analysis – Understand where margin is actually being made or lost at the SKU level, directly linked to stock movement.
⚡ Zero Setup Time – Open, paste your data, done. Every formula, pivot, chart and conditional format is pre-built and tested.
🎯 Built for Board Reporting – Clean, professional visuals that can go straight into a board pack without a design pass.
📦 What’s Inside the CFO’s Financial Command Toolkit
1. Finance Summary Dashboard in Excel — $17.99 | Excel
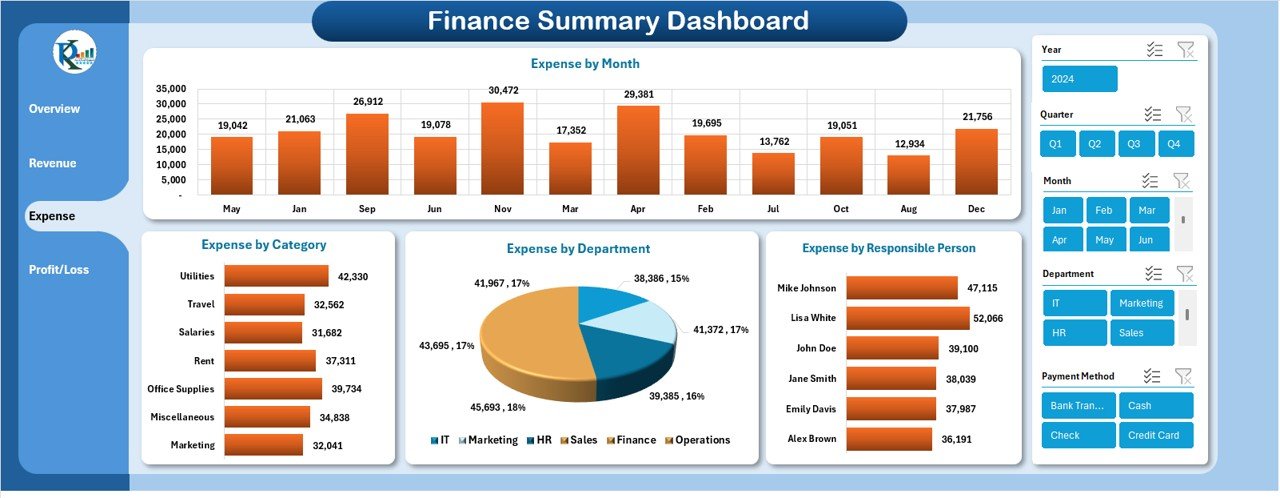
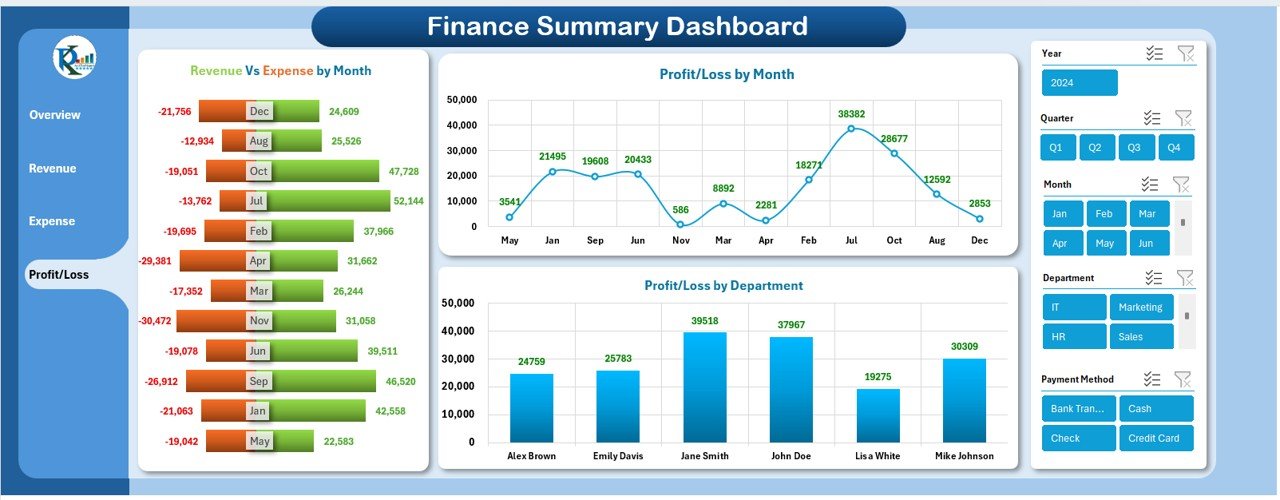
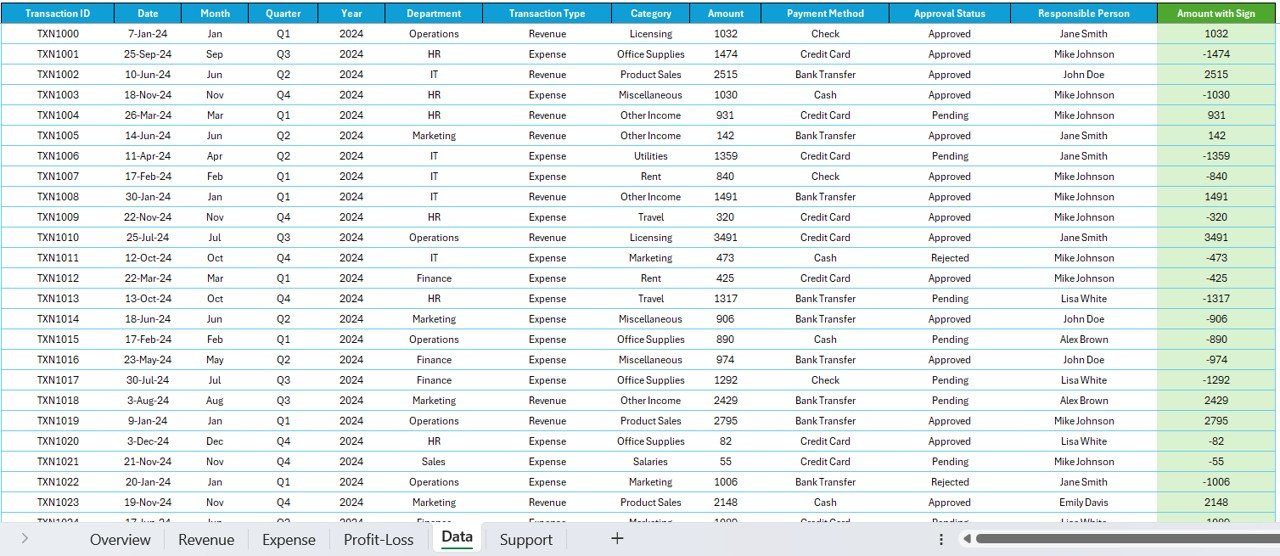
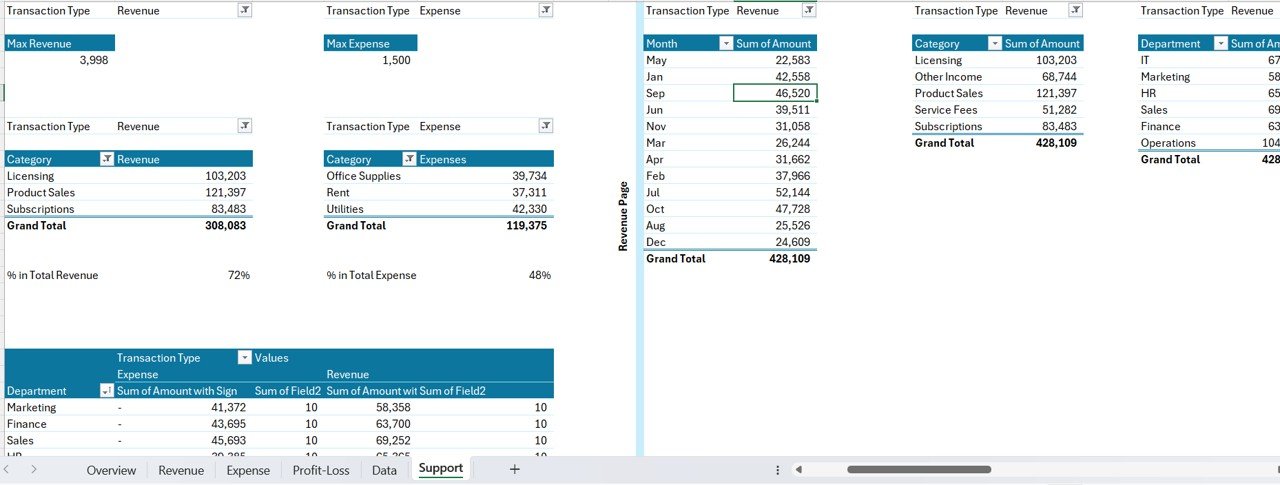
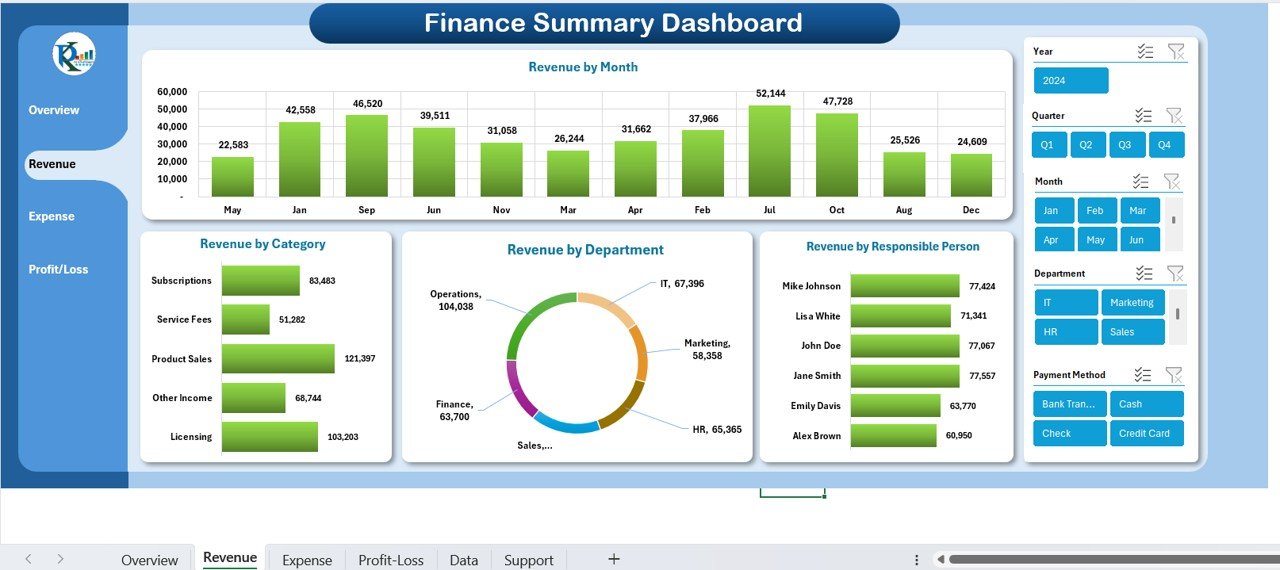
Your single-pane financial overview. Tracks income, expenses, profit margins, cash flow and net income with interactive charts and real-time reporting. This is the template you open first every morning.
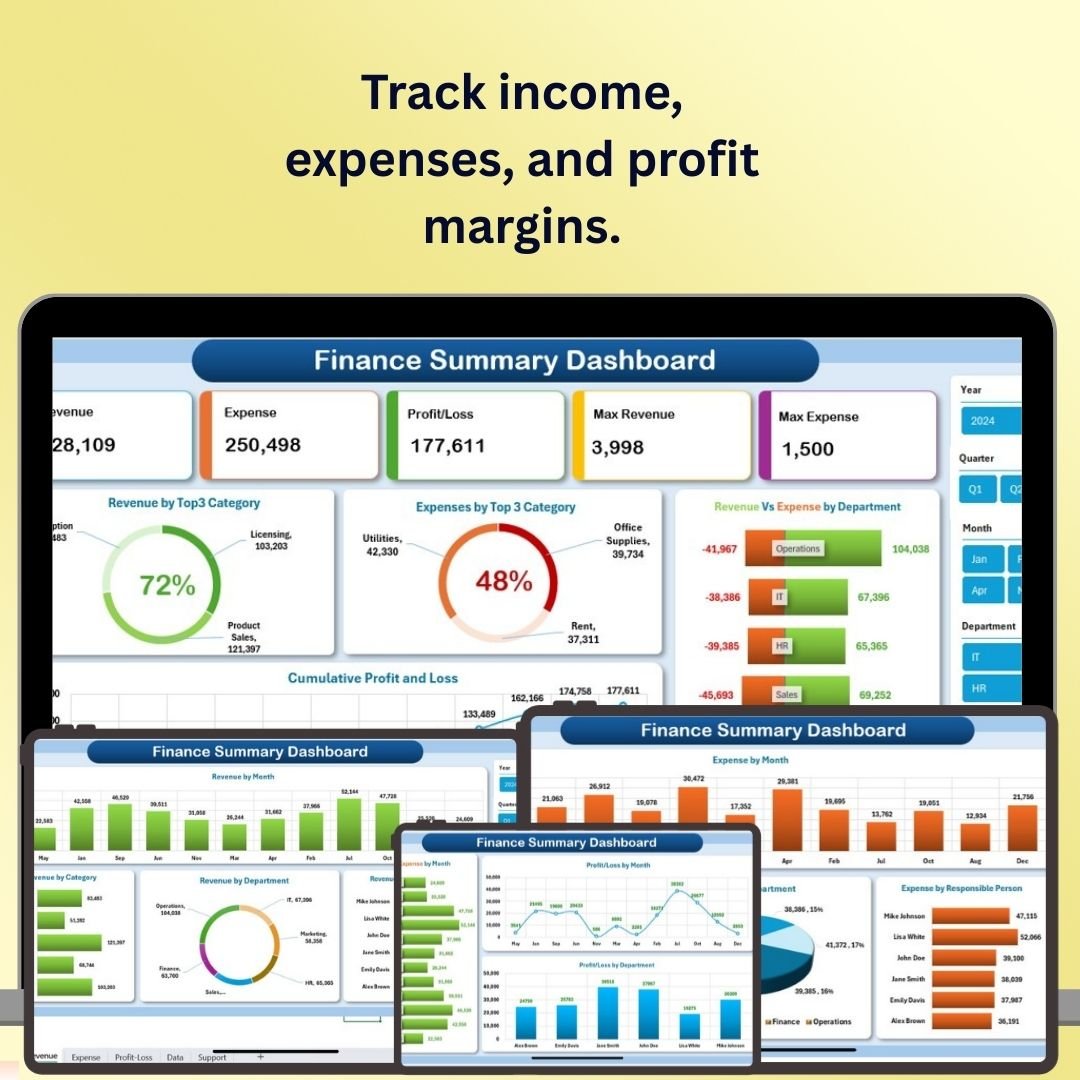 Finance Summary Dashboard in Excel
2. Cash Flow Template in Excel — $6.99 | Excel
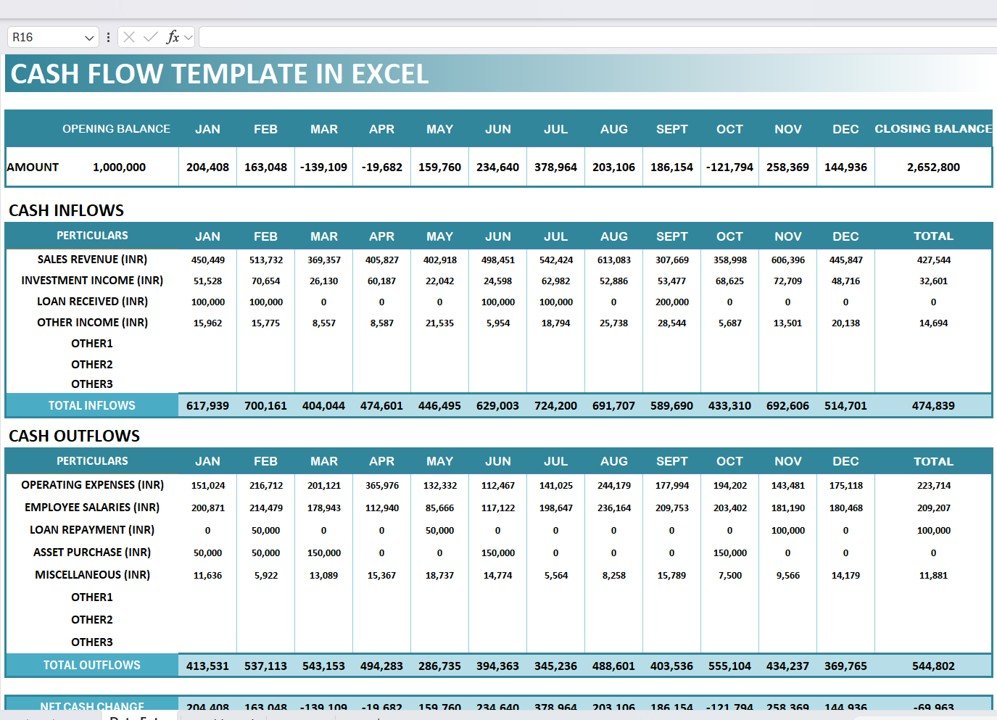
Monthly inflows and outflows with automatic net cash and closing balance calculations, plus a waterfall chart that visually explains every movement. Spot low-liquidity months before they become a crisis.
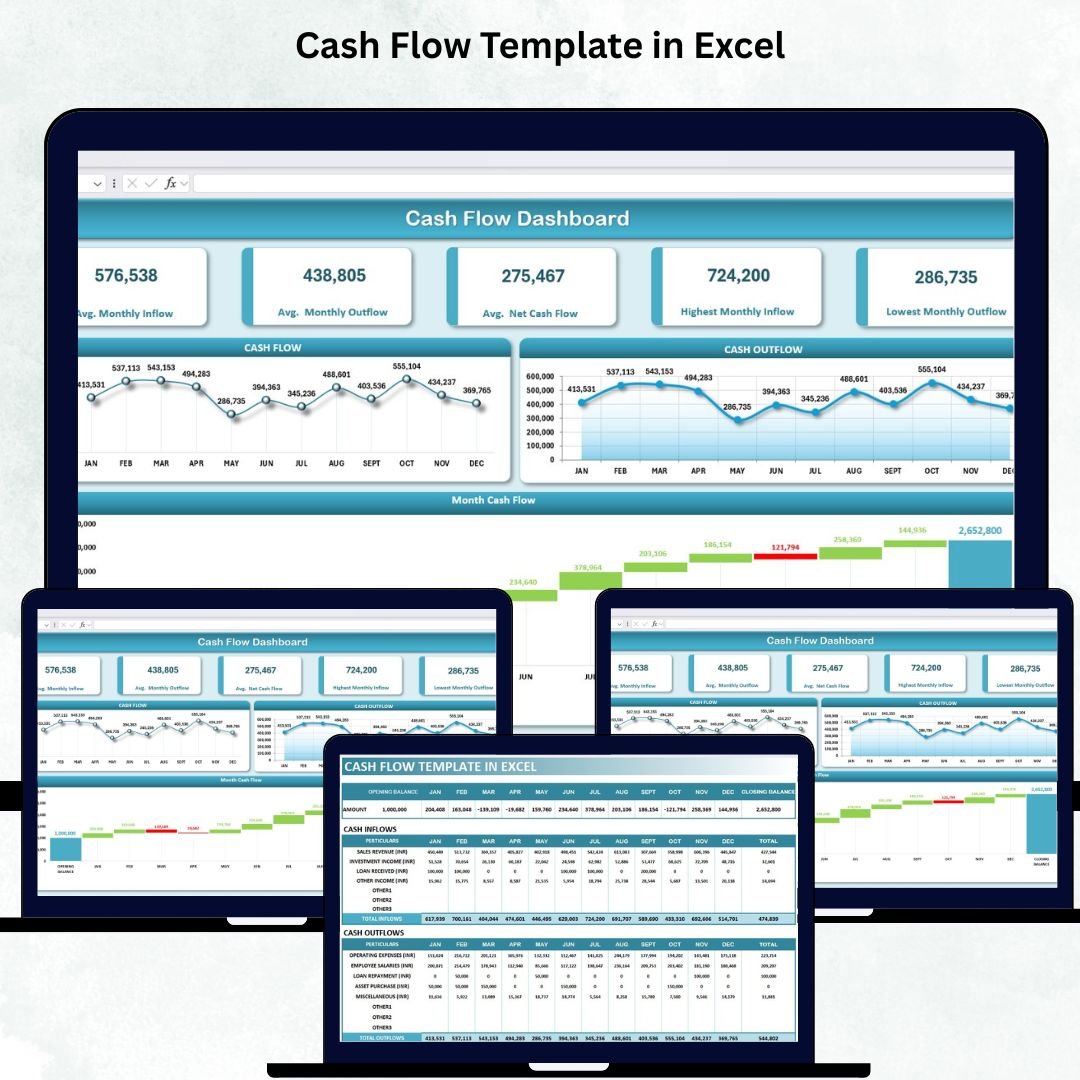 Cash Flow Template in Excel
3. Expense Tracking Dashboard in Power BI — $17.99 | Power BI
The heavyweight of the bundle. CY vs PY expense variance, department and project breakdowns, employee-level spend, top-vendor analysis and payment method distribution — all with dynamic slicers and drill-through.
 Expense Tracking Dashboard in Power BI
4. Monthly Budget Tracker in Microsoft Excel — $6.99 | Excel
Automated budget control with pivot-driven calculations, interactive slicers and customisable categories. Track income, expenses and savings against plan, month after month.
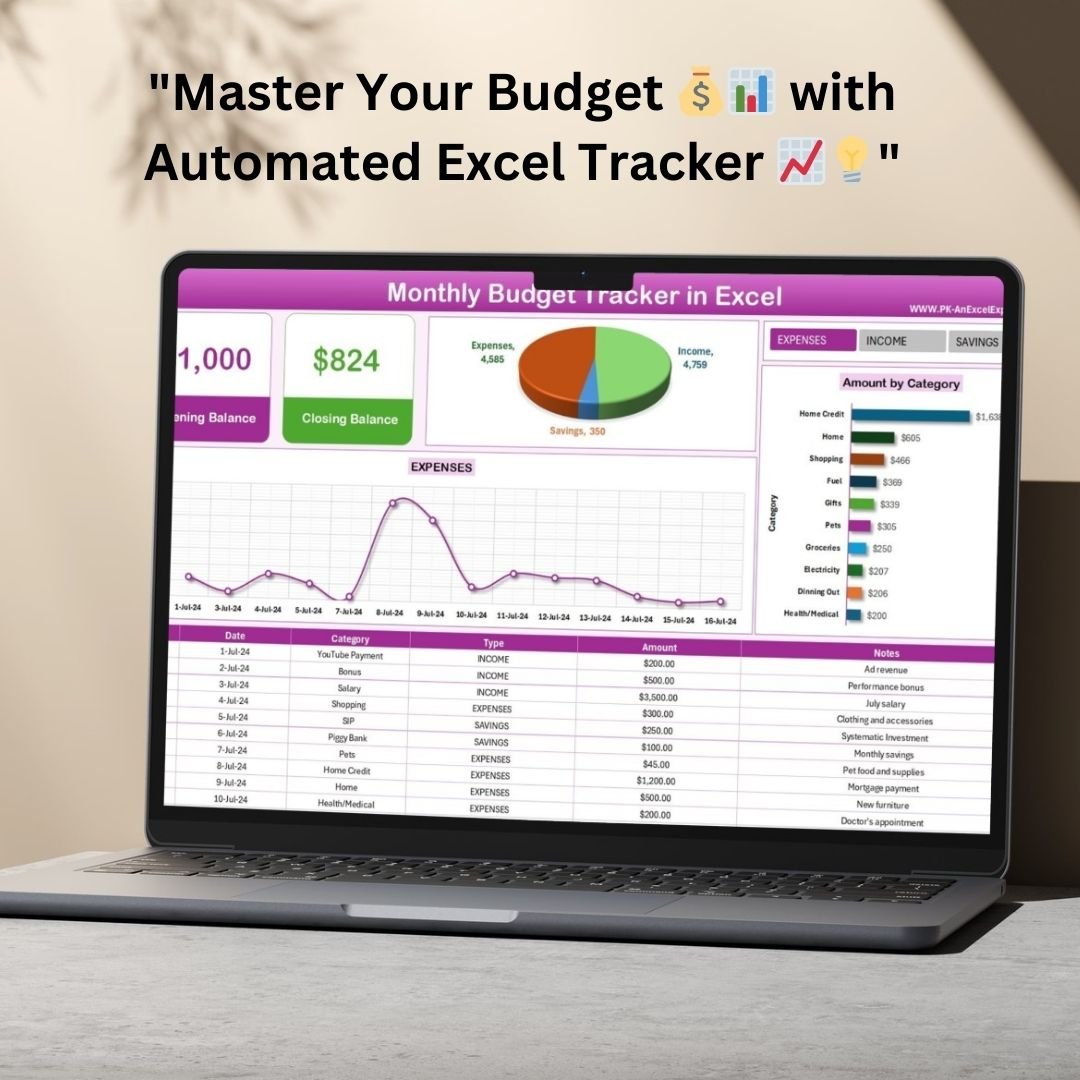 Monthly Budget Tracker in Microsoft Excel
5. Income and Expense Dashboard in Google Sheets — $9.99 | Google Sheets
Cloud-native income and expense tracking with automatic categorisation and live-updating charts. Ideal when multiple team members need to enter data simultaneously.
 Income and Expense Dashboard in Google Sheets
6. Loan Portfolio KPI Dashboard in Excel — $12.99 | Excel
Monitor debt exposure, loan performance KPIs and repayment health across your entire portfolio. Critical for covenant tracking and lender reporting.
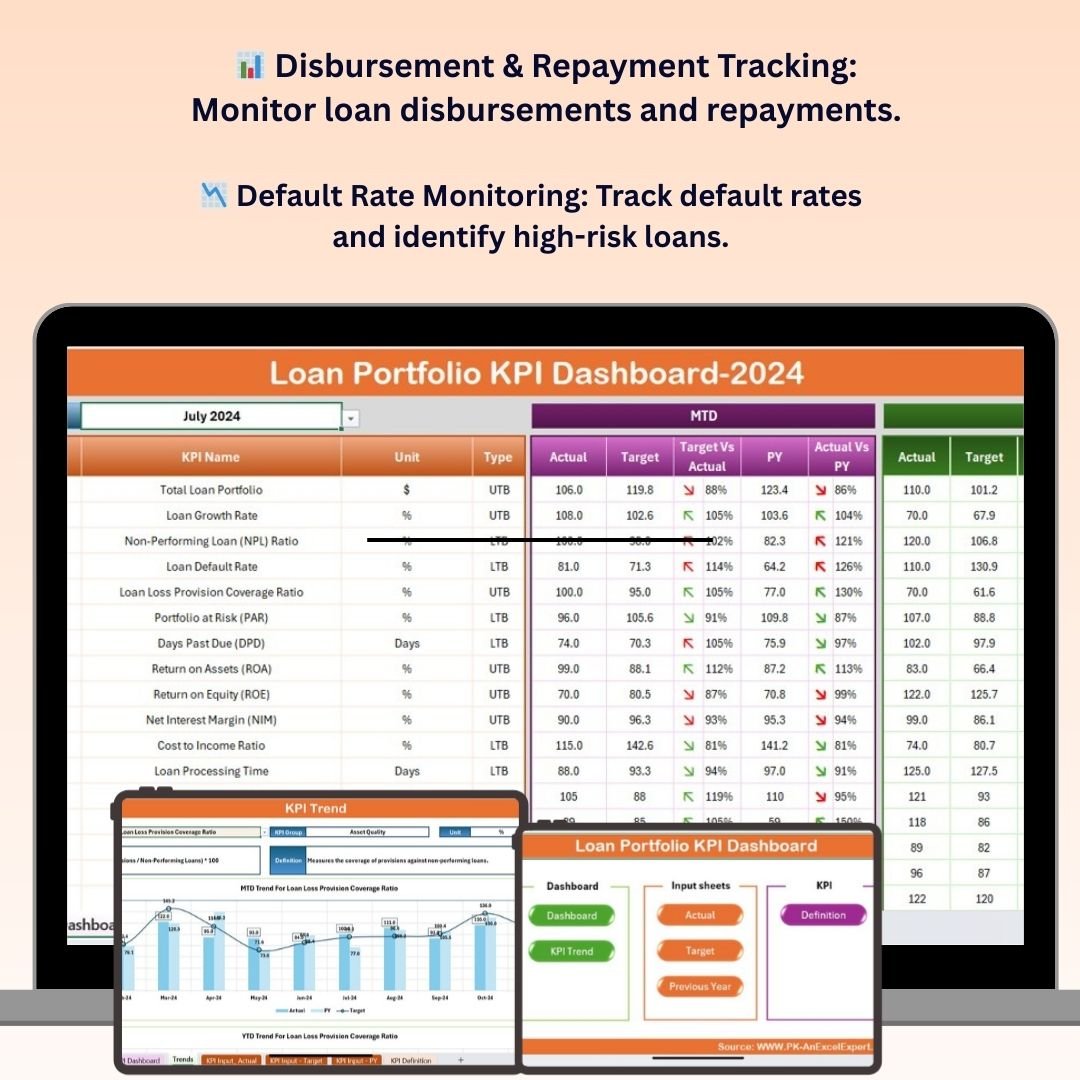 Loan Portfolio KPI Dashboard in Excel
7. Invoice Management System V1.0 — $6.99 | Excel VBA
A working invoice management system with VBA automation — create, store, search and print invoices, and keep receivables visible instead of buried in an inbox.
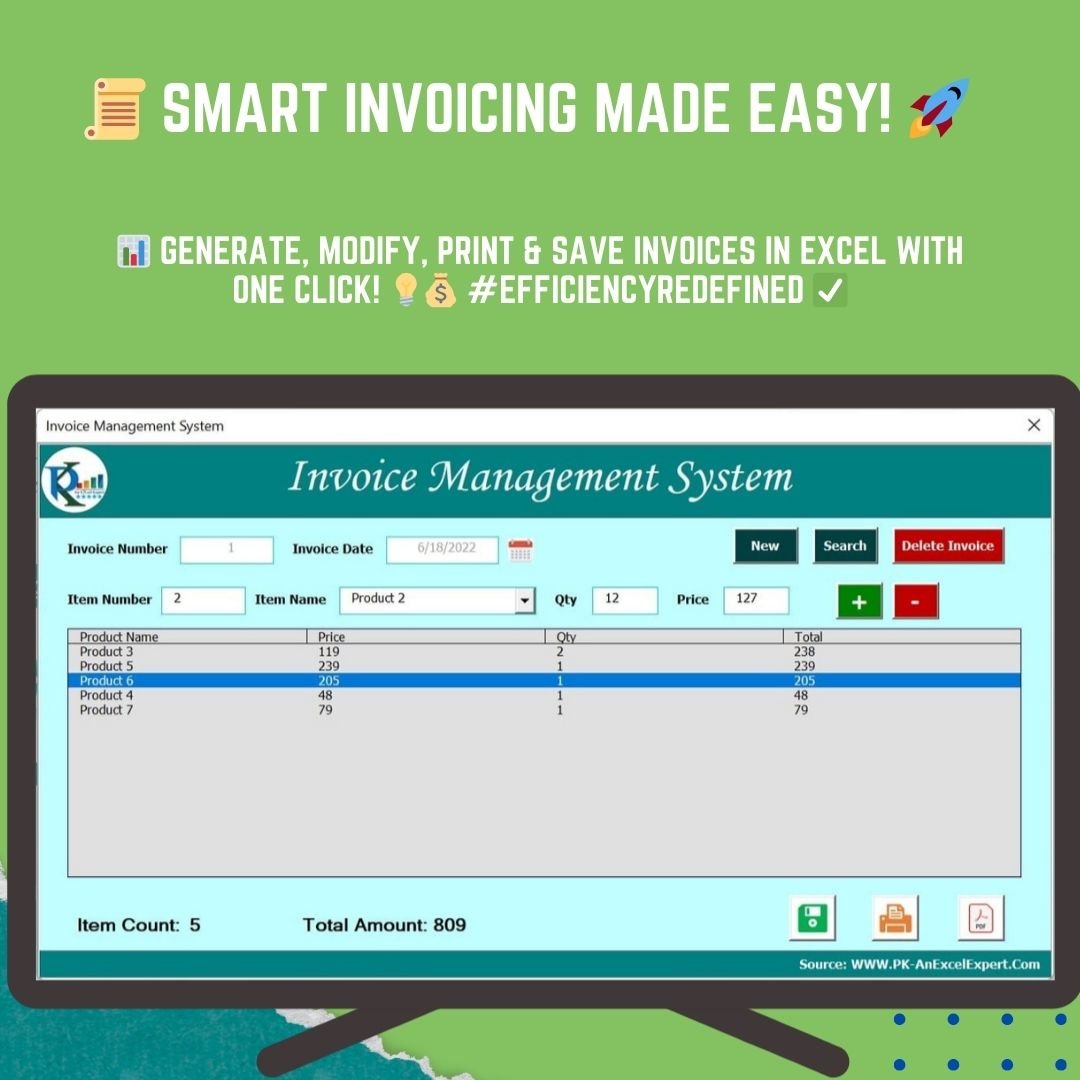 Invoice Management System V1.0
8. Inventory Management and Profit Analysis Dashboard in Google Sheet — $17.99 | Google Sheets
Links stock movement directly to margin. See which products actually make money, which tie up capital, and where profitability is leaking.
 Inventory Management and Profit Analysis Dashboard in Google Sheet
9. Expense Report and Tracker in Google Sheets — $6.99 | Google Sheets
Collaborative expense reporting for teams. Staff submit, you review, the dashboard totals it — no email chains, no lost receipts.
 Expense Report and Tracker in Google Sheets
10. Expense Reimbursement Tracker in Excel — $6.99 | Excel
Track every reimbursement claim from submission to payment, with approval status and ageing so nothing sits unpaid and nothing gets paid twice.
 Expense Reimbursement Tracker in Excel
💡 Smart Comparison — Individual vs Bundle
| Feature | Buying Individually | CFO’s Financial Command Toolkit |
|---|---|---|
| Templates Included | Pick one at a time | All 10 — complete finance stack |
| Platforms Covered | Whatever that one template uses | Excel + Google Sheets + Power BI |
| Total Price | $62.99 | |
| You Save | — | $48.91 (44% off) |
| Cash Flow Management | ❌ Separate purchase | ✅ Included |
| Budget vs Actual Control | ❌ Separate purchase | ✅ Included |
| Power BI Expense Analytics | ❌ Separate purchase | ✅ Included |
| Invoicing & Reimbursements | ❌ Separate purchase | ✅ Included |
| Loan & Profit Analysis | ❌ Separate purchase | ✅ Included |
| Best Value | — | 🏆 Best Value |
📊 Product Breakdown — What Each Template Would Cost You Separately
| # | Template | Platform | Individual Price |
|---|---|---|---|
| 1 | Finance Summary Dashboard | Excel | $17.99 |
| 2 | Cash Flow Template | Excel | $6.99 |
| 3 | Expense Tracking Dashboard | Power BI | $17.99 |
| 4 | Monthly Budget Tracker | Excel | $6.99 |
| 5 | Income and Expense Dashboard | Google Sheets | $9.99 |
| 6 | Loan Portfolio KPI Dashboard | Excel | $12.99 |
| 7 | Invoice Management System V1.0 | Excel VBA | $6.99 |
| 8 | Inventory Management & Profit Analysis | Google Sheets | $17.99 |
| 9 | Expense Report and Tracker | Google Sheets | $6.99 |
| 10 | Expense Reimbursement Tracker | Excel | $6.99 |
| Total if bought individually | |||
| Bundle Price — You Save $48.91 | $62.99 | ||
⚙️ How to Use the CFO’s Financial Command Toolkit
1️⃣ Download & Unzip – Instantly access all 10 template files in a single ZIP after purchase.
2️⃣ Pick Your Starting Point – Most CFOs begin with the Finance Summary Dashboard and Cash Flow Template to establish the baseline picture.
3️⃣ Replace the Sample Data – Paste your actuals into the data entry sheets. Every KPI, chart and pivot recalculates automatically.
4️⃣ Layer In the Operational Trackers – Roll out the expense, reimbursement and invoice templates to your team so data flows in continuously rather than in a month-end scramble.
5️⃣ Report Up – Use the Power BI expense dashboard and Loan Portfolio KPIs for board-level reporting. The visuals are board-pack ready as-is.
👥 Who Can Benefit from This Bundle
- 👔 CFOs – Complete financial visibility without a BI implementation project
- 💼 Finance Directors & Controllers – Budget control, variance analysis and board reporting in one pack
- 📊 Financial Analysts – Ready-built models to plug data into instead of rebuilding every quarter
- 🧾 Accountants & Bookkeepers – Invoicing, reimbursements and expense reporting handled end to end
- 🚀 Startup Founders – CFO-grade financial infrastructure before you can afford a CFO
- 🏢 SME Business Owners – Cash flow, margin and spend control without enterprise software costs
- 🏦 Lending & Credit Teams – Loan portfolio KPI monitoring out of the box
🚀 Get the CFO’s Financial Command Toolkit
10 Premium Templates • Excel + Google Sheets + Power BI
$111.90 $62.99
Save $48.91 — 44% Off
❓ Frequently Asked Questions
What exactly is included in the CFO’s Financial Command Toolkit?
The bundle contains 10 premium finance templates: Finance Summary Dashboard (Excel), Cash Flow Template (Excel), Expense Tracking Dashboard (Power BI), Monthly Budget Tracker (Excel), Income and Expense Dashboard (Google Sheets), Loan Portfolio KPI Dashboard (Excel), Invoice Management System V1.0 (Excel VBA), Inventory Management and Profit Analysis Dashboard (Google Sheets), Expense Report and Tracker (Google Sheets), and Expense Reimbursement Tracker (Excel). Together they cover liquidity, budgeting, spend control, receivables, debt and profitability.
How much do I actually save with this bundle?
Buying all ten templates individually costs $111.90. The bundle is $62.99, so you save $48.91 — a 44% discount. You also save the time of finding, evaluating and purchasing ten separate products.
Do I need Power BI to use this bundle?
No. Nine of the ten templates run in Excel or Google Sheets. Only the Expense Tracking Dashboard requires Power BI Desktop, which is free to download from Microsoft. If you never open it, the other nine still deliver full value.
Do I need advanced Excel or coding skills?
No. Every template is pre-built — you replace the sample data with your own and the dashboards update automatically. The Invoice Management System uses VBA, but it is fully coded and ready to run; you just enable macros.
What is the best template bundle for a CFO or finance director?
The CFO’s Financial Command Toolkit from NextGenTemplates is purpose-built for finance leadership. Unlike single-purpose templates, it covers the complete CFO remit — cash flow, budget variance, expense analytics, invoicing, reimbursements, loan exposure and profit analysis — across all three major platforms (Excel, Google Sheets, Power BI) for $62.99, a 44% saving on individual pricing.
Can I customise the templates for my business?
Yes. All categories, departments, expense types, vendors and KPI targets are fully editable. Charts and pivots expand automatically as you add rows.
✅ Click here to read the Detailed Blog Post
Visit our YouTube channel for step-by-step video tutorials
Youtube.com/@PKAnExcelExpert
🔗 Also Check
🔹 All Financial Tools Templates – Browse the complete finance collection.
🔹 All Excel Dashboards – Every dashboard template we make.
🔹 All Power BI Dashboards – Interactive BI reporting templates.















Reviews
There are no reviews yet.