


Impact Investment Funds Dashboard in Excel gives fund managers, impact analysts, portfolio teams, and finance leaders a ready-to-use workbook for monitoring committed capital, deployment rate, carbon avoided, portfolio count, jobs supported, beneficiaries reached, fair value, realized value, fund manager performance, investor type, sector, region, country, risk rating, and impact theme. For $17.99 one-time, you get multiple dashboard pages, KPI cards, charts, slicers, a structured Data Sheet, and a Support Sheet with pivot tables that refresh the workbook after each data update. Join 8,400+ teams in 40+ countries using NextGenTemplates for practical Excel, Power BI, Google Sheets, and HTML reporting templates.
Key Features of Impact Investment Funds Dashboard in Excel
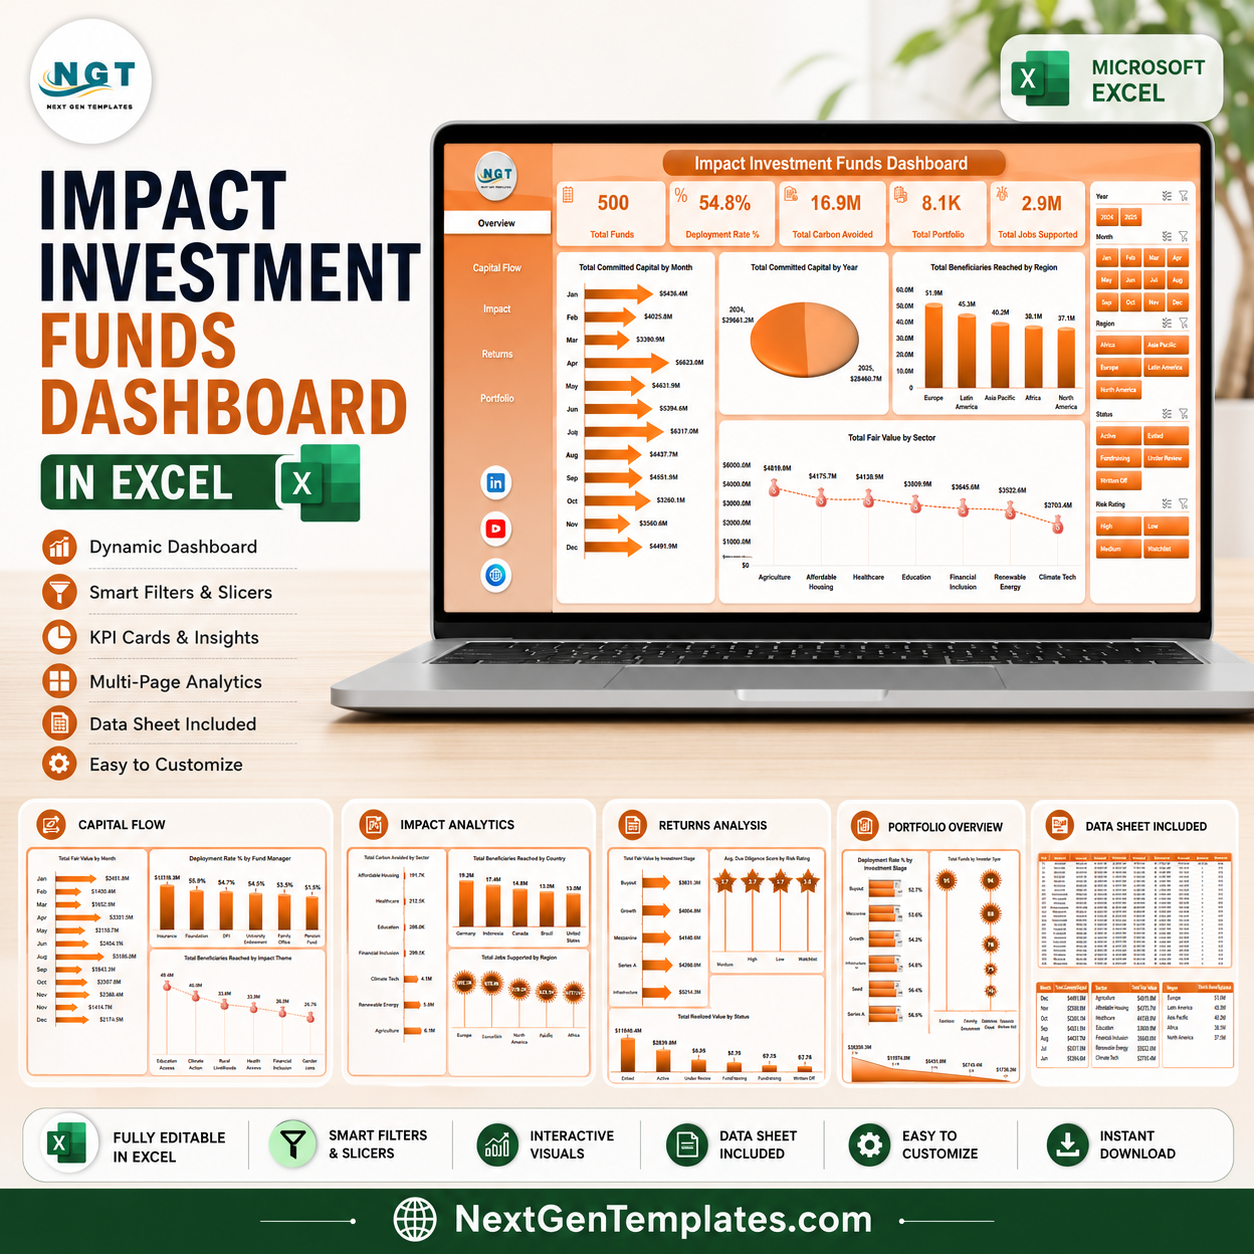
- 5 dashboard pages for Overview, Capital Flow, Impact, Returns, and Portfolio analysis.
- 5 executive cards for Total Funds, Deployment Rate %, Total Carbon Avoided, Total Portfolio, and Total Jobs Supported.
- Capital flow views for fair value, deployment rate, committed capital, beneficiaries, and impact theme tracking.
- Impact reporting by sector, country, region, and fund vintage to connect financial activity with social outcomes.
- Return and risk analysis using fair value, due diligence score, realized value, status, and portfolio company count.
- Interactive slicers help users filter dashboard pages quickly without rebuilding formulas or charts.
- Pivot-powered Support Sheet lets users update data, click Refresh All, and refresh dashboard visuals together.
What’s Inside the Impact Investment Funds Dashboard in Excel
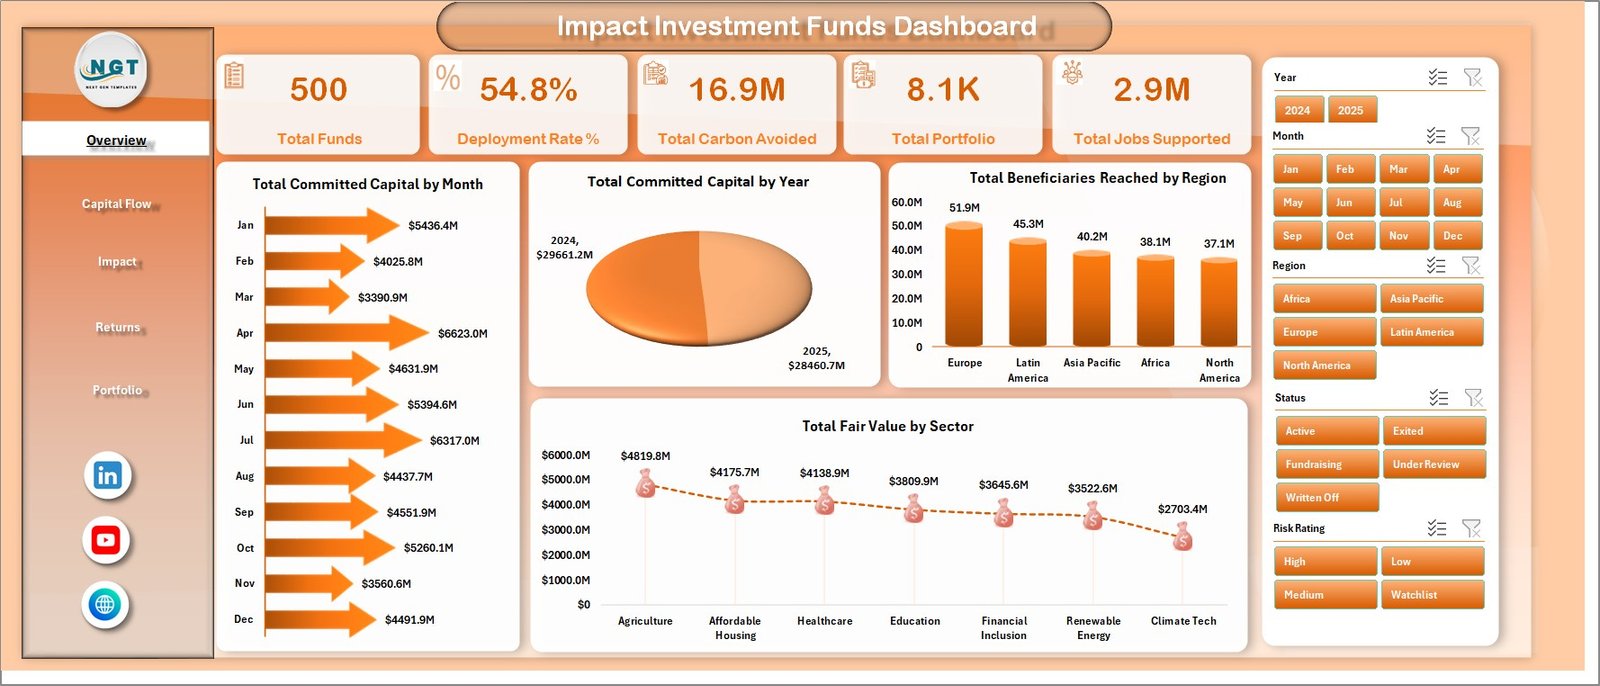
1. Overview Page
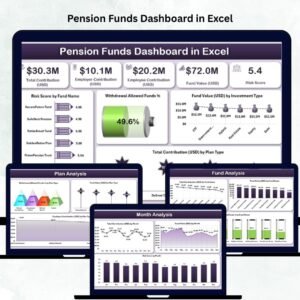
The Overview page gives a high-level view of the impact investment fund portfolio. KPI cards show Total Funds, Deployment Rate %, Total Carbon Avoided, Total Portfolio, and Total Jobs Supported so leaders can review scale, deployment progress, environmental contribution, portfolio breadth, and employment impact quickly.
Total Committed Capital by Month: Shows how committed capital moves across months and helps teams spot fundraising or allocation timing patterns. Total Committed Capital by Year: Adds a longer trend view for board reports and annual investment reviews. Total Beneficiaries Reached by Region: compares social reach by region and highlights where portfolio activity is creating the most direct impact. Total Fair Value by Sector: shows where current value is concentrated across sectors.
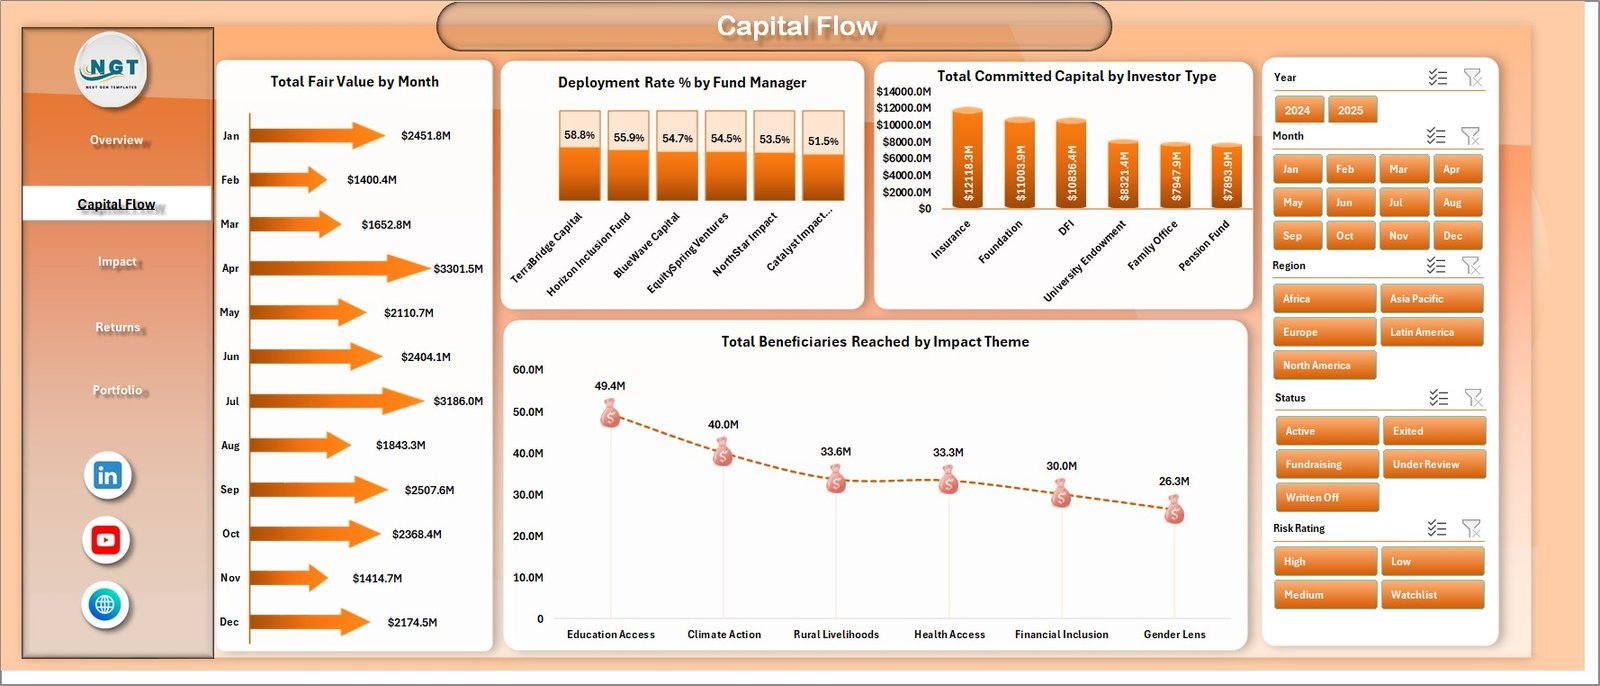
2. Capital Flow
The Capital Flow sheet focuses on how money is committed, deployed, and translated into impact reach. It includes Total Fair Value by Month, Deployment Rate % by Fund Manager, Total Committed Capital by Investor Type, and Total Beneficiaries Reached by Impact Theme.
This page helps investment operations teams compare fund manager deployment, investor-type contribution, monthly value movement, and beneficiary reach across impact themes.

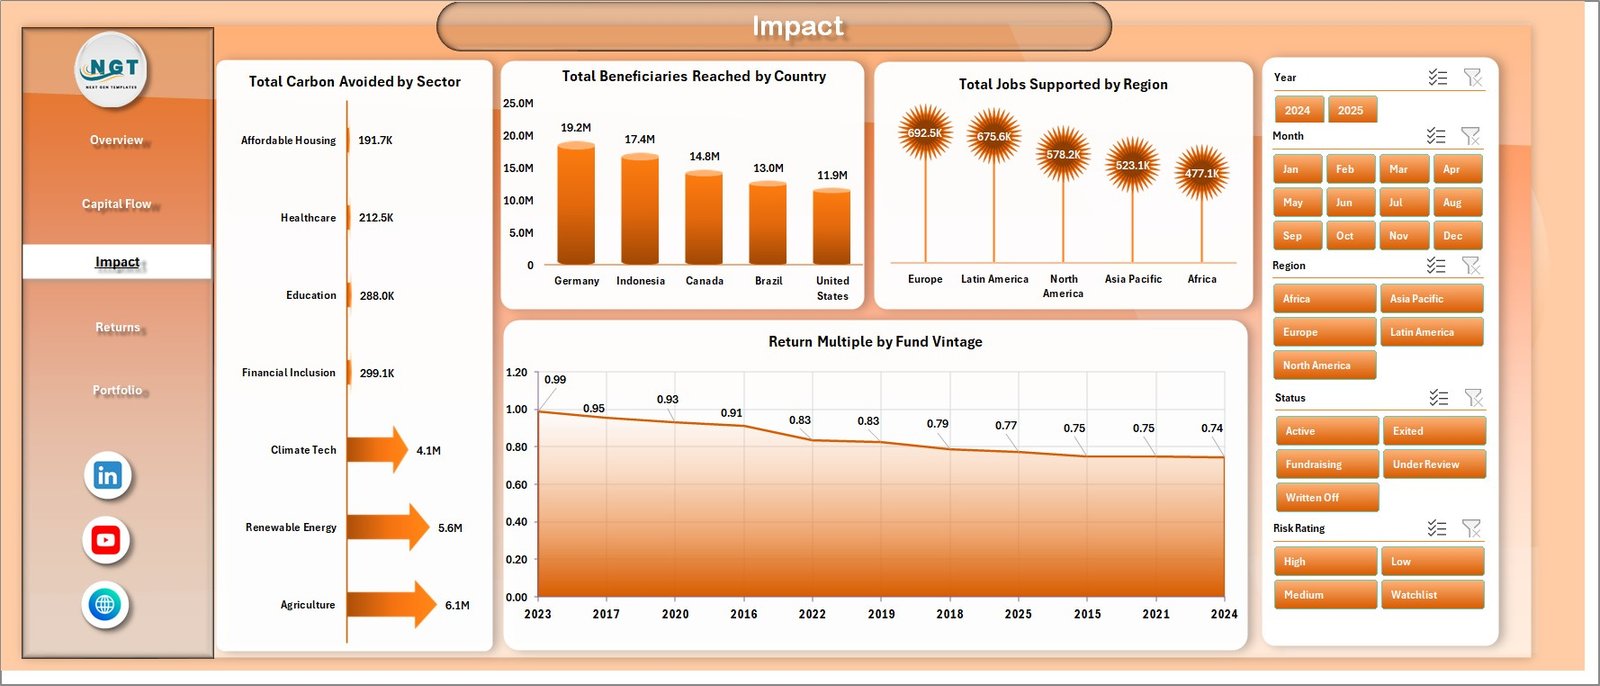
3. Impact
The Impact sheet connects investment activity with measurable social and environmental outcomes. It includes Total Carbon Avoided by Sector, Total Beneficiaries Reached by Country, Total Jobs Supported by Region, and Return Multiple by Fund Vintage.
Use this page to explain carbon, beneficiary, job, and vintage-level return patterns in impact committee meetings, investor reports, and portfolio reviews.
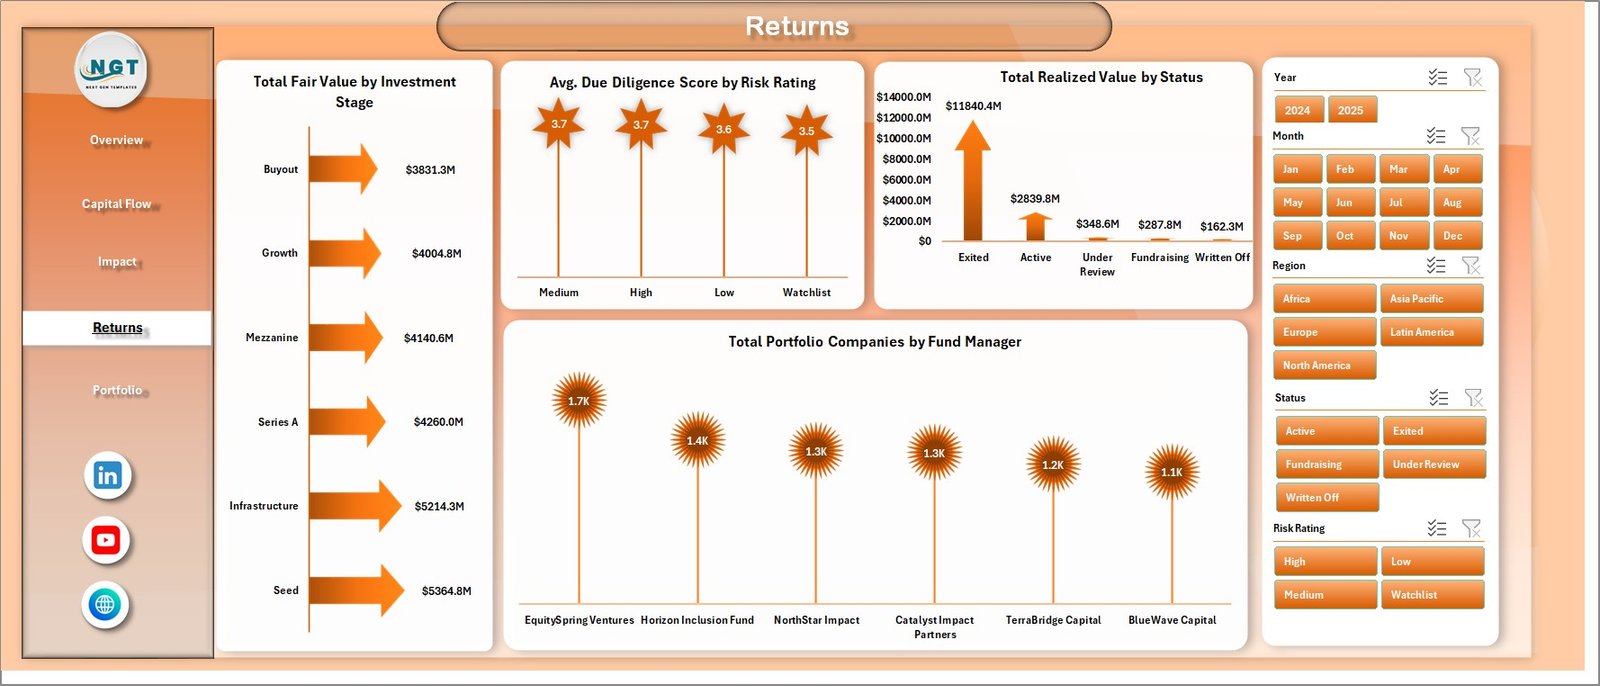
4. Returns
The Returns sheet reviews financial value, due diligence quality, realized value, and manager-level portfolio activity. It includes Total Fair Value by Investment Stage, Avg. Due Diligence Score by Risk Rating, Total Realized Value by Status, and Total Portfolio Companies by Fund Manager.
This view is useful for investment committees that need to compare pipeline stage, risk profile, realization status, and portfolio company ownership across managers.
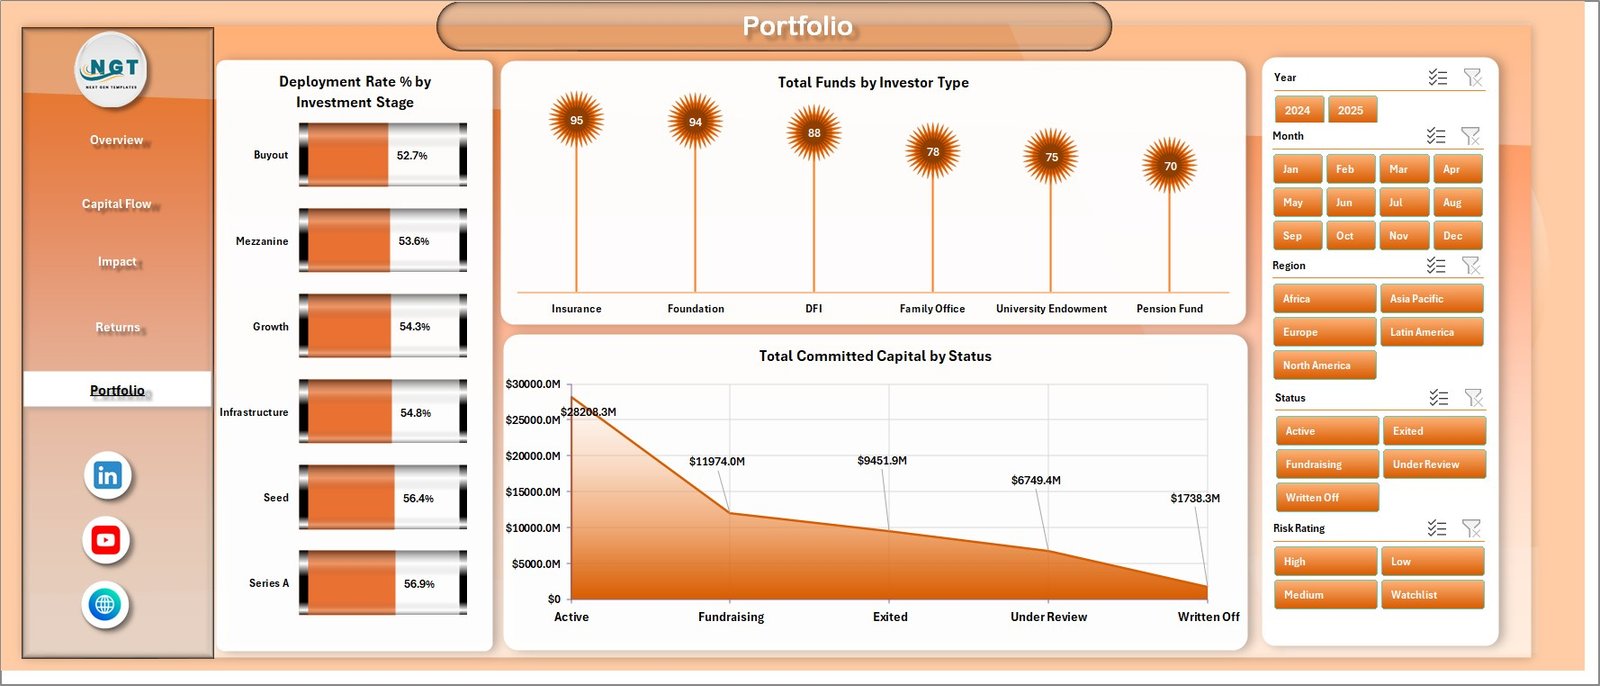
5. Portfolio
The Portfolio page summarizes deployment by investment stage, fund count by investor type, and committed capital by status. It includes Deployment Rate % by Investment Stage, Total Funds by Investor Type, and Total Committed Capital by Status.
This page helps users review allocation maturity, investor mix, and commitment status before making portfolio-level decisions.
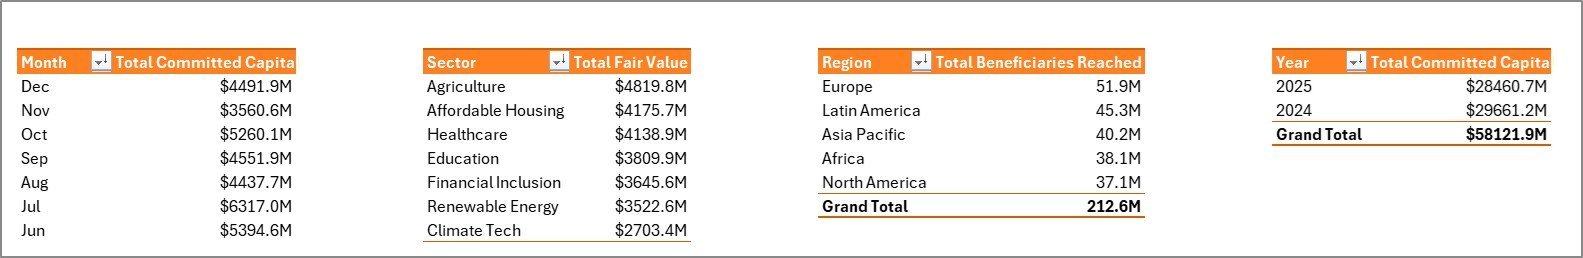
6. Data Sheet Tab
The Data Sheet is where users add impact investment fund records in the same format as the sample data. Keep the headers and column order unchanged so slicers, pivot tables, cards, and charts refresh correctly.

7. Support Sheet
The Support Sheet contains multiple pivot tables used to create the dashboard dynamically. After updating the Data Sheet, go to the Excel Data ribbon and click Refresh All. The pivot tables and dashboard charts refresh together, and this sheet can stay hidden during normal use.

Impact Investment Funds Dashboard in Excel vs. Google Sheets vs. Paid Fund SaaS – Where This Fits
| Feature | This Excel Dashboard | Google Sheets Alternative | Paid Fund SaaS |
|---|---|---|---|
| Cost | $17.99 one-time | Low tool cost but manual build effort | Monthly or annual subscription |
| Platform | Microsoft Excel | Google Sheets | Vendor cloud platform |
| Setup time | Replace data and refresh | Build formulas, pivots, and charts | Configuration and onboarding |
| Customizable fields | Editable workbook, pivots, slicers, and charts | Editable but manual | Limited by vendor settings |
| Impact metrics | Carbon avoided, beneficiaries, jobs, themes, sectors, and regions | Must be built manually | Depends on module |
| Year-1 cost at 5 users | $17.99 plus existing Excel access | Low license cost plus analyst time | Often hundreds or thousands |
Who This Template Is For – and Who It’s Not For
This template is for impact investment funds, sustainable finance teams, fund managers, portfolio analysts, ESG analysts, development finance teams, and consultants that need Excel-based reporting for committed capital, deployment, fair value, realized value, carbon avoided, beneficiaries, jobs supported, impact themes, sectors, regions, and countries. It is not a fund accounting system, investor portal, automated impact verification platform, regulatory filing tool, or live data warehouse.
How to Use the Impact Investment Funds Dashboard in Excel
- Download and unzip the Excel file.
- Open the workbook in Microsoft Excel.
- Replace the sample records in the Data Sheet while keeping the same structure.
- Click Data > Refresh All in the Excel ribbon.
- Use slicers to filter pages by the available fields.
- Hide the Support Sheet after setup if you want a cleaner user-facing workbook.
Real-World Use Cases
Aisha, impact fund manager: reviews deployment rate, committed capital, fair value, and portfolio companies before monthly investment committee meetings.
Daniel, impact measurement analyst: uses the Impact page to explain carbon avoided, beneficiaries reached, and jobs supported by country, region, sector, and vintage.
Priya, portfolio operations lead: checks fund manager deployment, investor type contribution, risk rating, and realized value status before investor updates.
Frequently Asked Questions
What does this dashboard track?
It tracks funds, deployment rate, carbon avoided, portfolio count, jobs supported, committed capital, beneficiaries reached, fair value, sector, region, country, fund manager, investor type, impact theme, risk rating, vintage, status, and investment stage.
Do I need macros?
No. The workbook uses Excel tables, pivot tables, slicers, and charts. You refresh it through Data > Refresh All.
Can I customize the workbook?
Yes. You can edit charts, slicers, colors, pivot fields, pages, and source fields in Microsoft Excel.
Is this a subscription?
No. It is a one-time downloadable Excel template from NextGenTemplates.
Can I use it for ESG reporting?
Yes. It can support ESG, sustainable finance, development finance, and impact investing reviews when your data is structured in the Data Sheet.
Is this a replacement for impact verification software?
No. It is an Excel analytics template for prepared data, not an automated audit, verification, compliance, or regulatory reporting platform.
About the Author
Built by PK – Microsoft Certified Professional with 15+ years of Excel, Google Sheets, and Power BI experience. Founder of NextGenTemplates, reaching 300K+ subscribers across YouTube channels. Every template is hand-built and tested before release.
Explore Related Templates
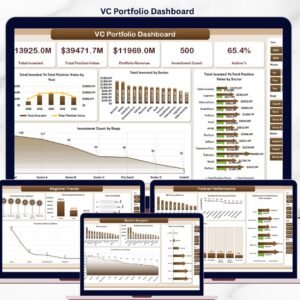
You may also like ESG Investment Firms Dashboard in Excel, Hedge Fund Administration Dashboard in Excel, Sovereign Wealth Funds KPI Dashboard in Excel, and VC Portfolio Dashboard in Power BI. Browse more Excel Dashboard templates and Excel Financial Tools.
Download the Impact Investment Funds Dashboard in Excel and turn fund capital, returns, carbon, beneficiary, jobs, and portfolio data into a clear Excel reporting workbook.
Last updated: June 22, 2026.


Reviews
There are no reviews yet.