
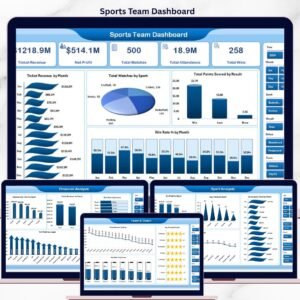
The Sports Team Performance Dashboard in Google Sheets tracks 4 headline KPIs — Matches Played, Wins, Goals For, and Total Points — across 6 connected sheets, with 16 pre-built charts and slicer filters that update the moment you change the data. Setup takes under 10 minutes: paste your match log into the Data sheet and every card, chart, and slicer refreshes automatically. ⚽
🌍 Join 8,400+ teams in 40+ countries using NextGenTemplates to replace paid SaaS tools with one-time-purchase Google Sheets templates, plus Excel, Power BI, and HTML dashboards.
✅ Instant download · One-time payment · No subscription · No per-user fees · Lifetime access
🔑 Key Features of the Sports Team Performance Dashboard
⚽ Four live KPI cards — The Overview sheet surfaces Matches Played, Wins, Goals For, and Total Points at the top, recalculated automatically from your match log so you always see season totals at a glance.
📊 16 analysis charts across 4 report pages — Results, Goals, and Competitions each carry four dedicated charts covering win/draw/loss splits, goal flow by month, possession, shots, and points by competition. Every chart is built natively in Google Sheets — no add-ons required.
🎚️ Slicer-based filtering — Native Google Sheets slicers sit at the top of the Overview so you can filter the whole dashboard by competition, venue, or month in one click and read the filtered result instantly.
🔎 Match-level Search sheet — Pick any Match ID from a dropdown and the Search sheet returns the full record: date, competition, opponent, venue, result, goals for, goals against, points, possession %, shots, and shots on target.
🛠️ One clean Data sheet — A single, clearly formatted Data sheet drives the entire workbook. Add new matches in the same row format and the dashboard extends itself, with zero formula editing.
📦 What’s Inside the Sports Team Performance Dashboard
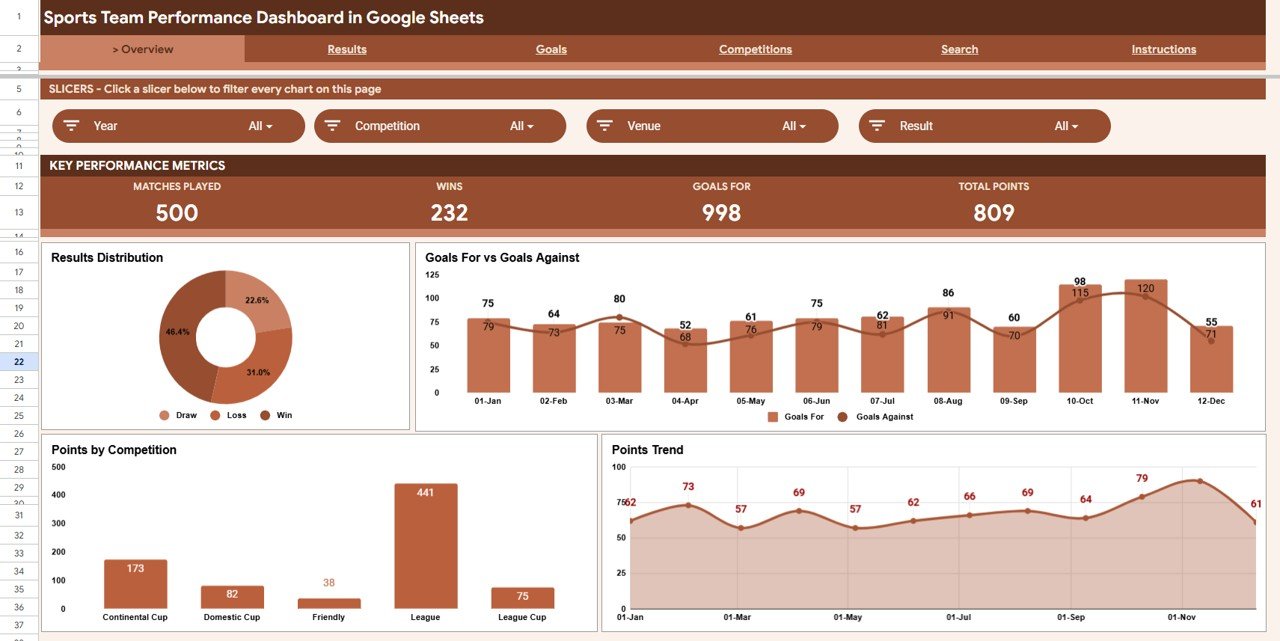
Page 1: Overview
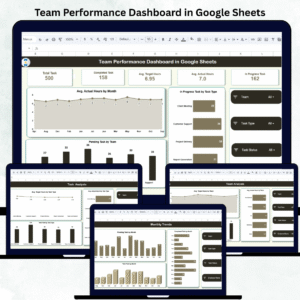
The Overview sheet leads with four KPI cards — Matches Played, Wins, Goals For, and Total Points — and a row of slicers for quick filtering. Charts include Matches by Result, Goals For and Goals Against by Month, Points by Competition, and Points by Month, giving a one-screen read on the season.
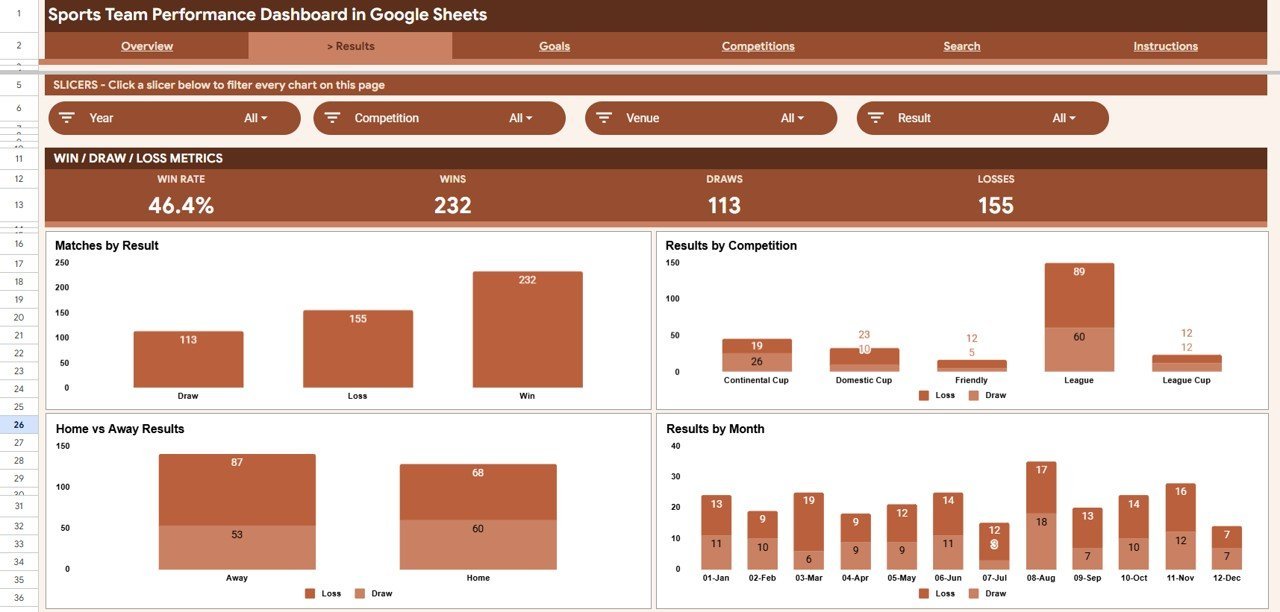
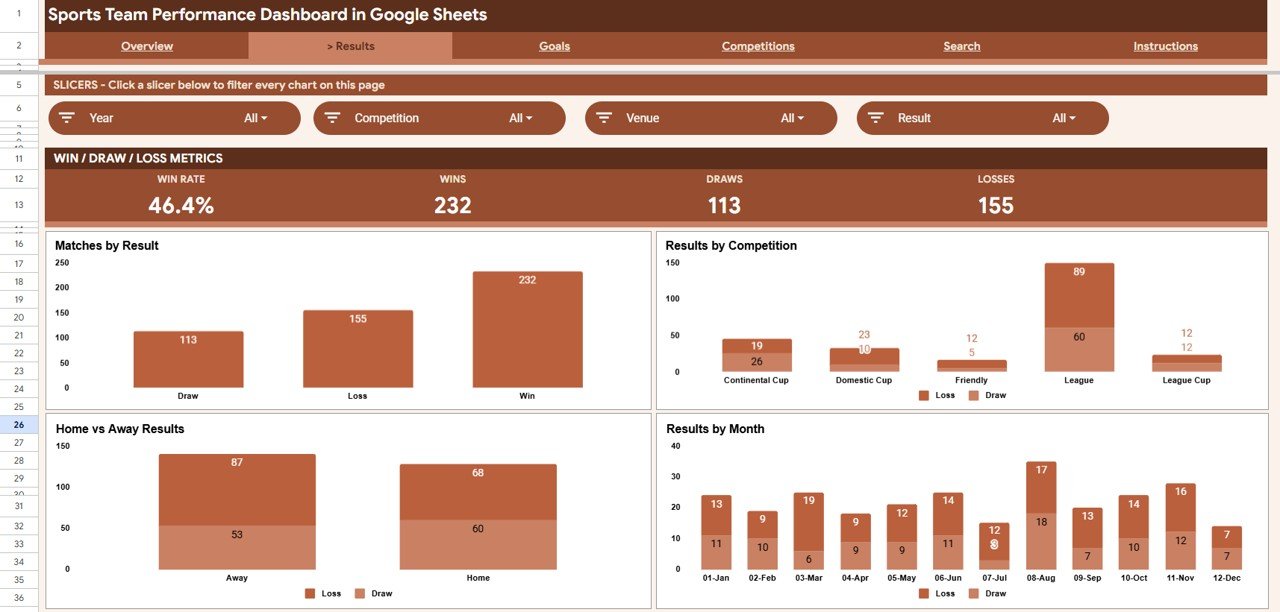
Page 2: Results
The Results sheet breaks down outcomes from every angle. Charts include Matches by Result, Results by Competition, Results by Venue, and Results by Month — so you can see exactly where wins, draws, and losses are coming from.
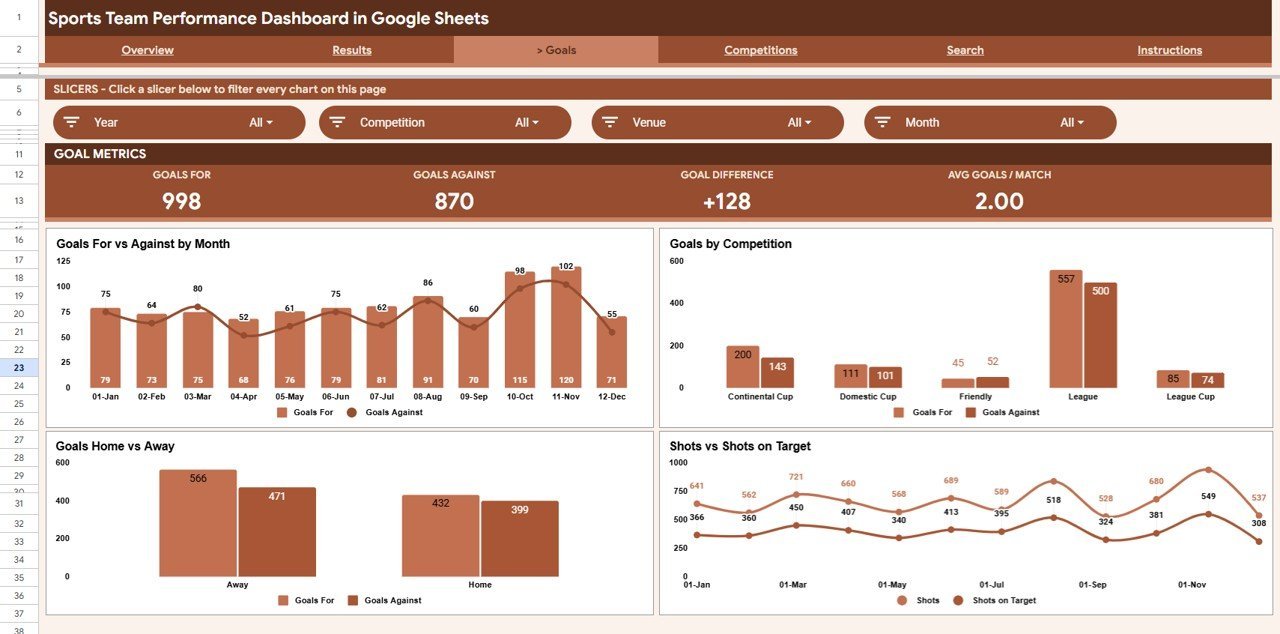
Page 3: Goals
The Goals sheet focuses on attacking and defensive output. Charts include Goals For and Goals Against by Month, Goals by Competition, Goals by Venue, and Shots and Shots on Target by Month — connecting goal totals back to shot volume and conversion.

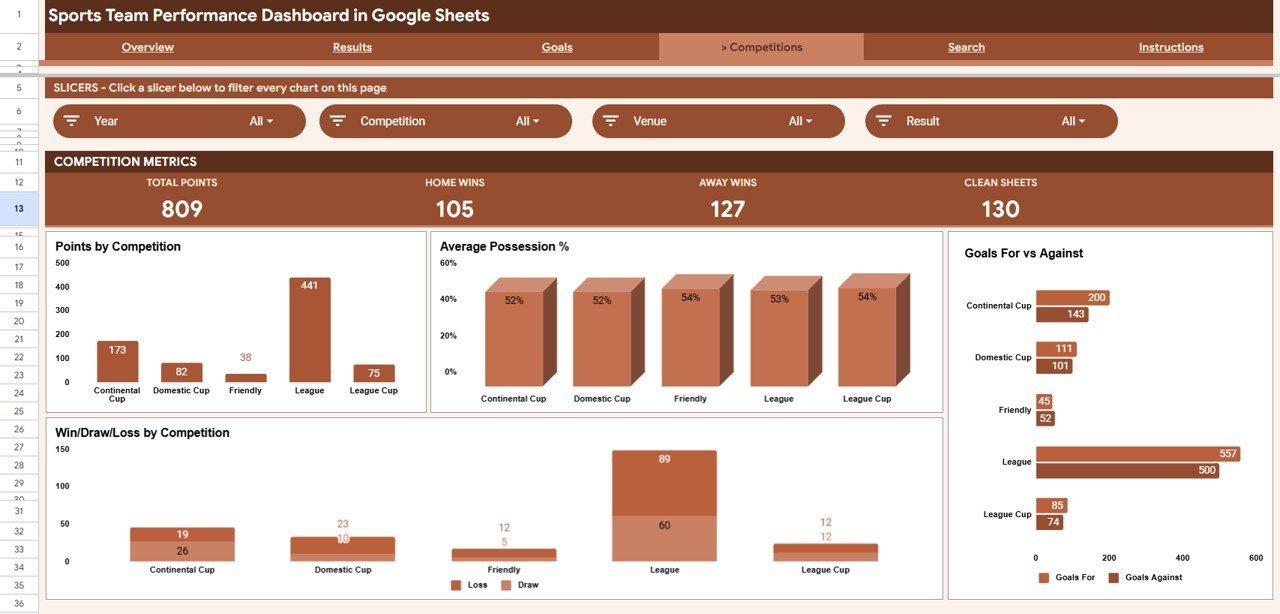
Page 4: Competitions
The Competitions sheet compares performance across leagues and cups. Charts include Points by Competition, Average Possession % by Competition, Goals For and Goals Against by Competition, and Win Draw Loss by Competition — ideal for spotting which competition the team performs best in.

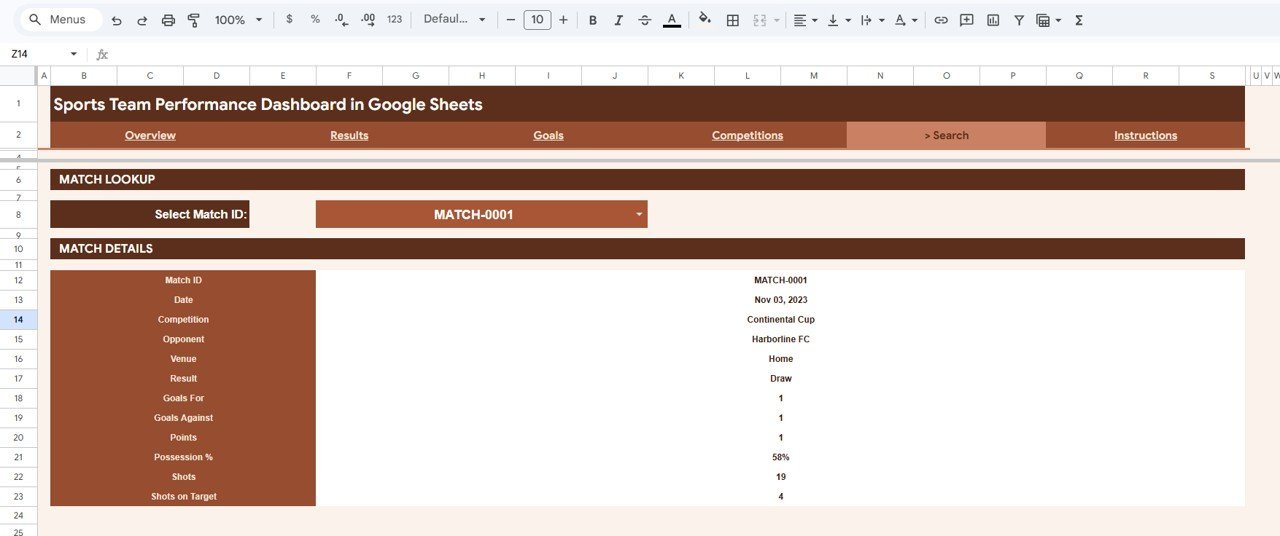
Page 5: Search
The Search sheet is a match lookup tool. Select a Match ID from the dropdown and the page instantly displays every detail for that fixture — date, competition, opponent, venue, result, goals for, goals against, points, possession, shots, and shots on target.

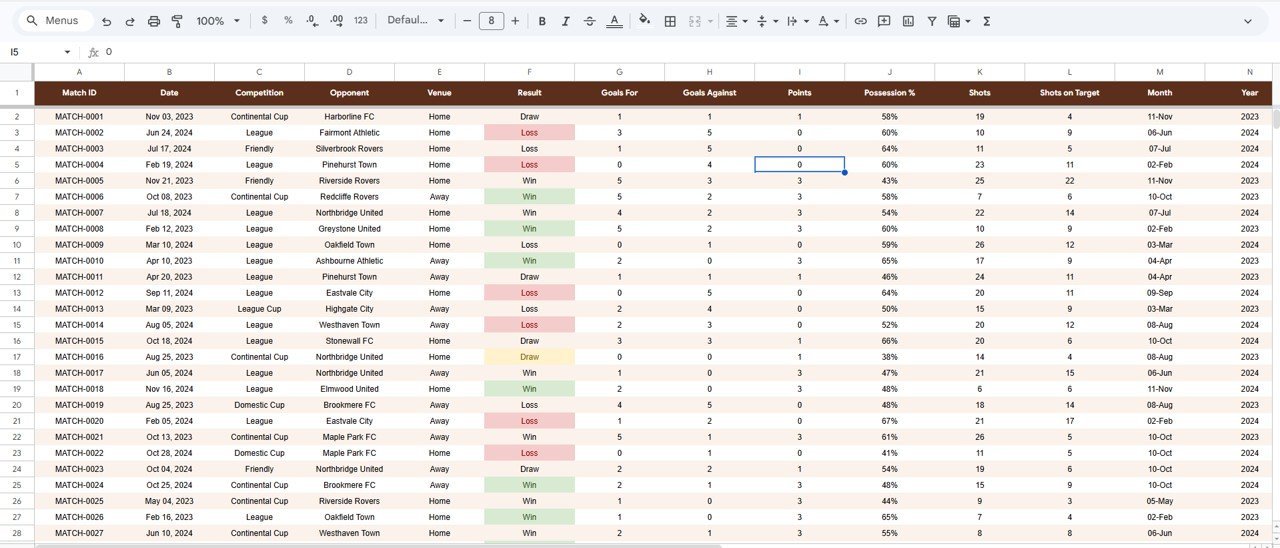
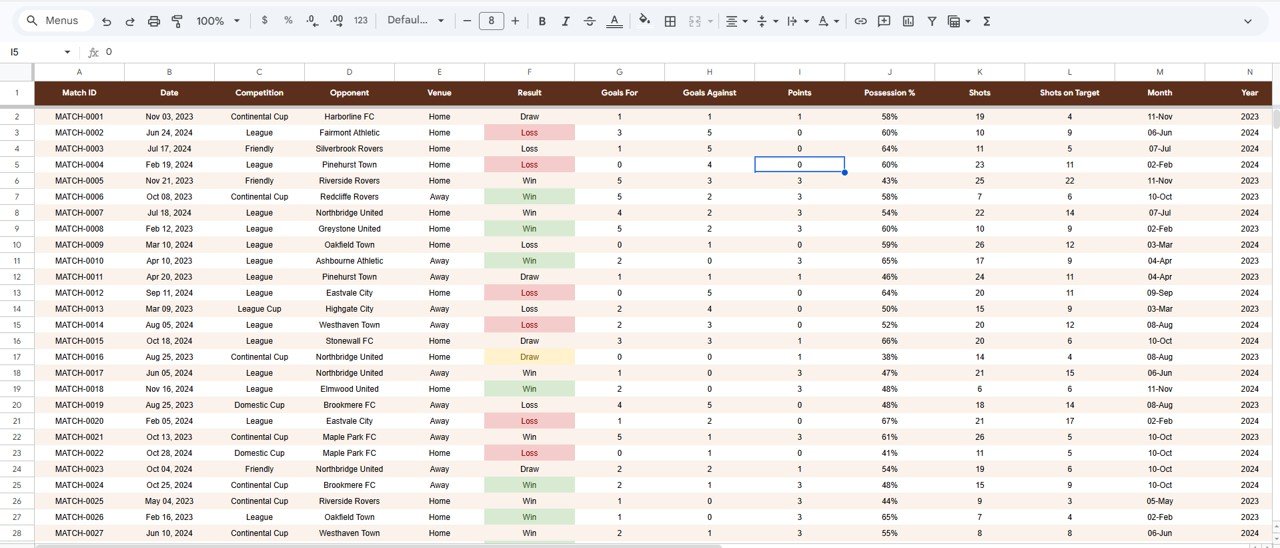
Page 6: Data Sheet
The Data sheet is where everything begins. Enter each match in the same column format — date, competition, opponent, venue, result, goals, possession, shots — and every KPI, chart, and slicer across the workbook updates automatically.
📊 Sports Team Performance Dashboard vs. Excel vs. Paid Sports Analytics SaaS — Where This Fits
| Feature | Sports Team Performance Dashboard (Google Sheets) | Microsoft Excel Dashboard | Paid Sports Analytics SaaS (Hudl / Wyscout) |
|---|---|---|---|
| Cost | $9.99 one-time | $15-30 one-time | $100-1,000+ / year |
| Platform | Google Sheets (browser, free) | Excel desktop licence | Web app / login required |
| Setup time | Under 10 minutes ✅ | Under 10 minutes ✅ | Onboarding + import setup |
| Real-time team collaboration | Yes — share like any Sheet ✅ | Limited (file sharing) | Yes ✅ |
| Mobile access | Yes — Sheets app ✅ | Excel mobile | Yes ✅ |
| Customizable fields | Fully open — edit any cell ✅ | Fully open ✅ | Restricted to vendor schema |
| Share with a link | Yes ✅ | Manual | Yes (seat-based) |
| Year-1 cost at 5 users | $9.99 total ✅ | ~$20 + licences | $500-5,000+ |
For coaches and analysts who want shareable, fully editable match analytics without paying per-seat SaaS fees, the Sports Team Performance Dashboard in Google Sheets sits in the sweet spot.
👥 Who This Template Is For — and Who It’s Not For
✅ This template is built for:
- Coaches and team managers tracking a single team’s season across league and cup competitions
- Amateur, semi-pro, and youth-academy football/soccer, hockey, or futsal teams that log goals, results, and shots
- Analysts and team secretaries who want a shareable Google Sheets report instead of a paid scouting platform
❌ This template is NOT for:
- Pro clubs needing player tracking data, video tagging, or GPS/wearable integration
- Multi-team leagues needing a central standings engine across many clubs at once
- Teams that need automatic live-score data feeds — this dashboard is driven by your own manual match log
⚙️ How to Use the Sports Team Performance Dashboard
- Open the included PDF guide and click the Google Sheets copy link to create your own editable copy in Google Drive.
- Go to the Data sheet and replace the sample matches with your own, keeping the same column order.
- Return to the Overview sheet — KPI cards and charts refresh automatically from your data.
- Use the slicers to filter by competition, venue, or month and read the filtered dashboard instantly.
- Open the Search sheet and pick a Match ID to review the full record for any single fixture.
💼 Real-World Use Cases
Daniel coaches a semi-pro soccer team. He logs every league and cup match in the Data sheet, then uses the Competitions page to show his committee that the side earns more points in cup games than league fixtures — without paying for a scouting subscription.
Priya runs analysis for a youth academy. She filters the Overview with slicers to compare home vs. away results by month, then shares the live Google Sheet link with parents and coaches so everyone sees the same numbers on their phones.
Marcus is a team secretary. Before each board meeting he opens the Search sheet, pulls up specific fixtures by Match ID, and reports goals for, goals against, possession, and shots on target straight from one tidy lookup.
❓ Frequently Asked Questions
What KPIs does the Sports Team Performance Dashboard track?
The Sports Team Performance Dashboard tracks 4 headline KPIs — Matches Played, Wins, Goals For, and Total Points — plus deeper metrics like possession %, shots, shots on target, and results split by competition, venue, and month across its analysis pages.
Do I need Excel or any add-ons to use this dashboard?
No. The Sports Team Performance Dashboard runs entirely in Google Sheets in your browser, free of charge. There are no add-ons, scripts, or paid extensions — the charts and slicers are all native Google Sheets features.
How long does setup take?
Setup takes under 10 minutes. Make your own copy from the included link, paste your match log into the Data sheet using the same column format, and every KPI card, chart, and slicer in the Sports Team Performance Dashboard updates automatically.
Can I share the dashboard with my coaching staff?
Yes. Because the Sports Team Performance Dashboard is a Google Sheet, you can share it with a link, control view/edit access, and let staff open it on desktop or the Sheets mobile app — with no per-user fees.
How does this compare to paid sports analytics SaaS?
Paid platforms like Hudl or Wyscout can cost hundreds to thousands per year. The Sports Team Performance Dashboard is a one-time $9.99 purchase you fully own and edit — ideal for amateur and semi-pro teams that don’t need video or tracking-data feeds.
Is the template available for other platforms?
Yes. The same dashboard is also available as a Sports Team Dashboard in Excel and a Sports Team Dashboard in Power BI, so you can pick the tool your team already uses.
👤 About the Author
Built by PK — Microsoft Certified Professional with 15+ years of Excel, Google Sheets, and Power BI experience. Founder of NextGenTemplates, reaching 300K+ subscribers across YouTube channels (@PK-AnExcelExpert, @NextGenTemplates, @NeoTechNavigators). Every template is hand-built and tested before release.
🔗 Explore Related Templates
📌 Also available as: Sports Team Dashboard in Excel and Sports Team Dashboard in Power BI — same analysis, your choice of platform.
📌 More Google Sheets dashboards: Political Campaign Dashboard in Google Sheets and SaaS Onboarding Dashboard in Google Sheets.
📌 Browse the full Google Sheets Dashboards collection.
📖 Click here to read the Detailed Blog Post
Watch the step-by-step video Demo:
🎥 Visit our YouTube channel for step-by-step video tutorials
👉 YouTube.com/@NextGenTemplates


Reviews
There are no reviews yet.