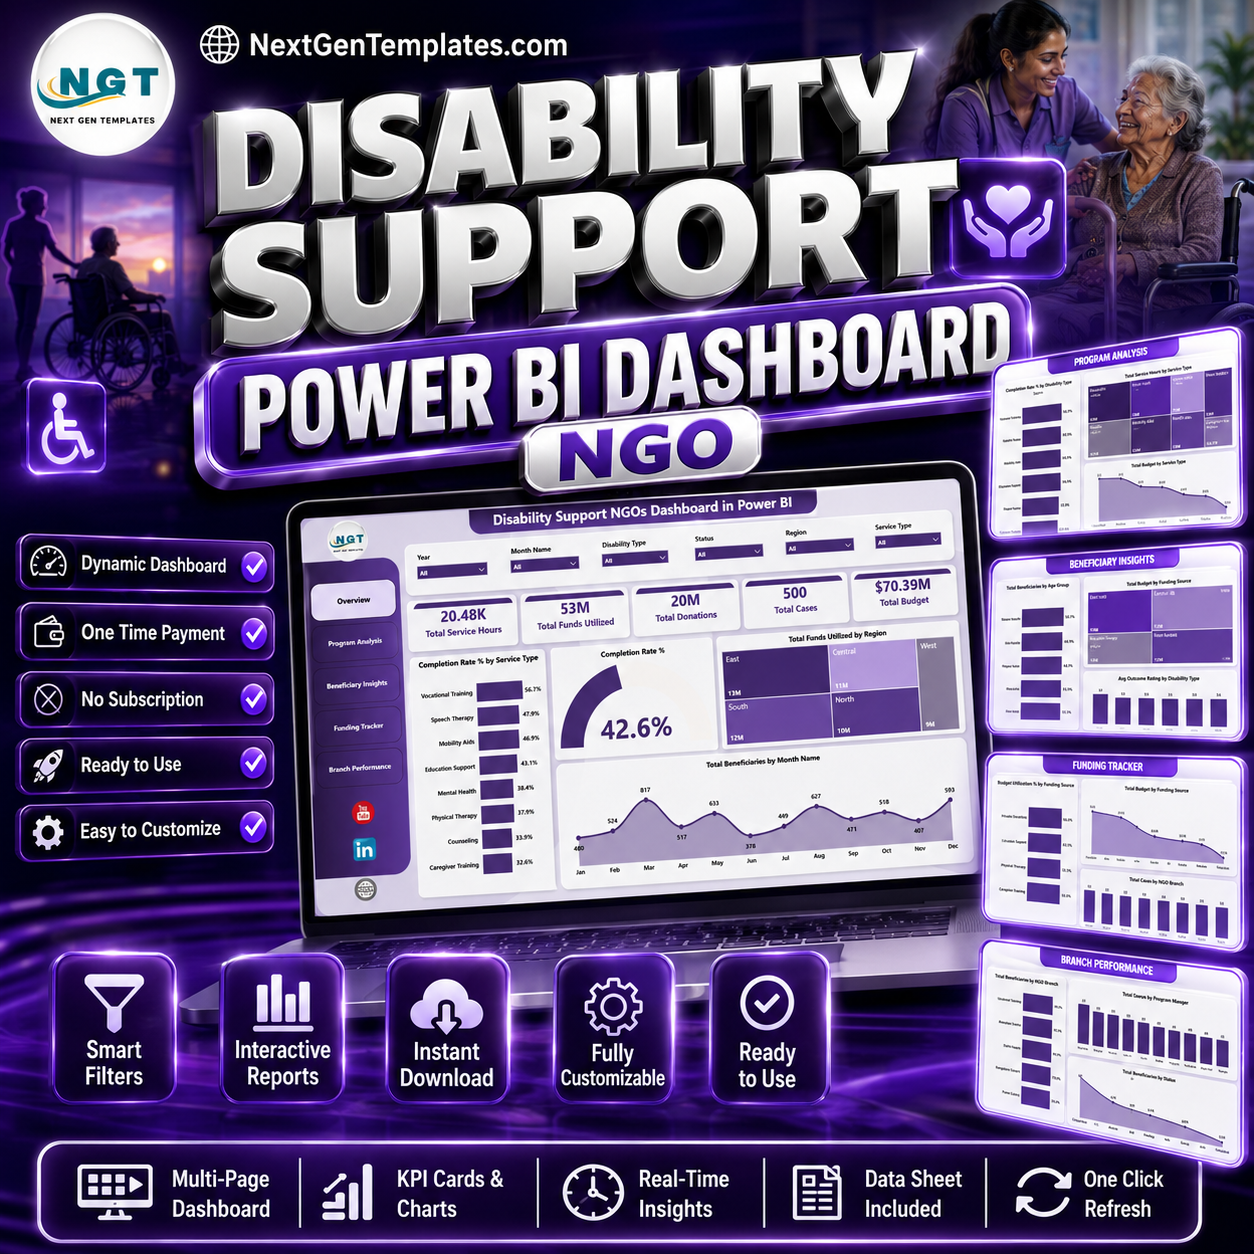
Disability Support NGOs Dashboard in Power BI helps nonprofit and NGO teams monitor service hours, funding utilization, donations, cases, budget, beneficiaries, and branch performance across 5 interactive Power BI pages. The World Health Organization estimates that about 1.3 billion people, or 16% of the global population, experience significant disability, so disability support programs need clear reporting for funding decisions, beneficiary coverage, and service completion. This one-time purchase gives your team a ready Power BI reporting template with no SaaS subscription, no per-user template fee, and a practical structure for monthly program reviews.
Key Features of Disability Support NGOs Dashboard in Power BI
- 5 Power BI report pages: Overview Page, Program Analysis, Beneficiary Insights, Funding Tracker, and Branch Performance.
- 5 high-level KPI cards: Total Service Hours, Total Funds Utilized, Total Donations, Total Cases, and Total Budget.
- Program performance views: Review completion rate by service type, disability type, and overall records.
- Funding analysis: Compare total budget, budget utilization, funds utilized, and funding sources in one report.
- Beneficiary reporting: Analyze beneficiaries by month, age group, branch, disability type, and status.
- Interactive slicers: Filter the dashboard quickly and review focused results without rebuilding visuals.
- Power BI Desktop compatible: Open, edit, and refresh the .pbix file in Microsoft Power BI Desktop.
What’s Inside the Disability Support NGOs Dashboard in Power BI
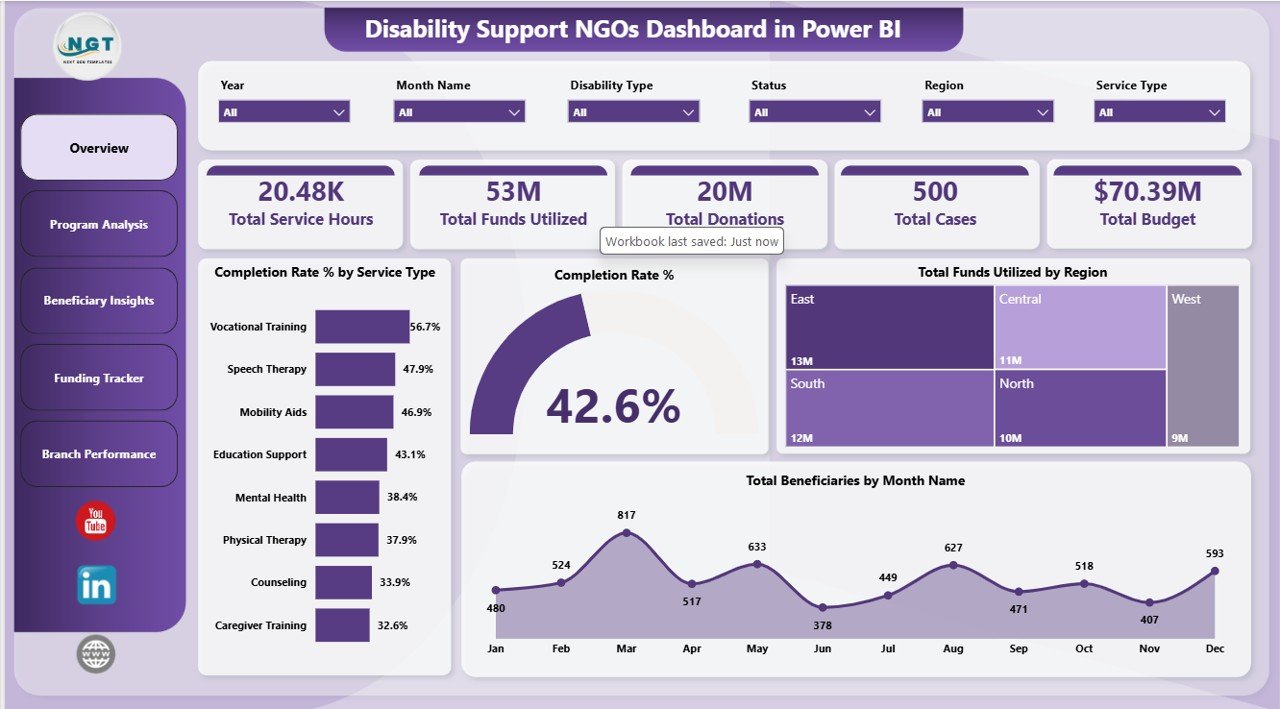
1. Overview Page
The Overview Page gives leadership a quick executive summary of disability support operations. The top KPI cards show Total Service Hours, Total Funds Utilized, Total Donations, Total Cases, and Total Budget, making it easier to review workload, financial usage, fundraising, and case volume in one view.
Completion Rate % by Service Type compares completion performance across services. It helps program teams identify which support areas are completing well and which services need stronger follow-up.
Completion Rate % by Overall Records summarizes overall program completion health. It gives leaders a quick way to understand progress across all records before drilling into service or branch details.
Total Funds Utilized by Region shows where funds are being used geographically. This helps managers compare spending patterns with regional needs and service demand.
Total Beneficiaries by Month Name shows month-wise beneficiary reach. It helps teams spot seasonal demand, outreach progress, and months that may need program review.
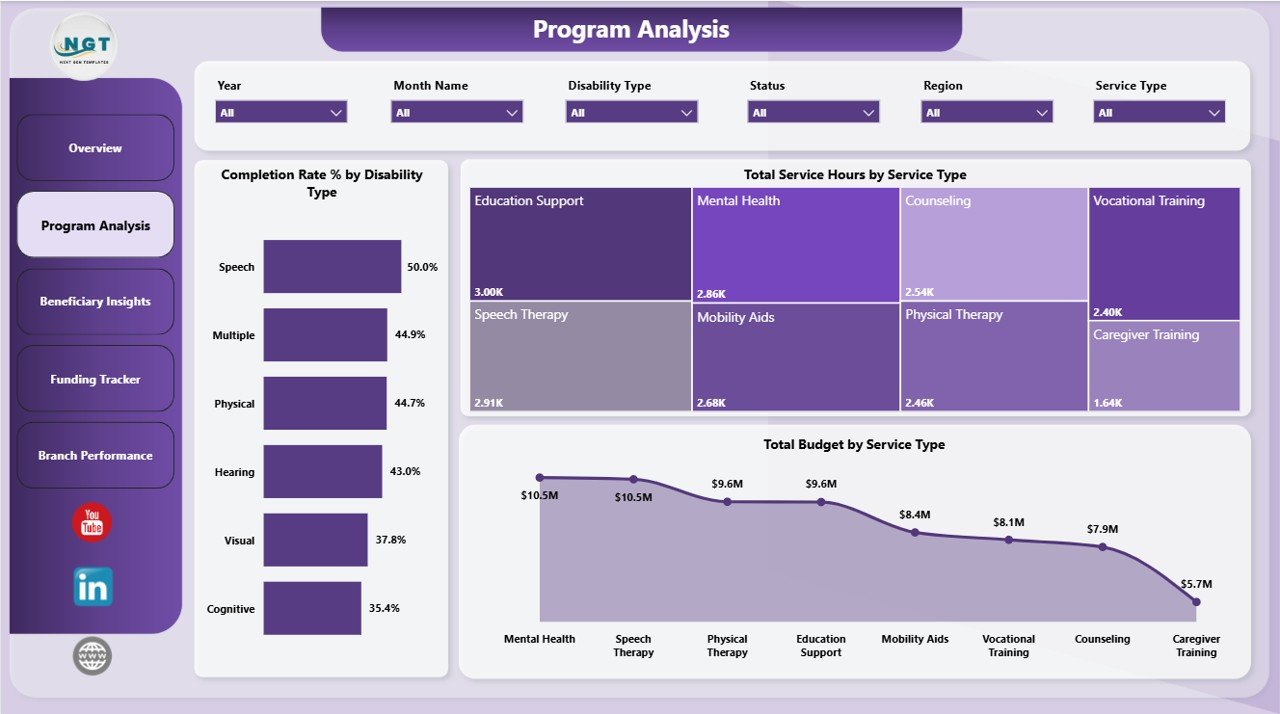
2. Program Analysis
The Program Analysis page focuses on service delivery and program workload. It is useful for managers who need to understand which services consume the most hours, budget, and attention.
Completion Rate % by Disability Type compares completion outcomes across disability categories. This can highlight access barriers or groups that need targeted support.
Total Service Hours by Service Type shows effort spent in each support area. It helps with staff capacity planning, volunteer allocation, and operational review.
Total Budget by Service Type compares budget by support service. It helps finance and program leads check whether funding allocation matches service priorities.
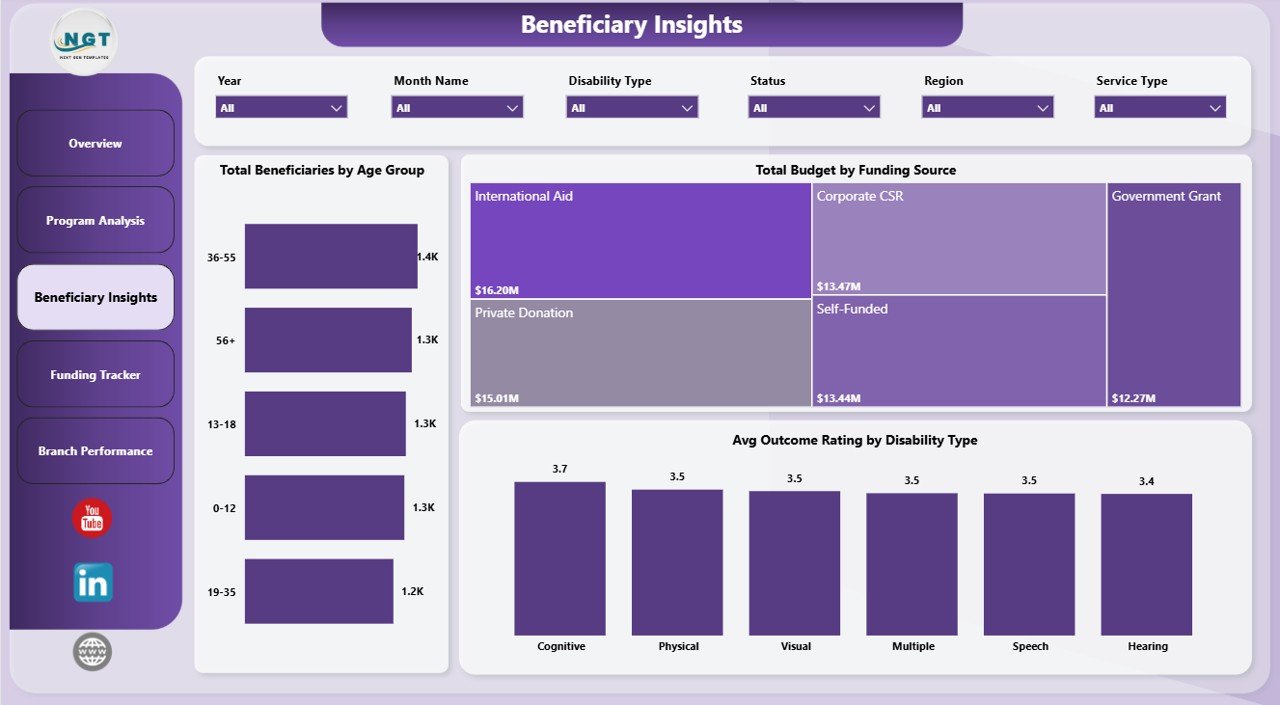
3. Beneficiary Insights
The Beneficiary Insights page helps teams understand the people served by the NGO and how budget and outcomes vary by group.
Total Beneficiaries by Age Group breaks down beneficiary reach by age band. This supports planning for children, adults, seniors, or age-specific support programs.
Total Budget by Funding Source shows how different funding sources support the work. This helps donor reporting teams understand dependency on grants, donations, sponsorships, or internal funds.
Avg Outcome Rating by Disability Type compares outcome ratings by disability category. It helps program teams identify where service design or accessibility may need improvement.
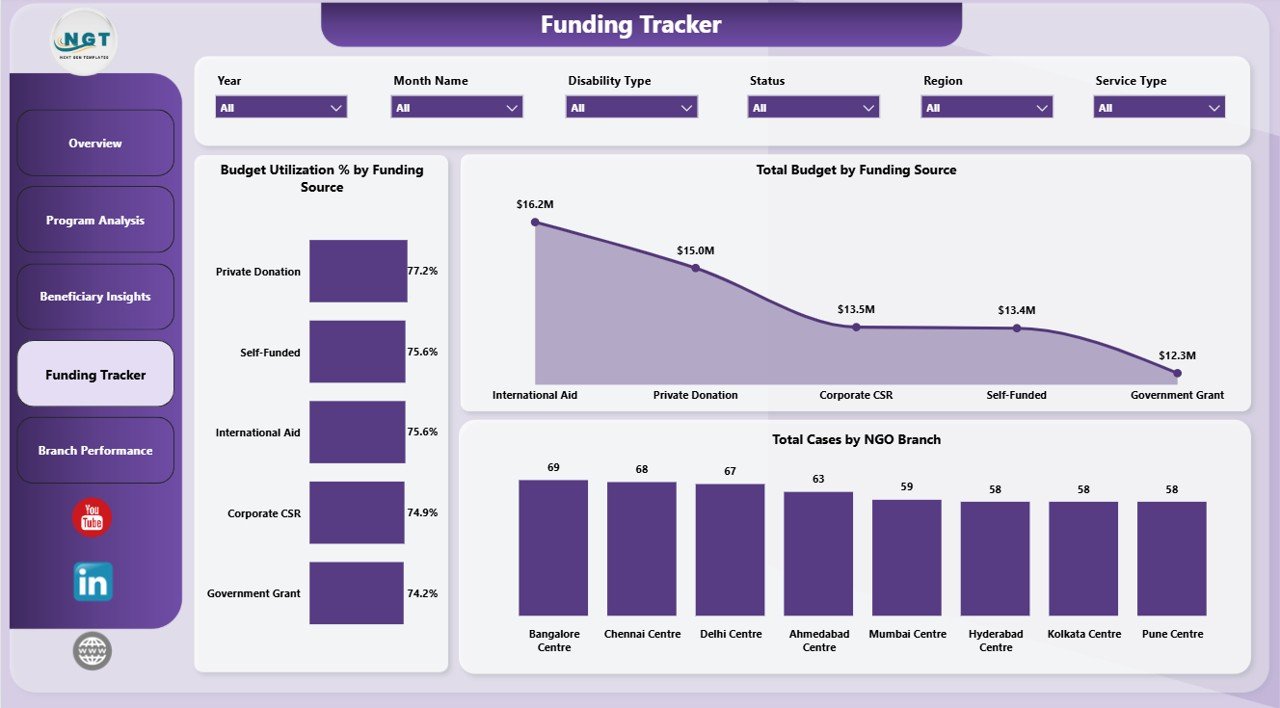
4. Funding Tracker
The Funding Tracker page is designed for grant, donation, and budget monitoring. It helps finance and program leaders connect funding sources with utilization and case load.
Budget Utilization % by Funding Source shows how much of each funding source has been used. It helps prevent underuse, overspending, and last-minute reporting surprises.
Total Budget by Funding Source compares budget value by source. It helps leadership see which funders or funding channels carry the largest share of the program.
Total Cases by NGO Branch compares case volume across branches. This helps leaders check whether high-demand branches are receiving enough funding and support.
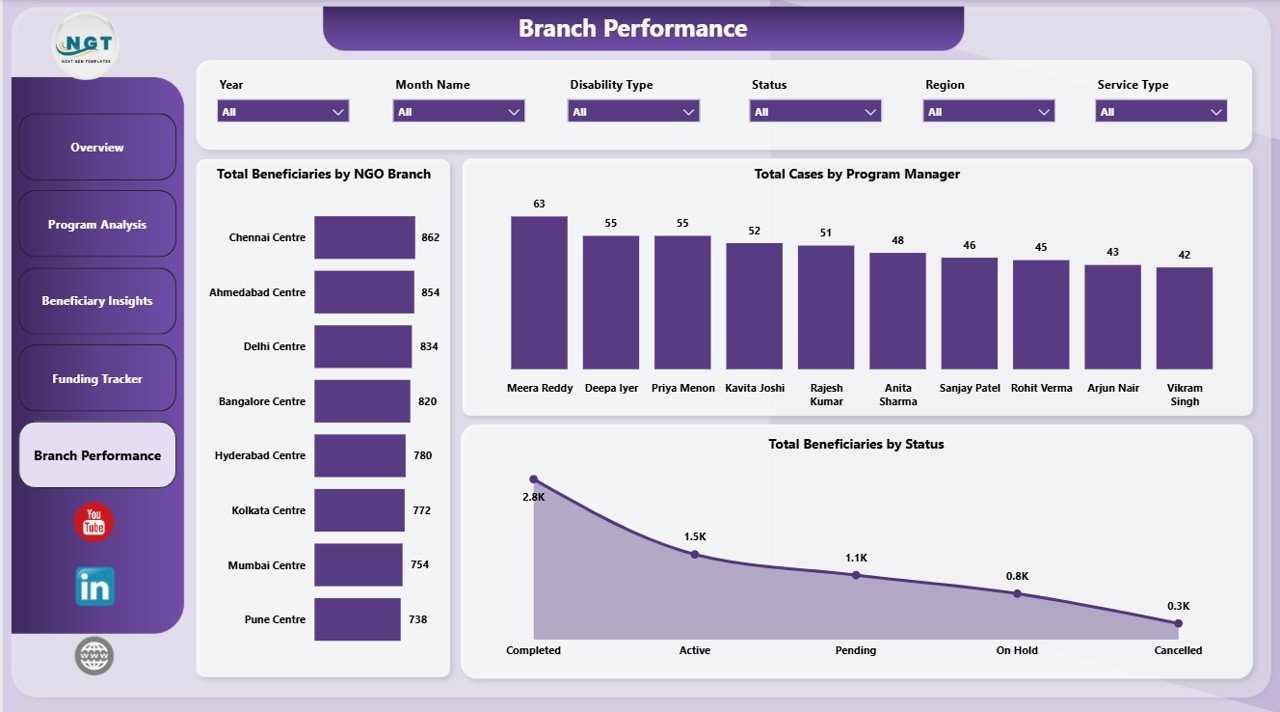
5. Branch Performance
The Branch Performance page helps compare service delivery across branches, program managers, and beneficiary statuses.
Total Beneficiaries by NGO Branch compares reach by branch. It helps managers identify high-volume branches and locations that may need additional outreach.
Total Cases by Program Manager shows case ownership by manager. It supports workload balancing, accountability review, and coaching conversations.
Total Beneficiaries by Status summarizes beneficiary status distribution. It helps teams see progress, pending work, and cases that need timely follow-up.
Disability Support NGOs Dashboard in Power BI vs. Tableau vs. Paid Nonprofit SaaS – Where This Fits
| Feature | This Power BI dashboard | Tableau or Qlik alternative | Paid nonprofit SaaS |
|---|---|---|---|
| Cost | $17.99 one-time | Desktop or cloud licensing | Monthly or annual subscription |
| Platform | Power BI Desktop | Tableau or Qlik | Vendor-hosted web app |
| Setup time | Open .pbix, replace data, refresh | Build visuals and data model | Implementation and onboarding |
| Program and funding charts | Built in | Must be built | Depends on plan |
| Customizable fields | Editable Power BI file | Editable but build-heavy | Limited by vendor setup |
| Year-1 cost at 5 users | $17.99 plus Microsoft licensing if publishing online | Often hundreds or thousands | Often hundreds or thousands |
Who This Template Is For – and Who It’s Not For
This template is for disability support NGOs, nonprofit program directors, branch coordinators, donor reporting teams, grants analysts, service coordinators, and consultants who need a Power BI reporting layer for beneficiaries, service hours, funding, donations, cases, budgets, and branch performance. It is not a donor CRM, accounting system, appointment scheduler, secure beneficiary database, or full case management platform.
How to Use the Disability Support NGOs Dashboard in Power BI
- Download and unzip the product file.
- Open the .pbix file in Power BI Desktop.
- Replace the sample data with your own structured NGO program data.
- Refresh the report to update cards, charts, and slicers.
- Review the Overview, Program Analysis, Beneficiary Insights, Funding Tracker, and Branch Performance pages.
- Use slicers to filter the report for specific branches, services, disability types, funding sources, regions, or statuses where available.
Real-World Use Cases
Amina, NGO program director: Amina reviews the Overview Page before board meetings to explain service hours, funds utilized, donations, cases, and total budget.
Ravi, branch coordinator: Ravi uses Branch Performance to compare case ownership by program manager and identify statuses needing follow-up.
Sofia, grants analyst: Sofia uses Funding Tracker to review budget utilization by funding source before preparing donor updates.
Frequently Asked Questions
What does this dashboard track?
It tracks service hours, funds utilized, donations, cases, budgets, beneficiaries, service types, disability types, funding sources, NGO branches, program managers, regions, outcomes, and statuses.
Do I need Power BI Pro?
No. You can open and edit the file in Power BI Desktop. Power BI Pro is only needed if you publish and share through the Power BI service.
Can I customize this dashboard?
Yes. You can edit visuals, measures, fields, colors, and page layouts in Power BI Desktop.
Is this a case management system?
No. It is a reporting dashboard, not a secure intake, case management, donor CRM, or accounting platform.
Can I use my own NGO data?
Yes. Replace the sample data with your own structured records and refresh the report.
How should sensitive beneficiary data be handled?
Your organization should follow its own privacy, storage, access-control, and data protection policies when using beneficiary data.
About the Author
Built by PK – Microsoft Certified Professional with 15+ years of Excel, Google Sheets, and Power BI experience. Founder of NextGenTemplates, reaching 300K+ subscribers across YouTube channels. Every template is hand-built and tested before release.
Explore Related Templates
You may also like Disability Support NGOs Dashboard in Excel, Special Education Dashboard in Power BI, and Digital Microloans Dashboard in Power BI. Browse more Power BI templates and Power BI dashboard templates.
Download the Disability Support NGOs Dashboard in Power BI today and turn nonprofit service data into clear, filterable reporting.
Last updated: June 2026


Reviews
There are no reviews yet.