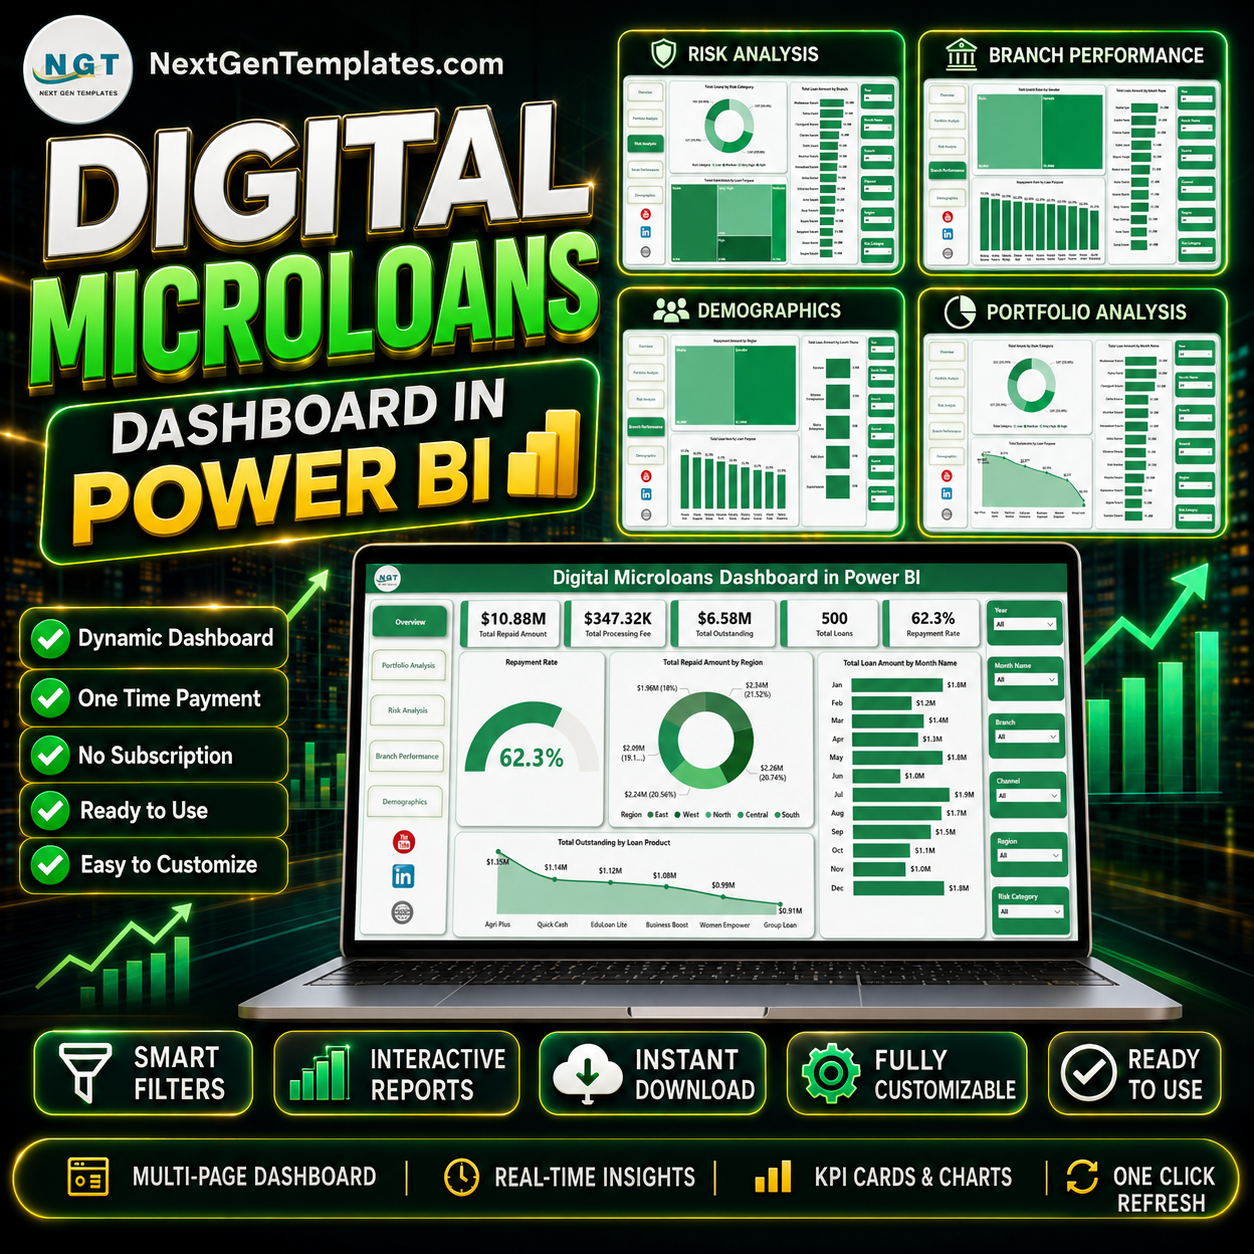

Digital Microloans Dashboard in Power BI gives lending teams 5 focused report pages, executive KPI cards, interactive slicers, and portfolio visuals for repayment, outstanding balance, loan products, branches, officers, risk categories, borrower types, and demographics. Microloan portfolios can shift quickly across regions, channels, loan purposes, and repayment behavior, so a visual Power BI report helps managers review performance without rebuilding charts from raw exports. Join 8,400+ teams in 40+ countries using NextGenTemplates for editable, one-time-purchase dashboard files with no template subscription and no per-user template fee.
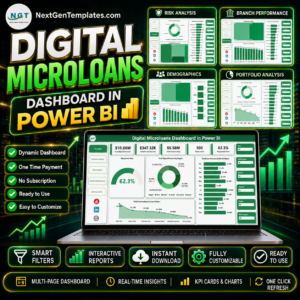
Key Features of Digital Microloans Dashboard in Power BI
- 5 Power BI report pages: Overview Page, Portfolio Analysis, Risk Analysis, Branch Performance, and Demographics.
- Executive KPI cards: Track Total Repaid Amount, Total Processing Fee, Total Outstanding, Total Loans, and Repayment Rate.
- Portfolio analysis: Review loan amount by channel, borrower type, and loan purpose to understand where lending volume is concentrated.
- Risk and branch views: Analyze total loans by risk category, default rate by risk category, loan amount by branch, and officer performance.
- Interactive slicers: Filter the dashboard quickly by key fields and review focused views without rebuilding visuals.
- Editable .pbix file: Change visuals, labels, measures, fields, colors, pages, and data connections in Power BI Desktop.
What’s Inside the Digital Microloans Dashboard in Power BI
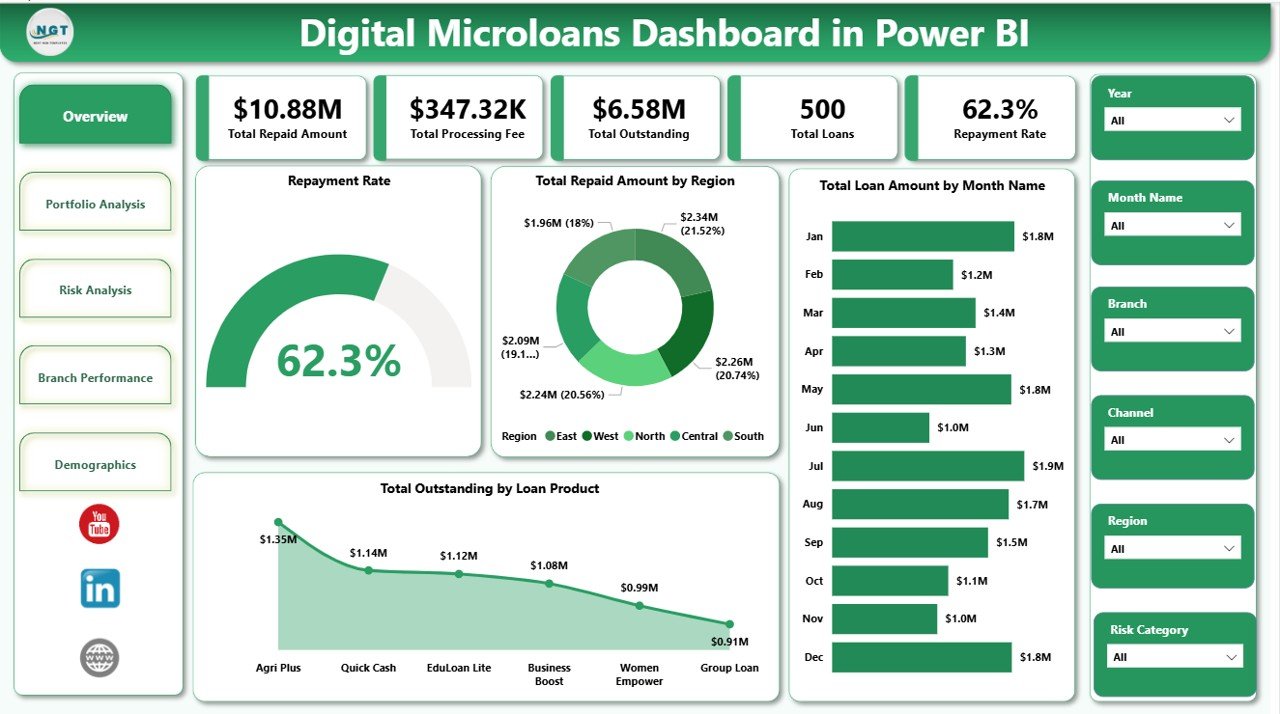
1. Overview Page
The Overview Page is the high-level management view. The KPI cards show Total Repaid Amount, Total Processing Fee, Total Outstanding, Total Loans, and Repayment Rate so managers can quickly understand collections, fee income, open exposure, loan count, and repayment health.
Repayment Rate shows how effectively borrowers are paying against expected repayment. It helps managers identify whether portfolio quality is improving or weakening.
Total Repaid Amount by Region compares repayment value across regions. It is useful for spotting strong collection territories and areas that may need follow-up.
Total Loan Amount by Month Name tracks lending volume across months. Teams can use this to find seasonal patterns, high-disbursement periods, or slow months.
Total Outstanding by Loan Product shows unpaid exposure by product type. It helps credit teams decide where to review pricing, tenure, risk controls, or collection focus.
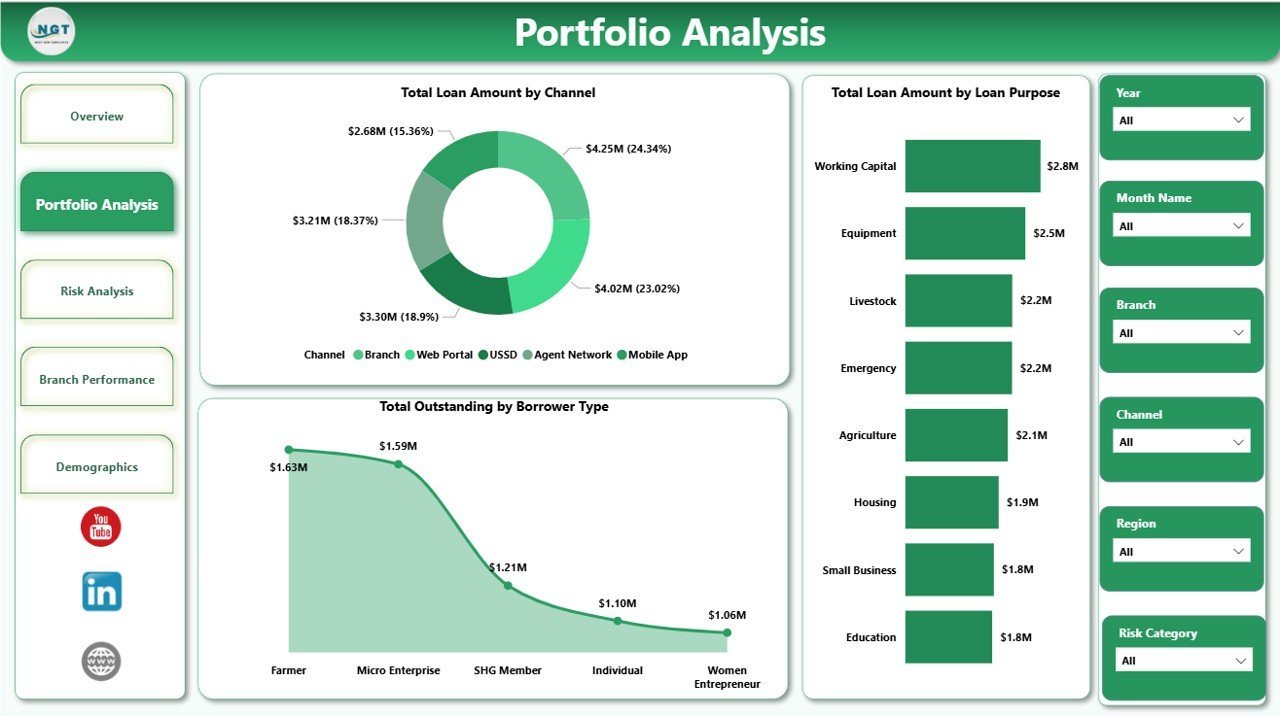
2. Portfolio Analysis
The Portfolio Analysis page explains how the loan book is distributed across channels, borrower groups, and purposes.
Total Loan Amount by Channel compares disbursement across origination channels such as branch, app, partner, agent, or online. This helps digital lenders see which channels produce the most portfolio volume.
Total Outstanding by Borrower Type identifies where unpaid exposure is concentrated by customer group. It supports sharper monitoring of borrower segments that carry higher open balances.
Total Loan Amount by Loan Purpose shows why borrowers take loans and which use cases drive lending value. This can support product planning, outreach, and borrower education.

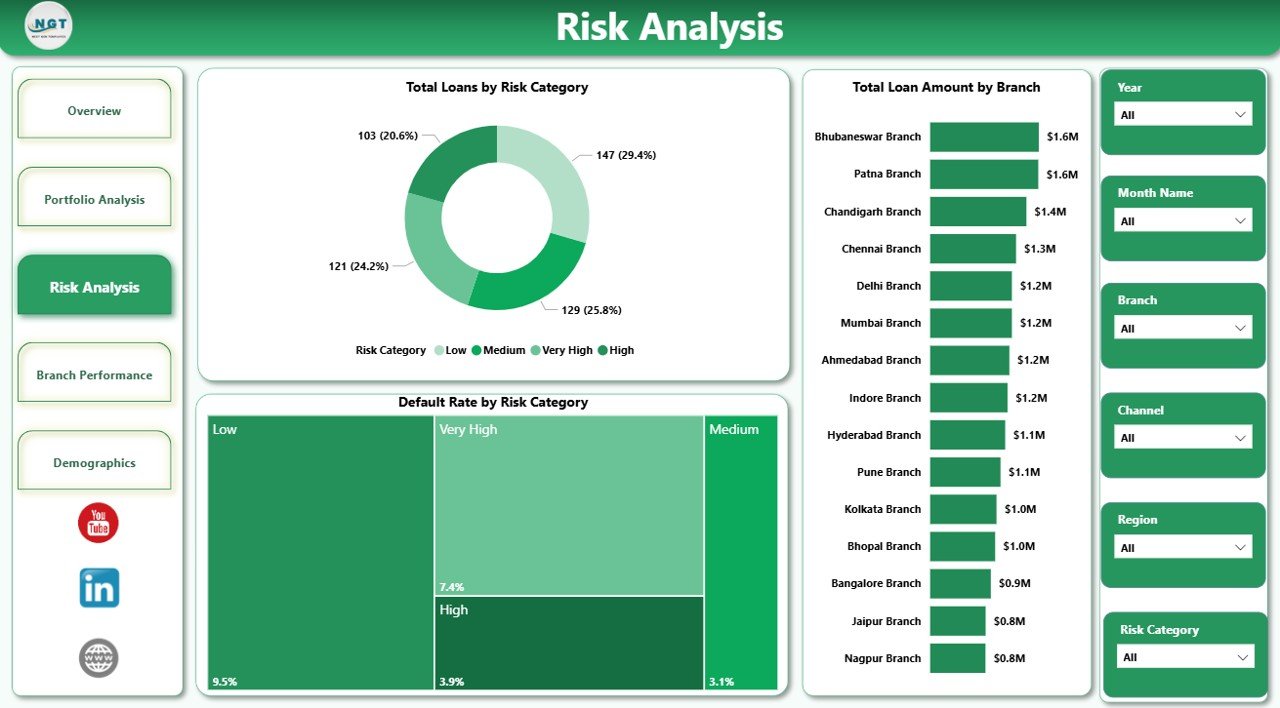
3. Risk Analysis
The Risk Analysis page is built for credit, operations, and portfolio review teams.
Total Loans by Risk Category counts the number of loans in each risk group. This helps teams see whether the portfolio is becoming more conservative or more risk-heavy.
Default Rate by Risk Category compares default behavior across risk tiers. If a lower-risk category shows a high default rate, the team can review scoring and underwriting assumptions.
Total Loan Amount by Branch compares disbursement value across branches. Branch leaders can review growth, exposure, and risk together.
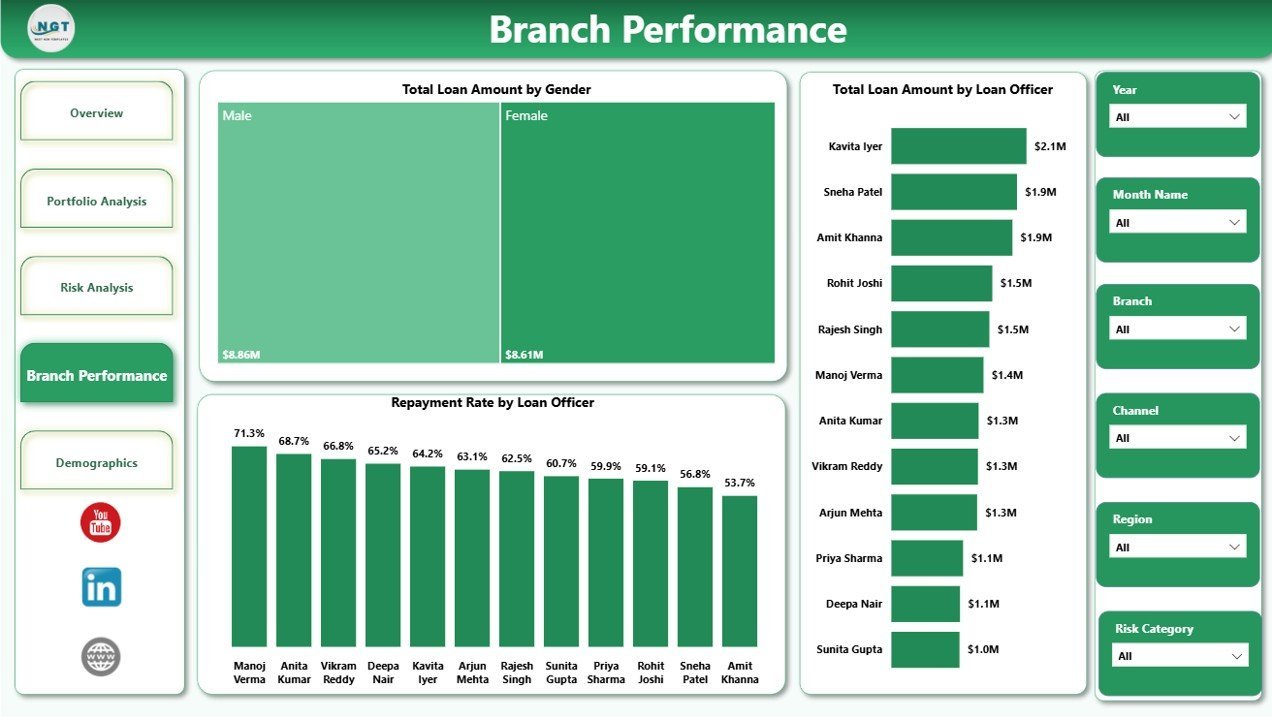
4. Branch Performance
The Branch Performance page helps leaders compare field activity and officer results.
Total Loan Amount by Gender shows lending distribution by borrower gender. It can support inclusion reporting and borrower segment review.
Repayment Rate by Loan Officer compares collection effectiveness across officers. Managers can use it to identify coaching needs and recognize strong repayment management.
Total Loan Amount by Loan Officer compares officer-managed lending volume. Used with repayment rate, it gives a balanced view of volume and quality.

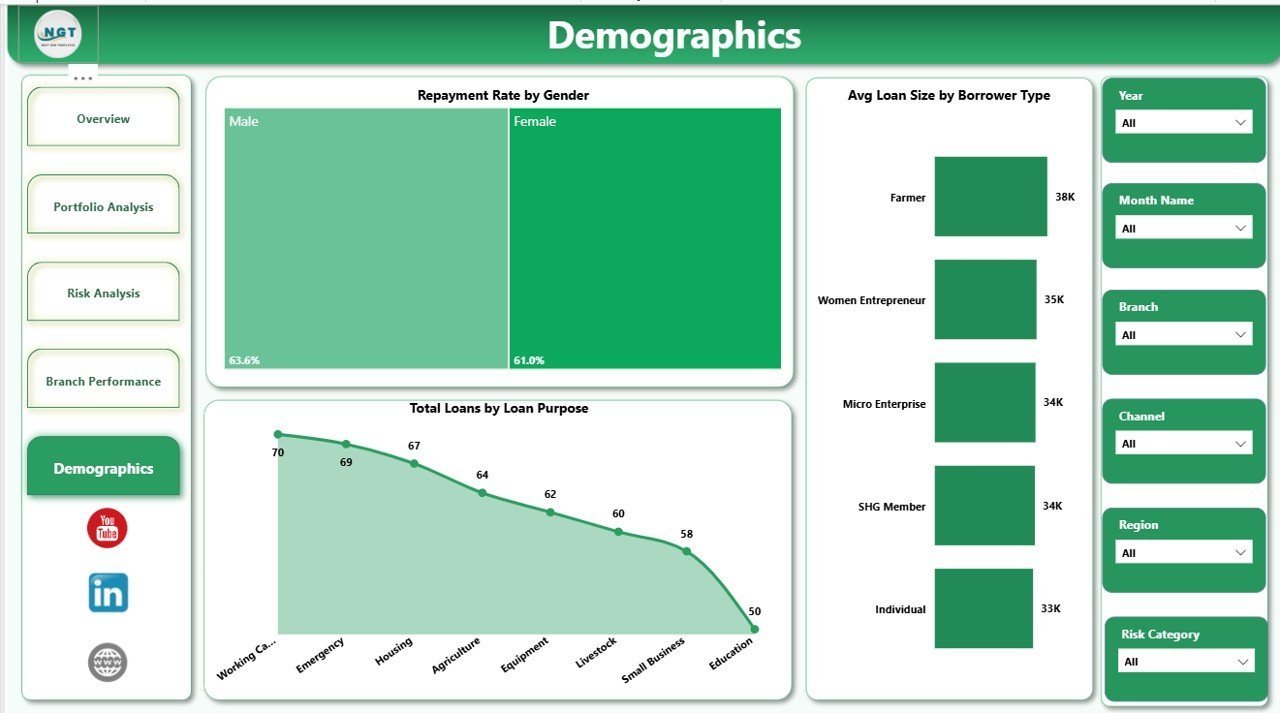
5. Demographics
The Demographics page helps teams understand borrower mix and repayment patterns.
Repayment Rate by Gender compares repayment behavior across gender groups. It can help identify differences that deserve deeper borrower support review.
Total Loans by Loan Purpose shows loan count by borrower use case. This separates high-volume purposes from high-value purposes seen in portfolio charts.
Avg Loan Size by Borrower Type compares average ticket size across borrower groups. It helps teams review limits, product fit, and borrower segment strategy.

Digital Microloans Dashboard in Power BI vs. Tableau vs. Paid Lending SaaS – Where This Fits
| Feature | This Power BI dashboard | Tableau alternative | Paid lending SaaS |
|---|---|---|---|
| Cost | $17.99 one-time | License plus build time | Monthly or annual subscription |
| Platform | Power BI Desktop | Tableau Desktop or Cloud | Vendor-hosted system |
| Setup time | Open .pbix and replace or connect data | Build model and visuals | Implementation and configuration |
| Customizable fields | Editable report and model | Editable with Tableau skills | Limited by vendor reporting options |
| Microloan portfolio analysis | Built in | Must be designed | Depends on plan |
| Year-1 cost at 5 users | $17.99 plus any Microsoft licensing | Often much higher | Often hundreds or thousands |
Who This Template Is For – and Who It’s Not For
This template is for microfinance institutions, digital lending startups, NGO lending programs, branch managers, loan officers, finance analysts, portfolio managers, credit teams, and consultants who need an editable Power BI reporting layer for microloan data. It is not a loan origination system, repayment collection app, borrower communication workflow, credit scoring engine, or live core banking replacement.
How to Use the Digital Microloans Dashboard in Power BI
- Download and unzip the product file.
- Open the .pbix file in Power BI Desktop.
- Review the sample data structure and replace it with your own approved microloan data.
- Refresh the report and validate KPI totals.
- Use slicers to filter by branch, region, risk category, loan product, borrower type, channel, purpose, officer, month, or gender.
- Publish to Power BI Service only after reviewing your organization’s data privacy and sharing rules.
Real-World Use Cases
Asha, microfinance portfolio manager: Asha reviews the Overview and Risk Analysis pages before monthly portfolio meetings to explain repayment rate, outstanding balance, default exposure, and risk category movement.
Daniel, digital lending operations lead: Daniel uses Portfolio Analysis to compare loan amount by channel and purpose so the team can decide which acquisition channels need more monitoring.
Meera, branch performance analyst: Meera uses Repayment Rate by Loan Officer and Total Loan Amount by Loan Officer to prepare coaching conversations with branch teams.
Frequently Asked Questions
What does this dashboard track?
It tracks repayment rate, total repaid amount, processing fee, outstanding amount, total loans, region, month, loan product, channel, borrower type, loan purpose, risk category, branch, gender, loan officer, and average loan size.
Do I need Power BI Desktop?
Yes. The .pbix file is designed to open and edit in Power BI Desktop, which is available from Microsoft.
Can I customize the report?
Yes. You can edit visuals, fields, measures, labels, colors, page names, and data source connections.
Does it connect live to my lending software?
No live connector is included. You can replace the sample data or connect your own approved data source inside Power BI.
Can this replace lending software?
No. This is a reporting dashboard, not loan origination, collection automation, borrower communication, or accounting software.
Can I publish it to Power BI Service?
Yes, if your Microsoft account and organization permissions allow it. Review privacy, access, and borrower-data rules before sharing.
About the Author
Built by PK – Microsoft Certified Professional with 15+ years of Excel, Google Sheets, and Power BI experience. Founder of NextGenTemplates, reaching 300K+ subscribers across YouTube channels. Every template is hand-built and tested before release.
Explore Related Templates
You may also like Digital Microloans Dashboard in Excel, Microfinance Institutions Dashboard in Excel, Credit Union Dashboard in Power BI, and Buy-Now-Pay-Later Platforms Dashboard in Excel. Browse more Power BI templates and Power BI dashboard templates.
Download the Digital Microloans Dashboard in Power BI today and turn microloan portfolio data into clear, interactive reporting.
Last updated: June 2026


Reviews
There are no reviews yet.