
Cross-border trade can lose margin quickly when clearance delays, documentation errors, compliance costs, and provider fees are tracked in separate files. This Cross-border Trade Services Dashboard in Excel gives import-export teams a ready-to-use workbook for monitoring trade value, service fees, net fees, shipment volume, and average clearance days in one place. Built in Microsoft Excel, it helps teams replace scattered reports with a refreshable dashboard system backed by a structured data sheet and pivot support sheet.
The workbook is designed for trade service providers, freight teams, customs brokers, logistics analysts, and finance managers who need clear visibility into shipment status, transport modes, service type performance, provider costs, compliance results, and country-level trade lanes. You can update the data sheet, refresh the workbook, and review all dashboard pages without building the model from scratch.
Key Features of Cross-border Trade Services Dashboard in Excel
- Multi-page Excel dashboard: Includes Overview, Provider View, Lane Analysis, Compliance, Financials, Data, and Support sheets.
- High-level KPI cards: Track Total Trade Value, Total Service Fee, Total Net Fee, Total Shipments, and Avg. Clearance Days.
- Interactive slicers: Filter the dashboard quickly by key business dimensions and review focused results without manual formulas.
- Provider performance analysis: Compare shipments, service fees, trade value, service types, commodities, and provider-level contribution.
- Trade lane visibility: Analyze quarters, transport modes, compliance status, origin countries, and destination countries.
- Compliance monitoring: Review compliance percentage, clearance bands, documentation errors, and net fee movement by month.
- Financial reporting: Track net fee by year, service fee by origin country, compliance cost by provider, and trade value by provider.
- Editable source data: Replace sample records in the Data sheet using the same column structure, then refresh all pivots and charts.
What’s Inside the Cross-border Trade Services Dashboard in Excel
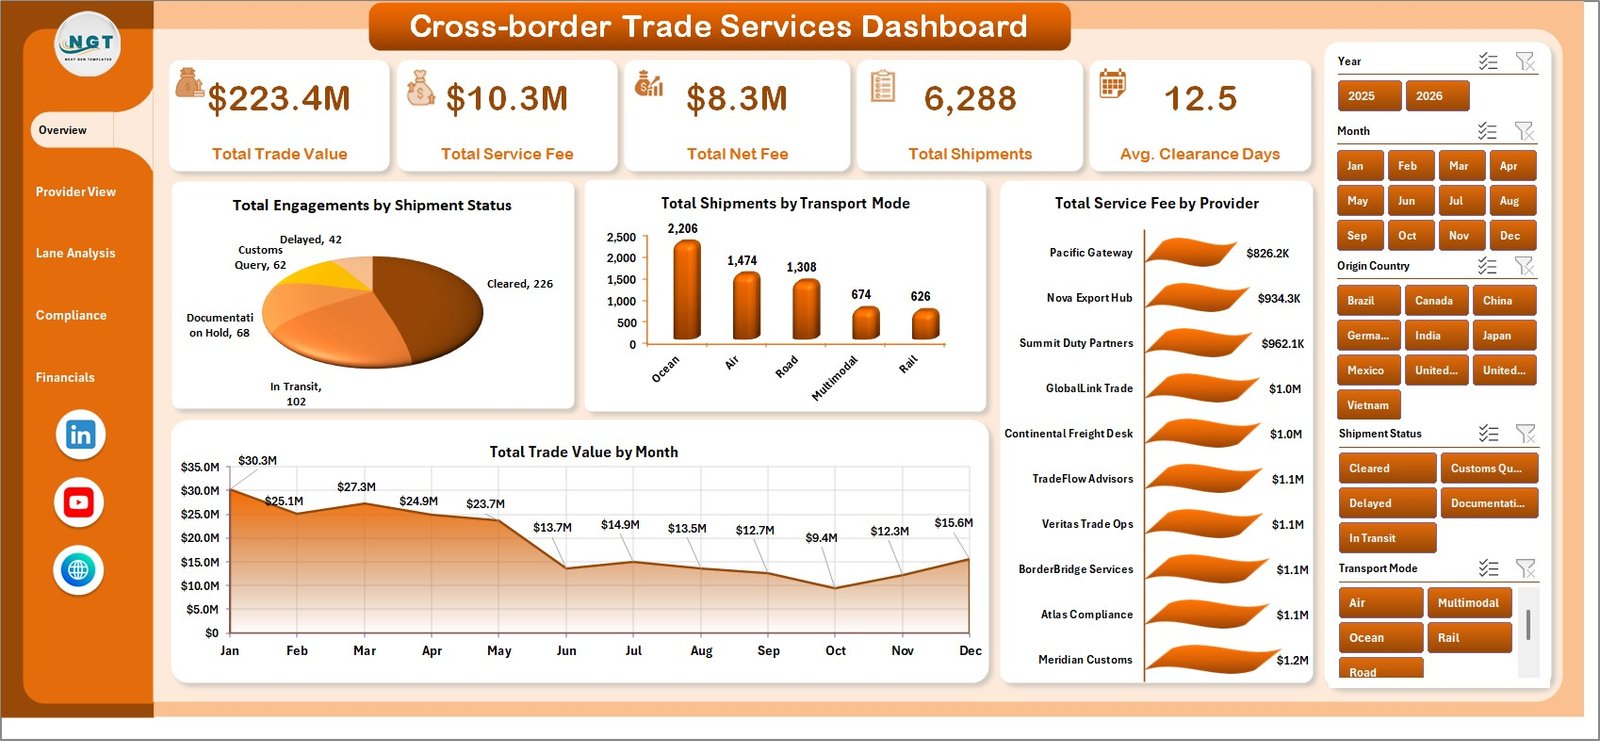
1. Overview Page
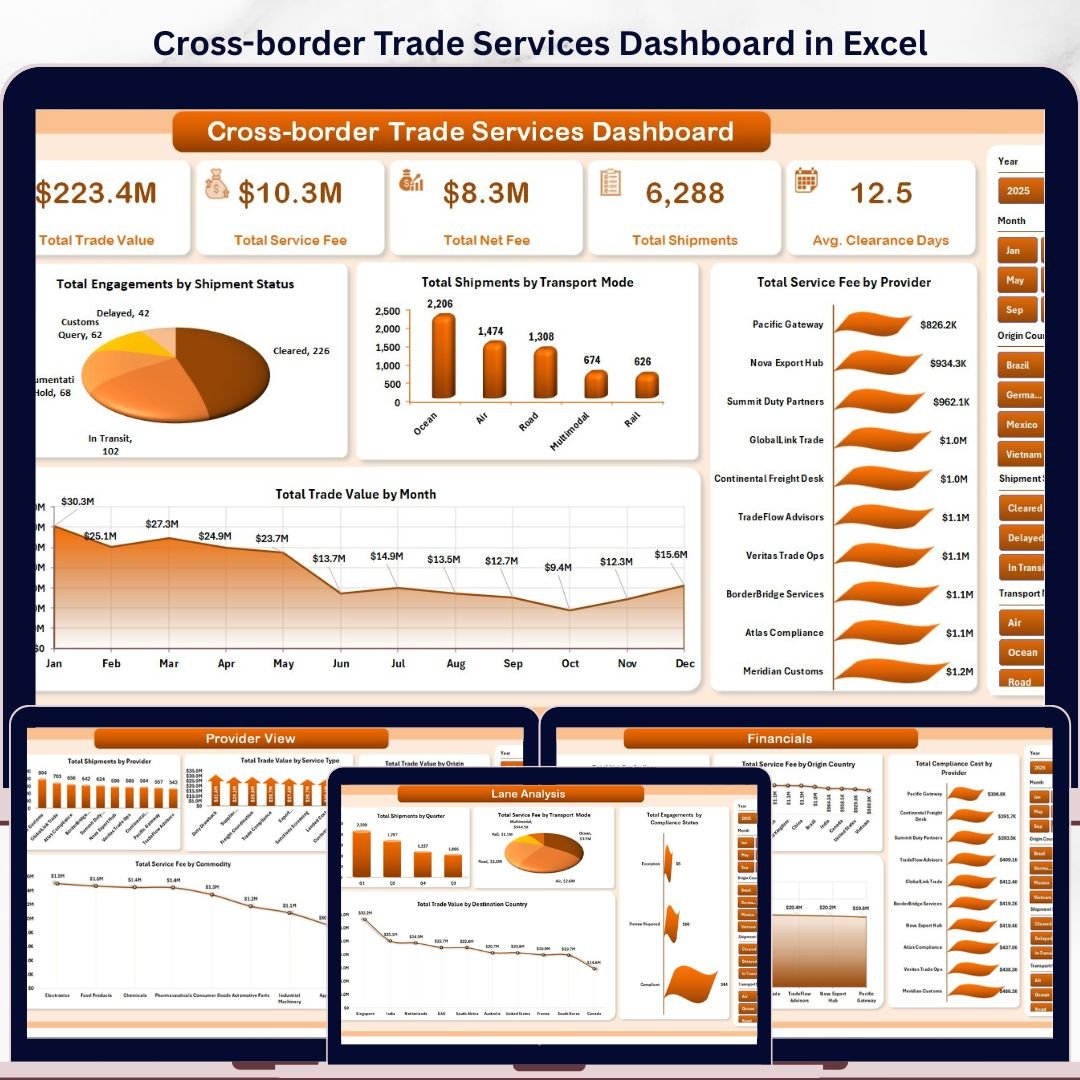
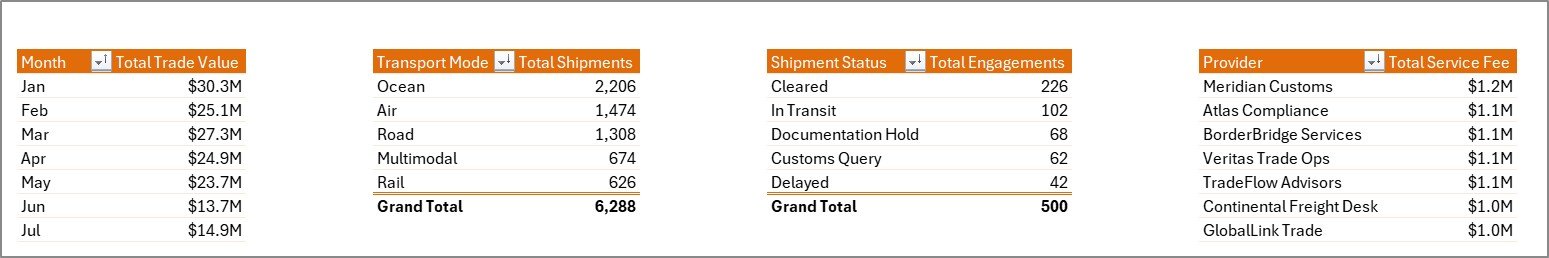
The Overview page gives leadership a fast summary of overall trade services activity. KPI cards show Total Trade Value, Total Service Fee, Total Net Fee, Total Shipments, and Avg. Clearance Days. The page also includes slicers for quick filtering and four charts: Total Engagements by Shipment Status, Total Shipments by Transport Mode, Total Service Fee by Provider, and Total Trade Value by Month.
Total Engagements by Shipment Status helps users see whether trade engagements are completed, delayed, pending, or in another operational state. Total Shipments by Transport Mode compares how volume is distributed across air, sea, road, rail, or other modes. Total Service Fee by Provider identifies which service providers contribute the highest fee totals. Total Trade Value by Month reveals seasonal movement and monthly trade value changes.
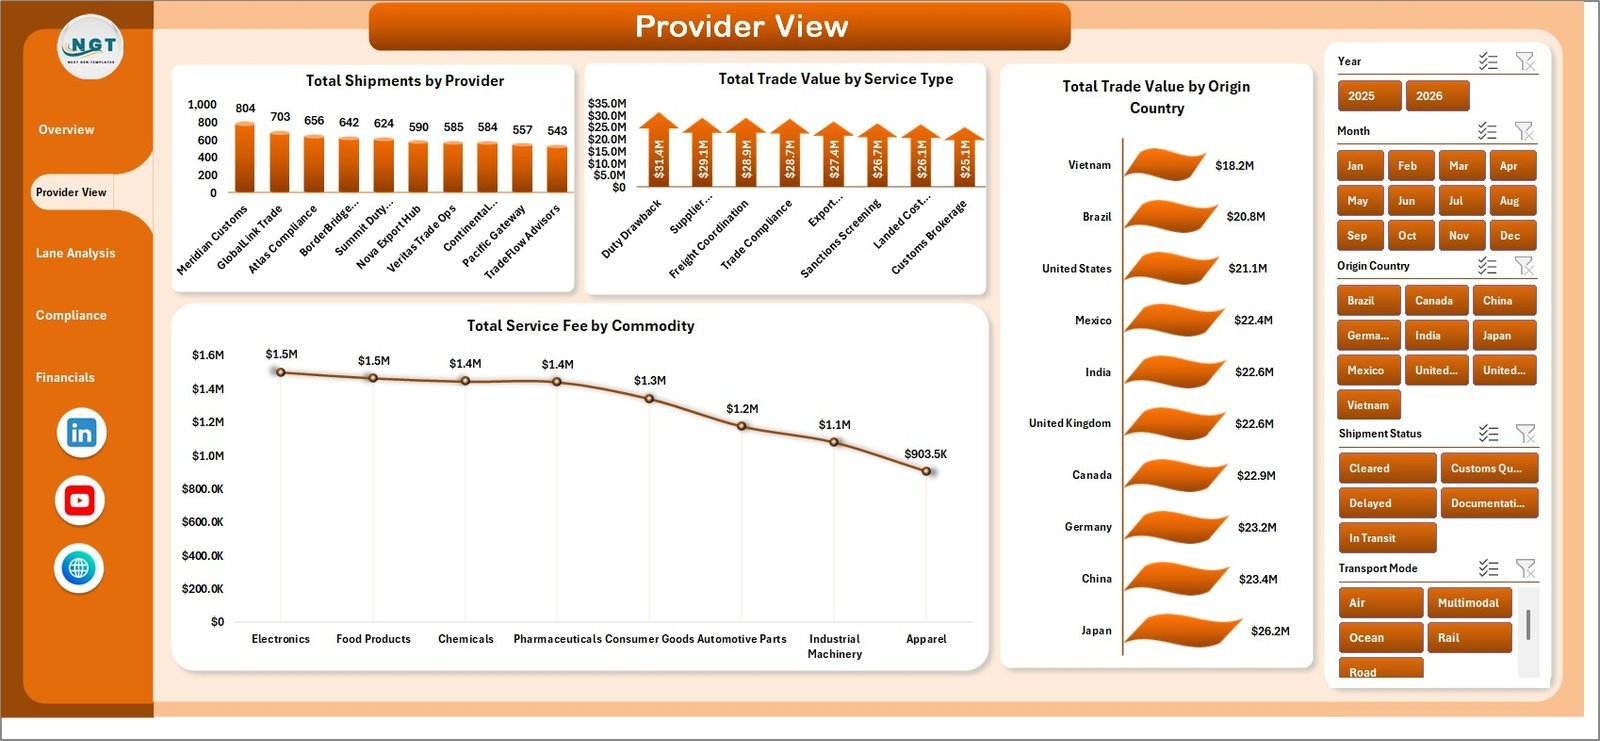
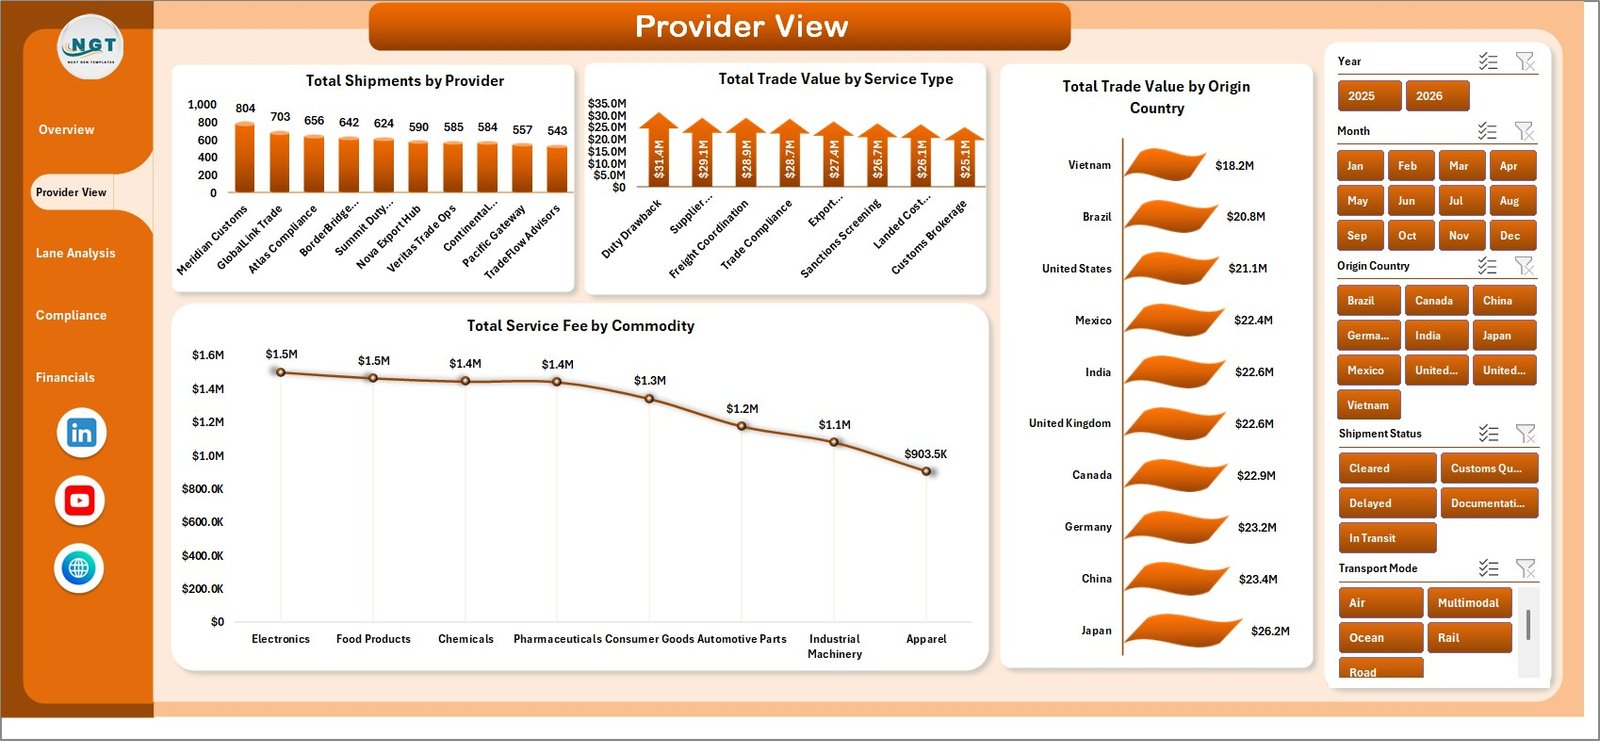
2. Provider View
The Provider View page focuses on provider-level and service-level performance. It includes Total Shipments by Provider, Total Trade Value by Service Type, Total Trade Value by Origin Country, and Total Service Fee by Commodity.
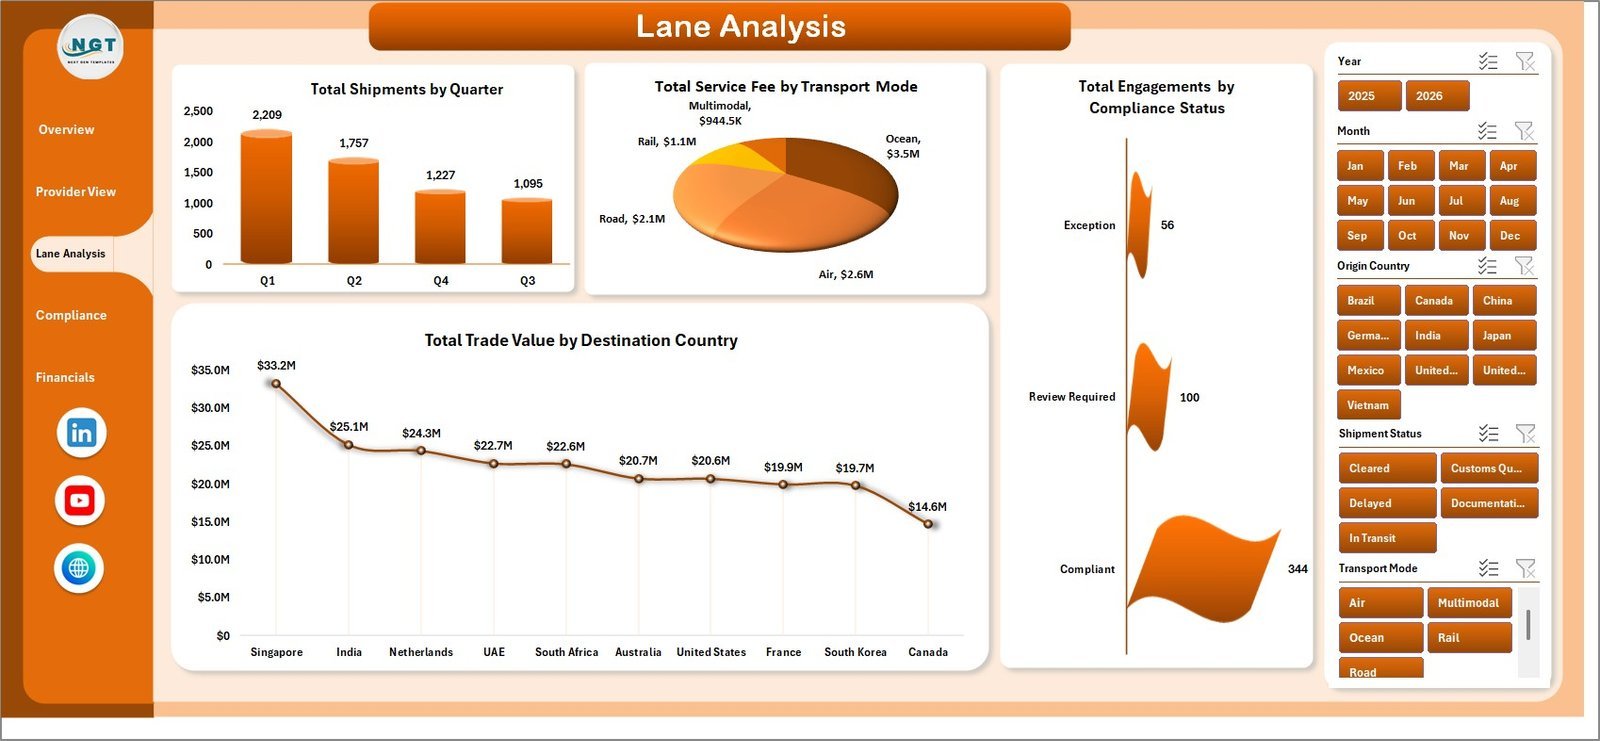
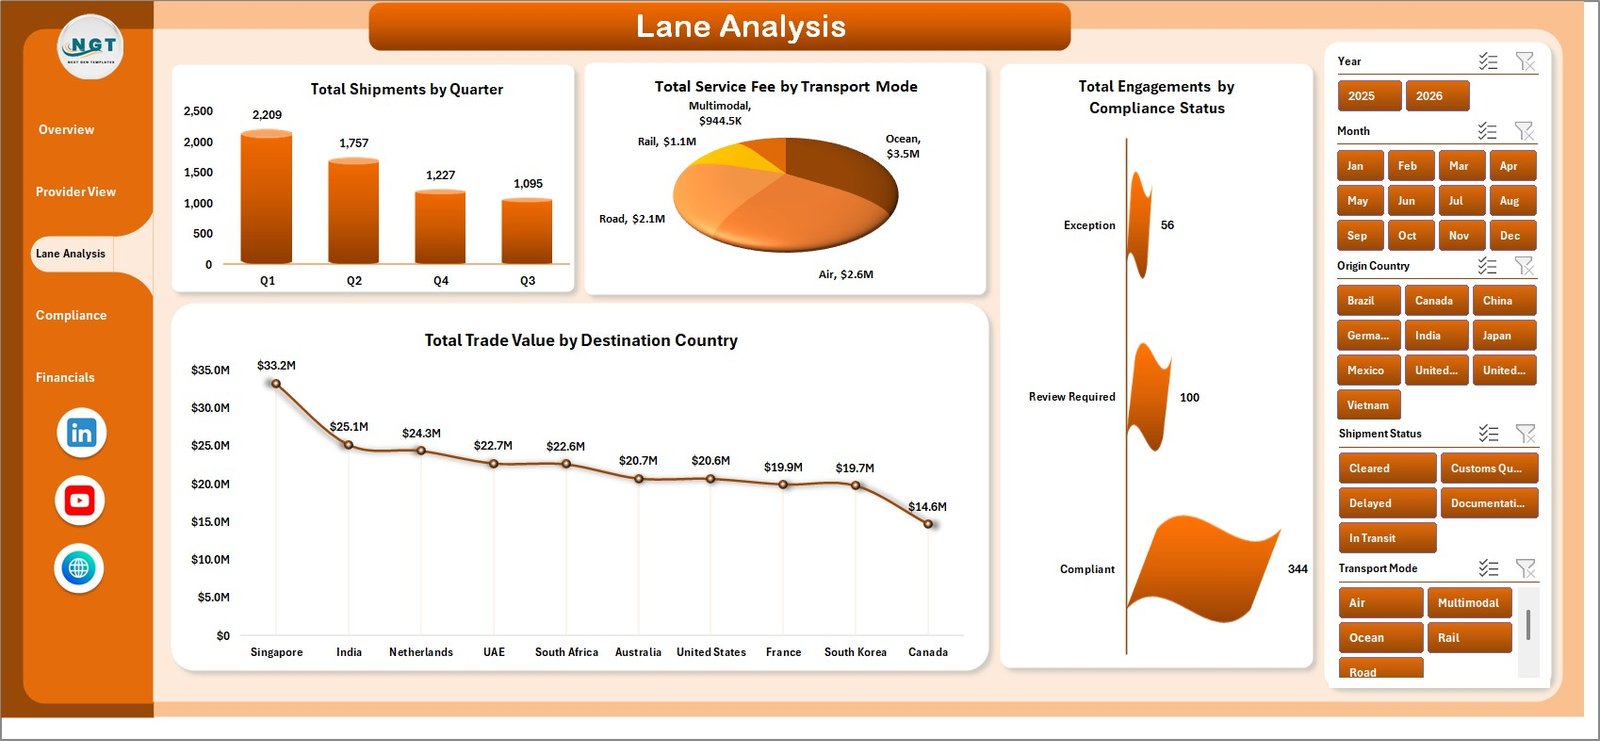
3. Lane Analysis
The Lane Analysis sheet helps teams understand shipment trends across time, transport, compliance status, and destination markets. It includes Total Shipments by Quarter, Total Service Fee by Transport Mode, Total Engagements by Compliance Status, and Total Trade Value by Destination Country.
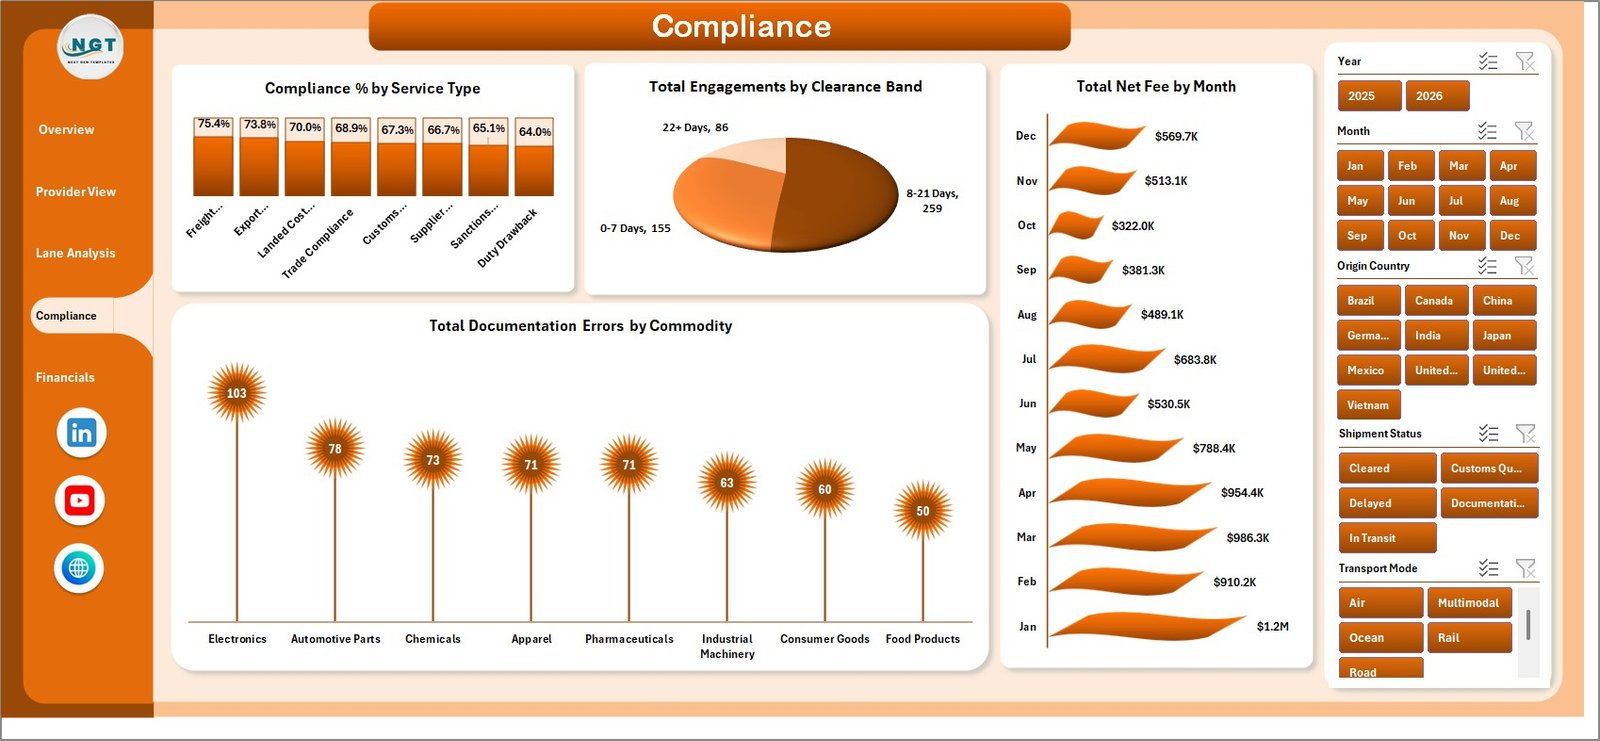
4. Compliance
The Compliance page is built for customs, regulatory, and documentation review. It includes Compliance % by Service Type, Total Engagements by Clearance Band, Total Net Fee by Month, and Total Documentation Errors by Commodity.
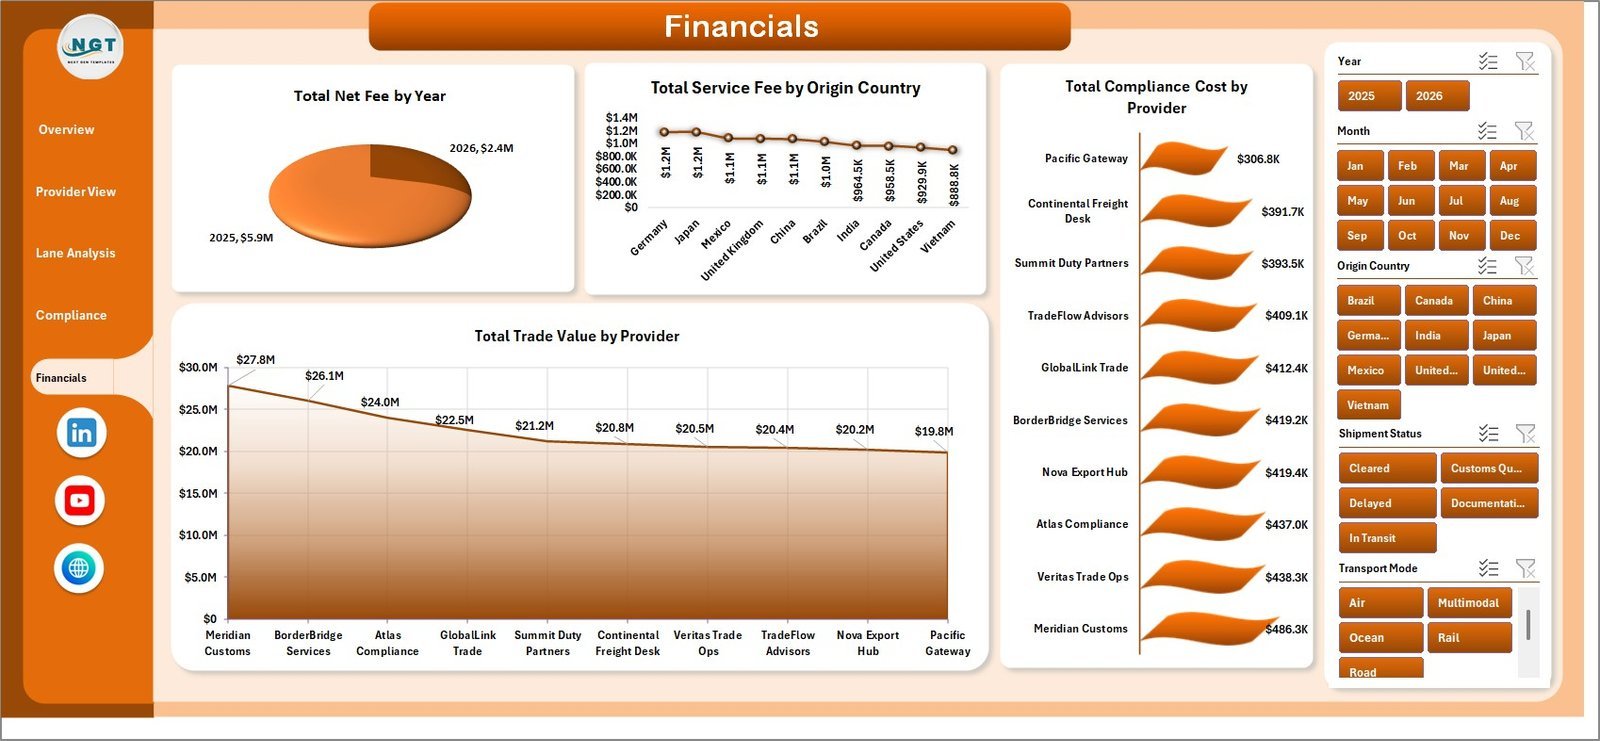
5. Financials
The Financials page gives finance and operations managers a clear view of fee and cost performance. It includes Total Net Fee by Year, Total Service Fee by Origin Country, Total Compliance Cost by Provider, and Total Trade Value by Provider.

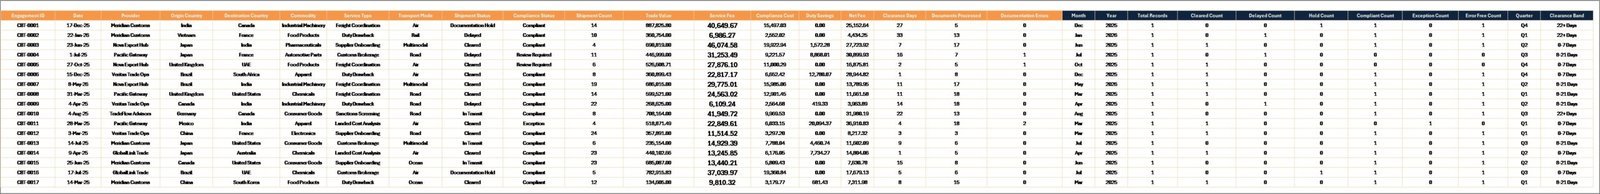
6. Data Sheet
The Data sheet stores the source records. Replace the sample data using the same format and keep the column structure intact so the dashboard refreshes correctly.

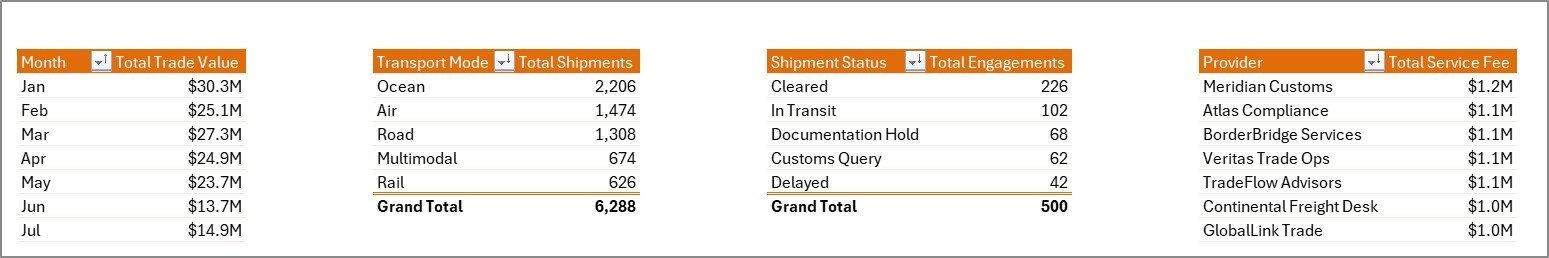
7. Support Sheet
The Support sheet contains the pivot tables used to power the dashboard. After updating the Data sheet, go to the Data tab in the Excel ribbon and click Refresh All. The pivots and charts will update, and you can keep the Support sheet hidden during normal use.
Cross-border Trade Services Dashboard in Excel vs. Google Sheets vs. Paid Logistics SaaS – Where This Fits
| Area | This Excel Dashboard | Google Sheets Alternative | Paid Logistics SaaS |
|---|---|---|---|
| Cost | One-time template purchase | Low cost, but dashboard build still needed | Monthly subscription per user or account |
| Platform | Microsoft Excel | Browser-based spreadsheet | Cloud logistics or trade platform |
| Setup time | Start by replacing sample data | Requires sheet design and chart setup | Requires onboarding and configuration |
| Customization | Edit formulas, pivots, charts, and data fields | Flexible, but may slow with larger data | Depends on vendor permissions |
| Best fit | Internal reporting, monthly analysis, provider review | Small teams needing live collaboration | Large operations needing workflow automation |
| Year-1 cost at 5 users | Template price only | Workspace subscription may apply | Can reach hundreds or thousands of dollars |
Who This Template Is For – and Who It’s Not For
This dashboard is for import-export businesses, freight forwarders, customs brokers, trade compliance teams, logistics analysts, finance managers, and consultants who need a practical Excel reporting file for cross-border services. It is especially useful when the team already collects shipment, provider, fee, clearance, and compliance data but needs a cleaner way to analyze it.
It is not the right fit if you need real-time shipment tracking, automated customs filing, ERP integration out of the box, or multi-user permissions inside a cloud application. In those cases, a dedicated logistics or trade management SaaS may be better.
How to Use the Cross-border Trade Services Dashboard in Excel
- Download and unzip the dashboard file.
- Open the workbook in Microsoft Excel.
- Go to the Data sheet and replace the sample records with your own trade services data.
- Keep the same column names and structure for reliable refresh behavior.
- Open the Data tab in the Excel ribbon and click Refresh All.
- Use the slicers on the dashboard pages to filter by provider, country, transport mode, service type, status, or other available fields.
- Review Overview, Provider View, Lane Analysis, Compliance, and Financials pages for insights.
Real-World Use Cases
Logistics Manager: A logistics manager can track which transport modes handle the most shipments and whether clearance days are improving across trade lanes.
Trade Compliance Lead: A compliance lead can monitor documentation errors by commodity and review compliance percentage across service types.
Finance Analyst: A finance analyst can compare service fee, net fee, compliance cost, and trade value by provider, origin country, and year.
Frequently Asked Questions
Can I use this dashboard with my own trade services data?
Yes. Replace the sample records in the Data sheet using the same structure, then refresh all pivot tables and charts.
Do I need advanced Excel skills?
No advanced development skills are required for normal use. You should be comfortable entering data, refreshing pivots, and using slicers.
Can I add new providers, commodities, or countries?
Yes. Add them as values in the Data sheet. When you refresh the workbook, the pivots and charts can include the new values.
Can I hide the Support sheet?
Yes. The Support sheet contains pivot tables used by the dashboard. You can keep it hidden after confirming the dashboard refreshes correctly.
Does this template connect to live shipping systems?
No. This is an Excel dashboard template. You can extend it with Power Query or external data connections if your workflow requires automation.
About the Author
Built by PK – Microsoft Certified Professional with 15+ years of Excel, Google Sheets, and Power BI experience. Founder of NextGenTemplates, reaching 300K+ subscribers across YouTube channels. Every template is hand-built and tested before release.
Explore Related Templates
Explore more Excel dashboard templates and related logistics tools from NextGenTemplates, including Port Logistics Dashboard in Power BI, Cross-border Trade Services KPI Dashboard in Excel, and Export Compliance KPI Dashboard in Excel.
Ready to analyze cross-border trade service performance in Excel? Download the template, replace the sample data, refresh the workbook, and start reviewing your trade services KPIs today.
Last updated: May 23, 2026
🔗 Click here to read the Detailed blog post