



The Online Marketplaces KPI Dashboard in Excel is a powerful and comprehensive tool designed for e-commerce business owners, online retailers, and marketplace managers. This Excel-based dashboard helps you track and analyze key performance indicators (KPIs) related to your online marketplace operations, including sales, product performance, customer satisfaction, and financials. Whether you’re selling on Amazon, eBay, or other online platforms, this dashboard provides valuable insights to optimize your listings, boost sales, and improve overall performance.
The dashboard consolidates all your key marketplace data in one easy-to-use interface, allowing you to track metrics such as revenue growth, product ratings, return rates, and more. With this data at your fingertips, you can make informed decisions to improve your marketing strategies, inventory management, and customer service, ultimately driving business growth.
Key Features of the Online Marketplaces KPI Dashboard in Excel
📈 Sales & Revenue Tracking
Monitor your sales performance across multiple platforms, track revenue growth, and identify best-selling products. This feature helps you understand which products are performing well and where to focus your marketing efforts.
🛍️ Product Performance Analysis
Track product performance metrics, including sales volume, return rates, ratings, and customer feedback. Identify underperforming products and optimize your listings to boost conversions.
💬 Customer Satisfaction Monitoring
Measure customer satisfaction using product reviews, ratings, and feedback. Monitor return rates, feedback trends, and Net Promoter Scores (NPS) to identify areas for improvement.
💸 Financial Tracking & Profitability
Keep track of your financial performance by monitoring costs, profits, and margins. This feature helps you assess the profitability of your online marketplace operations and identify areas to cut costs or increase revenue.
📊 Market Trends & Insights
Gain insights into market trends and track key metrics like conversion rates, average order value, and traffic volume. Use this data to refine your marketing and sales strategies.
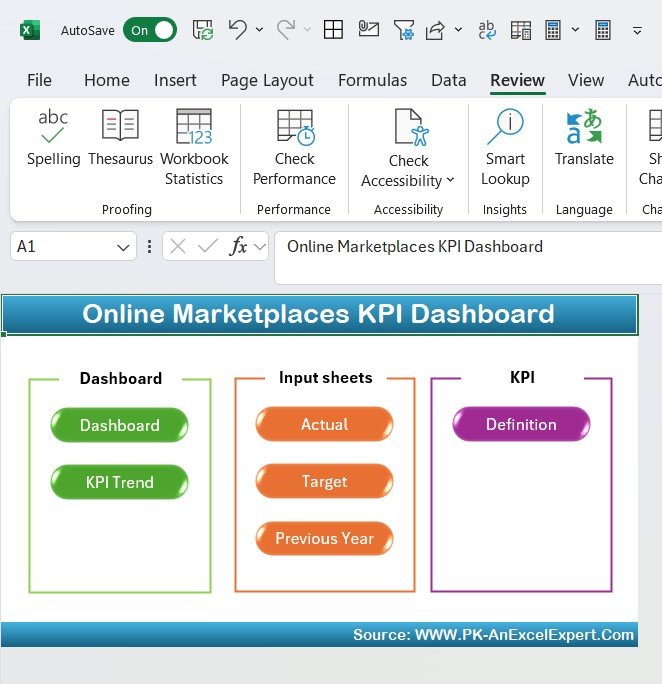
🖥️ Interactive & Customizable Dashboard
The dashboard is fully interactive and customizable. Use filters, slicers, and drill-down options to explore your marketplace data in detail, and adjust the dashboard to match your specific business needs.
Why You’ll Love the Online Marketplaces KPI Dashboard in Excel
✅ Monitor Key E-commerce Metrics
Track all the essential KPIs like sales, product performance, customer satisfaction, and financials in one convenient place.
✅ Optimize Product Listings & Performance
Track return rates, sales volume, and customer reviews to improve your product listings and increase sales.
✅ Improve Customer Satisfaction
Use customer feedback and ratings to improve your service, enhance product quality, and boost customer retention.
✅ Track Financials & Maximize Profitability
Monitor costs, profits, and margins to ensure that your online marketplace operations are financially sound and profitable.
✅ Customizable & Scalable for Your Needs
Adapt the dashboard to fit your e-commerce business model. Whether you are selling on a single marketplace or managing multiple platforms, this template scales to meet your needs.
What’s Inside the Online Marketplaces KPI Dashboard Template in Excel?
- Sales & Revenue Tracking: Monitor revenue growth, sales trends, and best-selling products.
- Product Performance Metrics: Track sales volume, ratings, and returns for each product.
- Customer Satisfaction Data: Measure feedback trends, ratings, and NPS to improve customer experience.
- Financial Tracking: Monitor costs, profits, margins, and overall profitability.
- Market Insights: Track key metrics like conversion rates, order values, and traffic volume.
- Interactive Visualizations: Use dynamic charts and filters to explore data and identify key trends.
How to Use the Online Marketplaces KPI Dashboard in Excel
1️⃣ Download the Template: Get immediate access to the Online Marketplaces KPI Dashboard in Excel.
2️⃣ Input Your Marketplace Data: Enter your sales, product performance, customer feedback, and financial data into the dashboard.
3️⃣ Track & Monitor KPIs: Use the dashboard to monitor sales, product performance, customer satisfaction, and profitability.
4️⃣ Analyze & Optimize: Use the data to optimize product listings, improve customer satisfaction, and refine marketing strategies.
5️⃣ Make Data-Driven Decisions: Leverage the insights from the dashboard to make informed decisions that drive growth and profitability.
Who Can Benefit from the Online Marketplaces KPI Dashboard in Excel?
🔹 E-commerce Business Owners
🔹 Online Retailers & Sellers on Marketplaces like Amazon, eBay, etc.
🔹 Marketplace Managers & Operators
🔹 Marketing & Sales Teams in E-commerce
🔹 Financial Analysts for E-commerce Businesses
🔹 Product Managers in Online Marketplaces
Take control of your online marketplace performance with the Online Marketplaces KPI Dashboard in Excel. Track key metrics, monitor sales, optimize product listings, and drive profitability with this customizable, interactive dashboard.
Click here to read the Detailed blog post
Visit our YouTube channel to learn step-by-step video tutorials
Youtube.com/@PKAnExcelExpert
Compatibility and Requirements
- Works in Microsoft Excel desktop (Excel 2016 or later, or Microsoft 365).
- Slicers filter the dashboard. Microsoft explains how they work in Use slicers to filter data.
Frequently Asked Questions
What does the Online Marketplaces KPI Dashboard track?
It tracks revenue and sales trends, best sellers, product ratings and returns, customer feedback and NPS, costs and margins, and conversion rates, order values and traffic.
What data do I enter?
You enter sales, product performance, customer feedback and financial data. The dashboard then shows the results in its charts.
Can I filter the data?
Yes. Dynamic charts and filters help you explore the data and spot trends.
Is there a Google Sheets or Power BI version?
Yes. See the Online Marketplaces KPI Dashboard in Google Sheets and the Online Marketplaces KPI Dashboard in Power BI.
Related Marketplace Templates
- Online Marketplaces KPI Dashboard in Google Sheets: the same KPIs in Google Sheets
- Online Marketplaces KPI Dashboard in Power BI: the Power BI edition
- Online Marketplaces KPI Scorecard in Excel: a scorecard view of marketplace KPIs
- Online Marketplaces Dashboard in Excel: a full online marketplace dashboard
- Ecommerce Store Business Starter Templates Kit: starter templates for an online store
Browse all Excel KPI dashboards.








Reviews
There are no reviews yet.