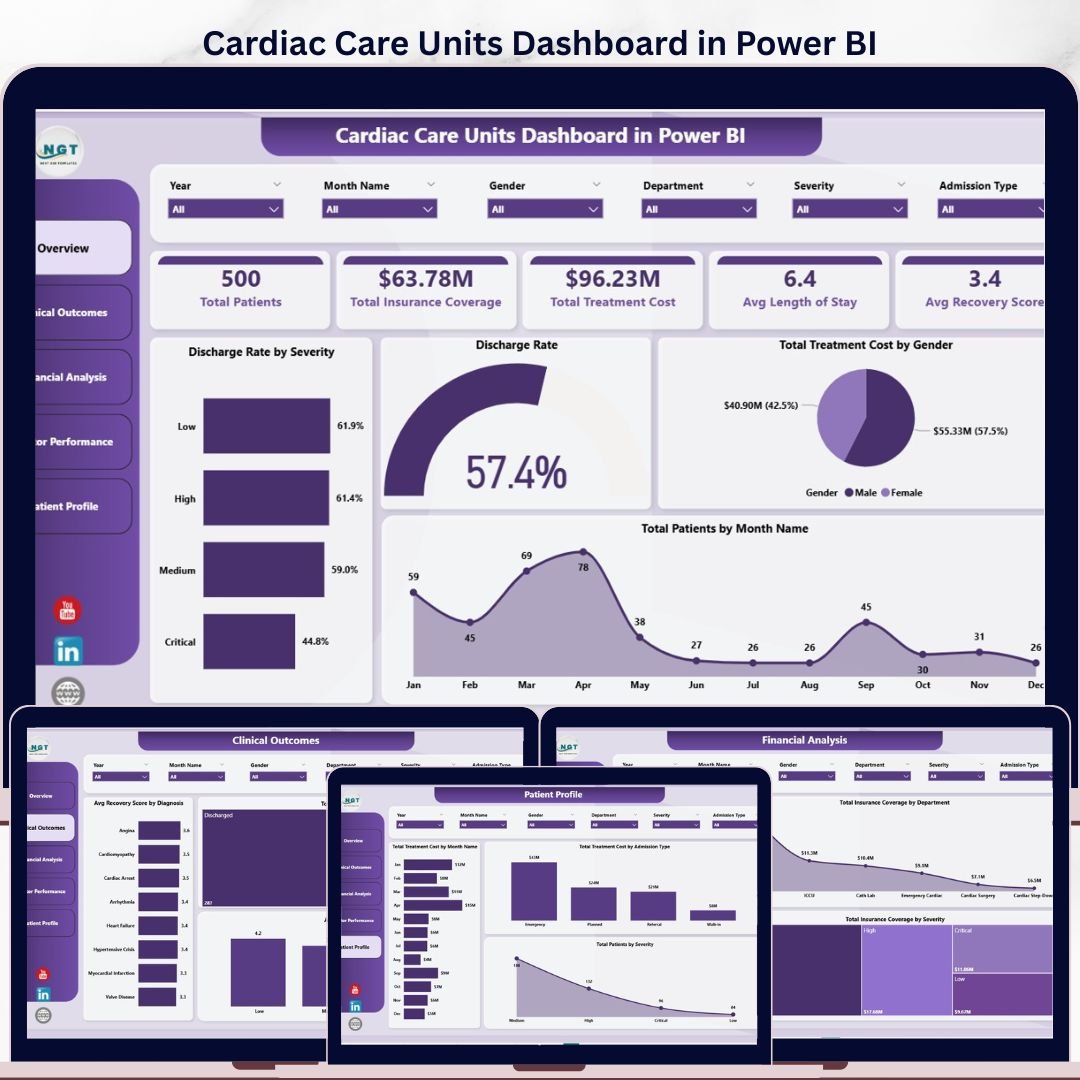

The Cardiac Care Units Dashboard in Power BI tracks 5 headline KPIs across 5 interactive pages, with 13 DAX-driven visuals and slicers covering Severity, Diagnosis, Department, Admission Type, Insurance Provider, and Month. Setup takes under 10 minutes — connect your CCU patient export, click Refresh, and every KPI card, chart, and slicer updates automatically using the built-in star-schema data model.
🌍 Join 8,400+ teams in 40+ countries using Nextgen Templates to replace paid SaaS analytics with one-time-purchase Excel, Google Sheets, and Power BI templates.
✅ Instant download · One-time payment · No subscription · No per-user fees · Lifetime access
🔑 Key Features of Cardiac Care Units Dashboard in Power BI
- 🔹 5 KPI Cards on the Overview page — Total Patients, Total Insurance Coverage, Total Treatment Cost, Avg Length of Stay, and Avg Recovery Score recalculate the moment any slicer is clicked.
- 🔹 13 pre-built Power BI visuals across 5 analysis pages — Every chart points at the central data model, so swapping the sample CSV for a 50,000-row CCU patient export rebuilds every visual in seconds with zero formula edits.
- 🔹 Native Power BI slicers on every page — Filter the entire report by Severity, Diagnosis, Department, Admission Type, Insurance Provider, or Month. One slicer click cascades through all 5 pages thanks to synced slicer settings.
- 🔹 DAX measure library included — Pre-written DAX measures for Discharge Rate, Readmission Rate, Avg Length of Stay, Avg Recovery Score, and Total Treatment Cost. Each measure is documented so you can audit, modify, or extend it.
- 🔹 Pre-formatted patient data table — Columns for Patient ID, Admission Date, Department, Diagnosis, Severity, Length of Stay, Treatment Cost, Insurance Coverage, Insurance Provider, Doctor, Discharge Status, Recovery Score, Readmission flag, and Admission Type.
- 🔹 Works in Power BI Desktop and Power BI Service — Open the .pbix file in the free Power BI Desktop (Windows). Publish to Power BI Service for browser access on Windows, Mac, iOS, and Android — no extra licenses required for the .pbix file itself.
- 🔹 Discharge Rate analytics — Track how many patients are discharged stable, deceased, or transferred, segmented by Severity, Diagnosis, and Department. Identifies bottlenecks in critical-care throughput in under 30 seconds.
- 🔹 Top-5 Doctor performance ranking — Auto-sorts the top five cardiologists by Avg Recovery Score and Avg Length of Stay so clinical leads can see who’s outperforming the unit average without manual sorting.
- 🔹 Designed for cardiac care units, ICUs, CCUs, and cardiology departments — Built around real CCU metrics (severity grading, recovery score, readmission) instead of generic hospital KPIs.
- 🔹 Editable colours, logos, and branding — Replace the placeholder hospital logo, swap the colour theme, and rename any visual title directly in Power BI Desktop. No design tools required.
📦 What’s Inside the Cardiac Care Units Dashboard in Power BI
The dashboard is organized into 5 interactive pages, each focused on a specific decision the CCU leadership team needs to make. Every page uses synced slicers, so one filter click updates the whole report.
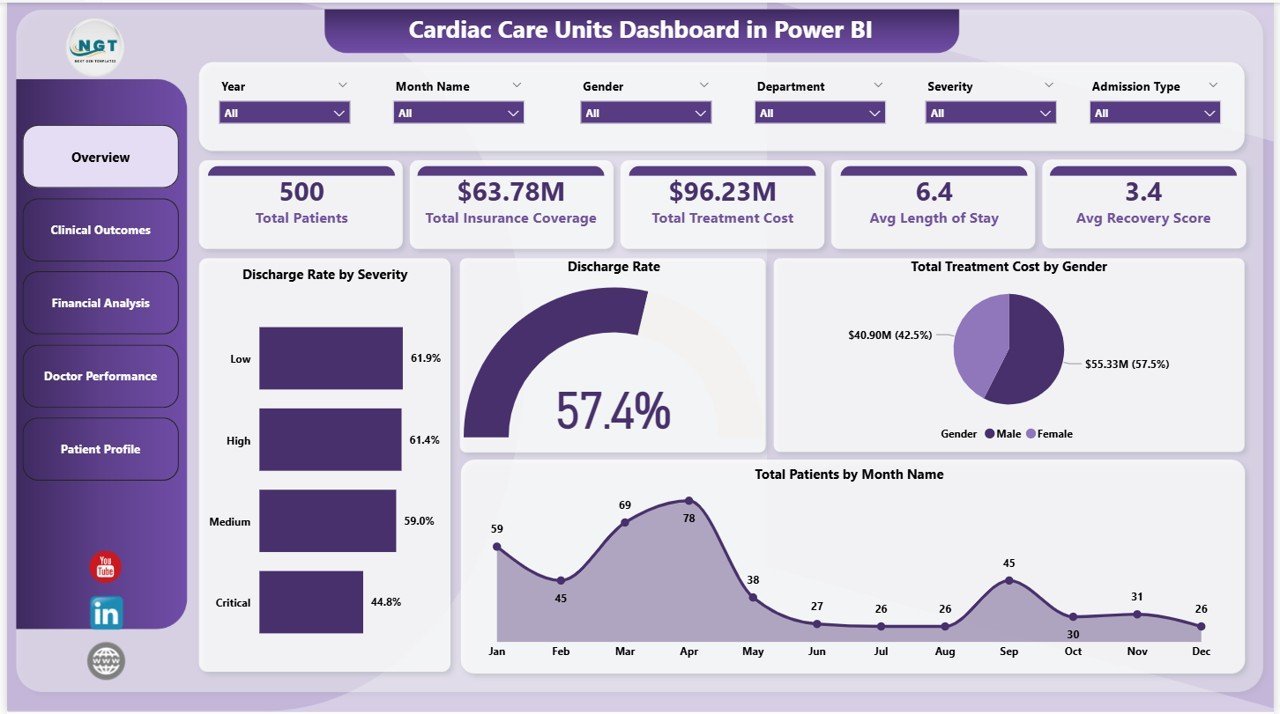
Page 1: Overview
This page shows the 5 headline KPI cards — Total Patients, Total Insurance Coverage, Total Treatment Cost, Avg Length of Stay, and Avg Recovery Score — plus four charts: Discharge Rate by Severity, Discharge Rate (overall trend), Total Treatment Cost by Gender, and Total Patients by Month Name. Slicers at the top let you filter by Severity, Department, Diagnosis, and Month.

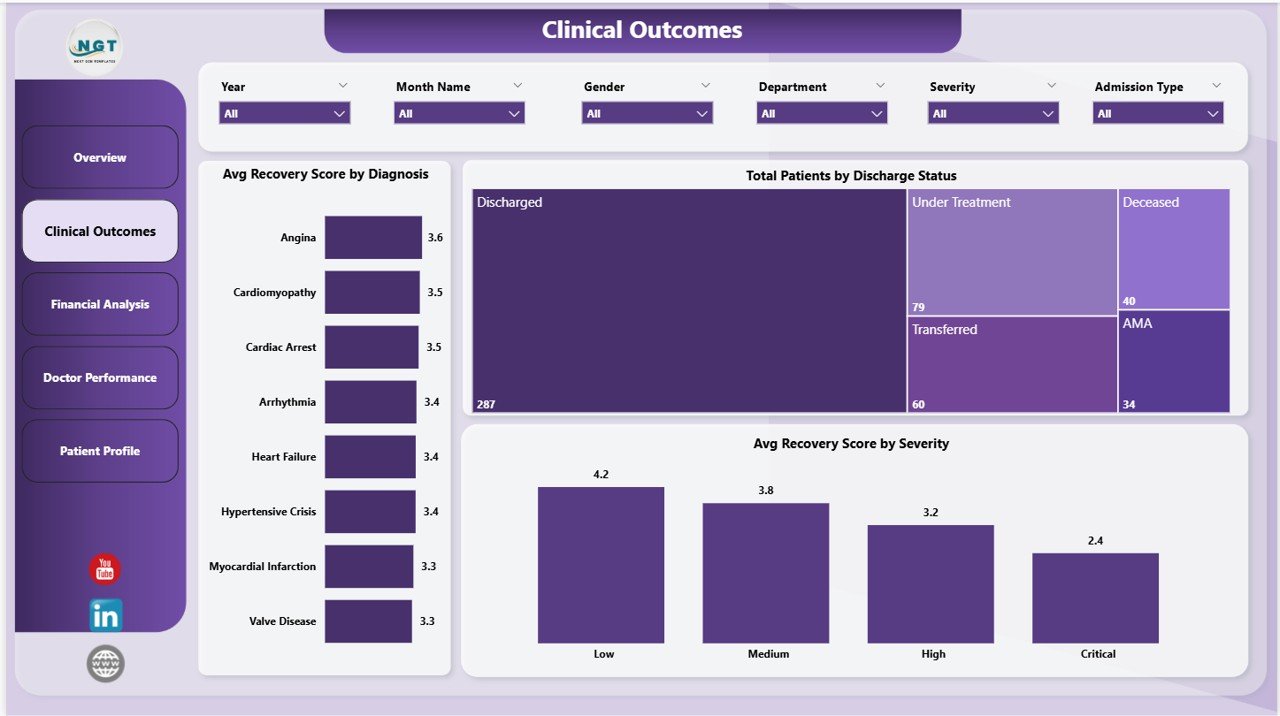
Page 2: Clinical Outcomes
This page focuses on clinical performance with three visuals: Avg Recovery Score by Diagnosis, Total Patients by Discharge Status, and Avg Recovery Score by Severity. Clinical leads use this page to spot which diagnoses are pulling the unit’s recovery score down and which severity grades have the worst outcomes.
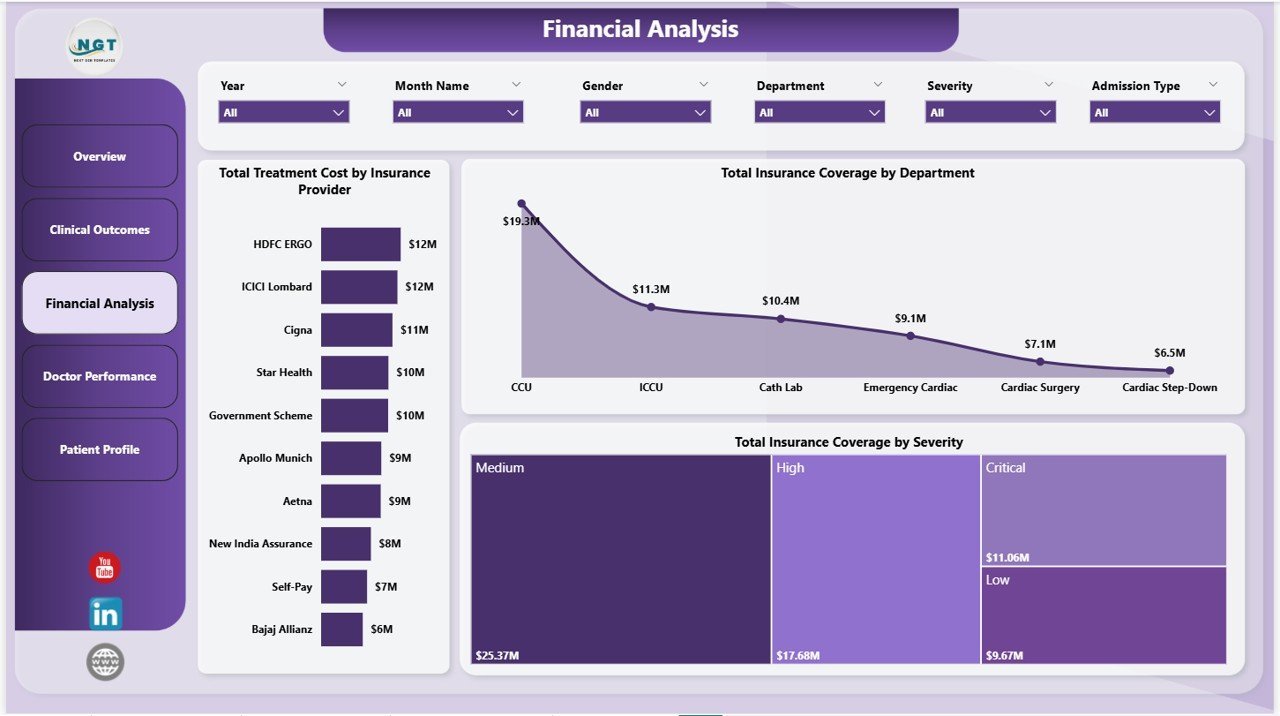
Page 3: Financial Analysis
This page tracks the money side of the unit with three charts: Total Treatment Cost by Insurance Provider, Total Insurance Coverage by Department, and Total Insurance Coverage by Severity. Finance and revenue cycle teams use this to find which payers cover the most, which departments are under-reimbursed, and which severity grades are most expensive to treat.

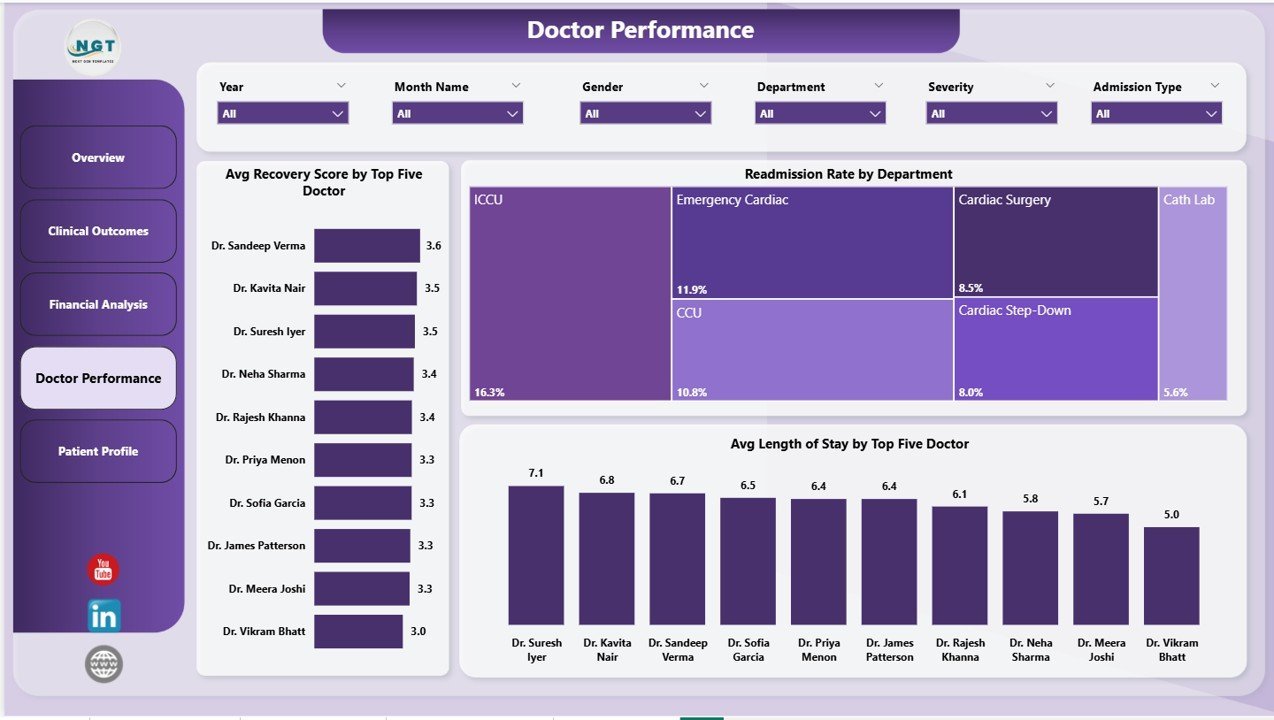
Page 4: Doctor Performance
This page benchmarks the cardiology team with three visuals: Avg Recovery Score by Top Five Doctor, Readmission Rate by Department, and Avg Length of Stay by Top Five Doctor. Hospital administrators and clinical directors use this page for quarterly physician reviews and to identify peer-learning opportunities between top and bottom performers.

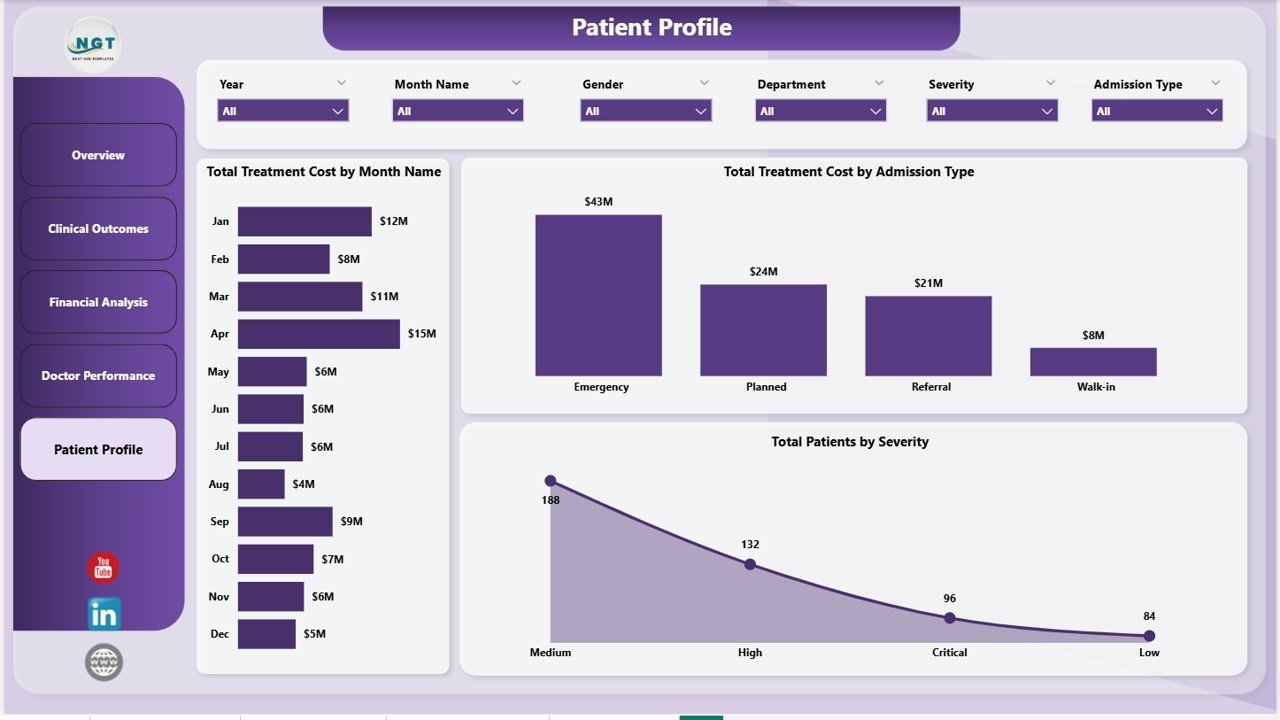
Page 5: Patient Profile
This page profiles the patient mix with three charts: Total Treatment Cost by Month Name, Total Treatment Cost by Admission Type, and Total Patients by Severity. Operations and capacity-planning teams use this page to forecast next quarter’s bed demand, staffing needs, and case-mix index.

📊 Cardiac Care Units Dashboard in Power BI vs. Tableau / Qlik vs. Athenahealth / Epic — Where This Fits
| Feature | Cardiac Care Units Dashboard in Power BI | Tableau / Qlik Sense Cardiac Build | Athenahealth / Epic Clinical Analytics |
|---|---|---|---|
| Cost | $17.99 one-time ✅ | $70-840 / user / year + build time | $140-500 / provider / month |
| Platform | Power BI Desktop (free) ✅ | Tableau Desktop / Qlik Sense | Proprietary EMR analytics module |
| Setup time | Under 10 minutes ✅ | 2-6 weeks consultant build | 3-9 months IT implementation |
| 5 pre-built CCU pages | ✅ Included | ❌ Built from scratch | ⚠️ Generic clinical templates only |
| DAX measure library | ✅ Documented & editable | ❌ Tableau calc fields, different syntax | ❌ Vendor-locked formulas |
| Editable .pbix file | ✅ Full source access | ⚠️ .twb files (different tool) | ❌ Vendor-controlled, no source access |
| Customizable colours & logo | ✅ | ✅ | ⚠️ Limited branding |
| Share via Power BI Service link | ✅ | ⚠️ Needs Tableau Server / Cloud | ✅ But only inside EMR |
| Year-1 cost (5 users) | $17.99 total ✅ | $4,200 / year subscription | $8,400-30,000 / year |
For cardiology departments that want a fully visual CCU performance report without a six-figure EMR analytics contract, the Cardiac Care Units Dashboard in Power BI sits in the sweet spot.
👥 Who This Template Is For — and Who It’s Not For
✅ This template is built for:
- Cardiology department heads tracking CCU performance across 50-1,000 patients per quarter
- Hospital administrators running monthly leadership reviews of clinical outcomes and treatment cost
- Healthcare data analysts who already use Power BI Desktop and want a CCU-specific starter file
- Independent cardiac care hospitals and specialty clinics without a dedicated BI consultant
- Medical students and healthcare-analytics learners studying clinical dashboard design
❌ This template is NOT for:
- Multi-site hospital networks needing live HL7 / FHIR integration — this is a static .pbix file, not an EMR-connected solution
- Teams that need HIPAA-compliant infrastructure out of the box (you must publish to a HIPAA-compliant Power BI tenant yourself)
- Users who don’t have Power BI Desktop installed (it’s free, but Windows-only for the editing app)
- Researchers needing predictive cardiac risk scoring or machine-learning models — this is a descriptive analytics dashboard
⚙️ How to Use the Cardiac Care Units Dashboard in Power BI
- Download and unzip the file after purchase to get the Cardiac-Care-Units-Dashboard.pbix file.
- Open in Power BI Desktop — install Power BI Desktop free from Microsoft if you don’t already have it, then double-click the .pbix file.
- Replace the sample data — open the patient data table in the Power Query editor and point it at your own CCU patient export (CSV, Excel, or SQL source).
- Click Refresh on the Home ribbon — every visual, slicer, and KPI card recalculates automatically against your data.
- Apply slicers on each page to filter by Severity, Diagnosis, Department, Admission Type, Insurance Provider, or Month.
- Optionally publish to Power BI Service using File → Publish to share the report via a secure browser link with your team.
💼 Real-World Use Cases
Dr. Anita runs the Cardiac Care Unit at a 280-bed regional hospital. Every Monday she opens the Cardiac Care Units Dashboard in Power BI, filters by the prior week, and reviews Avg Recovery Score by Severity. When the Severity-4 recovery score drops below 60, she knows to schedule a clinical-protocol review before it shows up in next month’s mortality data.
Marco is a healthcare data analyst at a 5-hospital cardiology network. He used to spend 3 days a month rebuilding a Tableau cardiac report from scratch. Now he points the Cardiac Care Units Dashboard at the network’s unified patient table, swaps the logo, and emails the .pbix link to the CMO — same insights, 90% less rebuild time.
Priya is the CFO of an independent cardiology clinic. She uses the Financial Analysis page to track Total Insurance Coverage by Department and renegotiate provider contracts with the two insurance plans that consistently cover the least — recovering an estimated $42,000 per quarter in under-reimbursed CCU stays.
❓ Frequently Asked Questions
What software do I need to open the Cardiac Care Units Dashboard in Power BI?
You need Power BI Desktop, which is free from Microsoft and runs on Windows. To share the report online, you can publish to Power BI Service (free Microsoft account works for personal use). The .pbix file works in any current version of Power BI Desktop.
How many KPIs does the Cardiac Care Units Dashboard in Power BI track?
The Cardiac Care Units Dashboard in Power BI tracks 5 headline KPIs — Total Patients, Total Insurance Coverage, Total Treatment Cost, Avg Length of Stay, and Avg Recovery Score — plus 13 supporting visuals covering Discharge Rate, Readmission Rate, and breakdowns by Severity, Diagnosis, Department, and Insurance Provider.
Can I replace the sample CCU data with my hospital’s actual patient data?
Yes. Open the .pbix file in Power BI Desktop, go to the Power Query editor, and point the patient data table at your own source (Excel file, CSV, SQL Server, Azure SQL, or any other connector Power BI supports). Click Refresh and every visual recalculates.
How does the Cardiac Care Units Dashboard in Power BI compare to Athenahealth or Epic analytics?
The Cardiac Care Units Dashboard in Power BI costs $17.99 one-time vs. $140-500 per provider per month for Epic or Athenahealth analytics modules. It’s not EMR-connected, so it’s best for monthly leadership reporting rather than live patient monitoring — but the source code is fully editable, unlike vendor-locked EMR dashboards.
How long does setup take?
Setup takes under 10 minutes for someone familiar with Power BI. Download the file, open in Power BI Desktop, swap the sample data table with your own CCU export, and click Refresh. The DAX measures and slicers all carry over automatically.
Is the Cardiac Care Units Dashboard in Power BI editable?
Yes. The .pbix file includes full source access — you can edit visuals, rewrite DAX measures, change the colour theme, swap the logo, add new pages, or remove pages you don’t need. Nothing is locked or hidden.
Does the dashboard work for ICUs other than cardiac care?
The dashboard is built around CCU-specific metrics (recovery score, severity grades, cardiology departments), but the underlying model works for any ICU. You can rename the Diagnosis column values and apply it to a Medical ICU, Surgical ICU, or Neuro ICU with minor edits.
👤 About the Author
Built by PK — Microsoft Certified Professional with 15+ years of Excel, Google Sheets, and Power BI experience. Founder of NextGenTemplates, reaching 300K+ subscribers across YouTube channels (@PK-AnExcelExpert, @NextGenTemplates, @NeoTechNavigators). Every template is hand-built and tested before release.
🔗 Explore Related Templates
- 💎 Healthcare & Hospital Management Bundle — 8 Premium Templates (Save 38%) — Get this dashboard plus 7 more healthcare templates for $79.99 total.
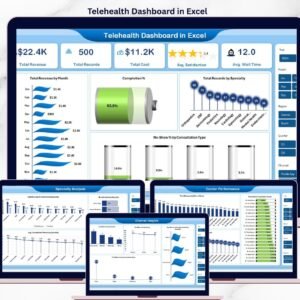
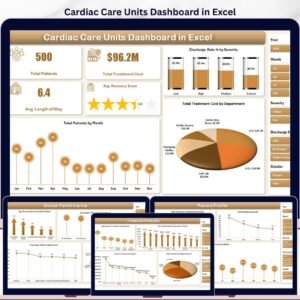
- Cardiac Care Units Dashboard in Excel — Same KPIs and 5-page layout, built in Microsoft Excel with native slicers and pivots.
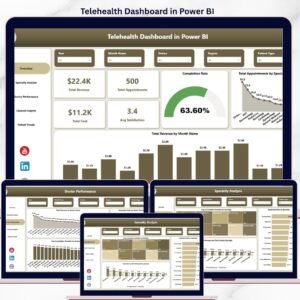
- Telehealth Dashboard in Power BI — Companion report for virtual-care visits, telecommunication channels, and remote-monitoring KPIs.
- Medical Practice Dashboard in Power BI — Broader outpatient-clinic version covering appointments, revenue, and provider productivity.
- HealthTech KPI Dashboard in Power BI — Strategic scorecard view if you want KPI-only rollups instead of operational drill-downs.
Also available as: Cardiology Institutes KPI Dashboard in Excel (cardiology-focused KPI scorecard).
📖 Click here to read the Detailed Blog Post
🎥 Visit our YouTube channel for step-by-step video tutorials
👉 YouTube.com/@NextGenTemplates
📅 Last updated: May 2026
Watch the step-by-step video tutorial:
YouTube


Reviews
There are no reviews yet.