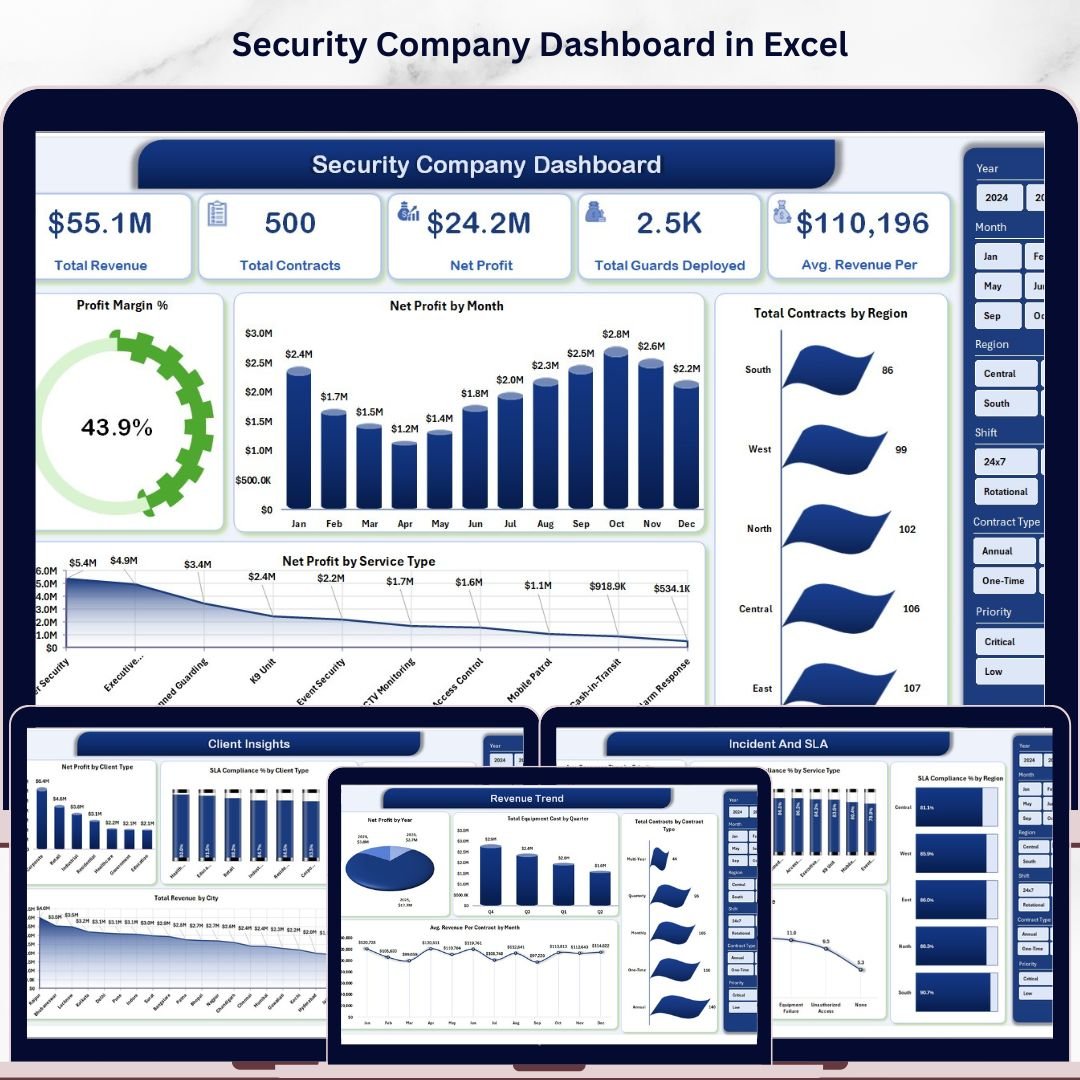


The Security Company Dashboard in Excel tracks 17 KPIs across 5 interactive pages — covering Total Revenue, Net Profit, Total Contracts, Guards Deployed, and SLA Compliance — with 15+ pre-built charts and 4 dynamic slicers on the Overview page alone. Setup takes under 10 minutes: add your data to the Data Sheet, click Data → Refresh All, and every chart and KPI card updates automatically via pivot tables.
🌍 Join 8,400+ teams in 40+ countries who use NextGenTemplates to replace costly SaaS platforms with one-time-purchase Excel templates.
✅ Instant download · One-time payment · No subscription · No per-user fees · Lifetime access
🔑 Key Features of the Security Company Dashboard in Excel
This dashboard delivers a complete operational view of your security business in a single Excel file, with 5 dedicated pages and 15+ pre-built pivot charts — all driven by a central Data Sheet so every update is a one-click refresh. Three definitive facts about what this template delivers:
- Tracks 5 core financial KPIs — Total Revenue, Net Profit, Total Contracts, Total Guards Deployed, and Avg. Revenue Per Contract — on a single Overview page with slicers for real-time filtering by region, service type, and time period.
- The Incident & SLA page monitors 4 compliance metrics: Avg. Response Time by Priority, SLA Compliance % by Service Type, SLA Compliance % by Region, and Avg. Response Time by Incident Type — giving operations managers a clear picture of where delays occur.
- The Support Sheet contains pre-configured pivot tables for all 5 pages; refreshing takes one click via the Excel Ribbon (Data → Refresh All), making data updates a 30-second task regardless of how many records you add.
📦 What’s Inside the Security Company Dashboard in Excel
1. Overview Page
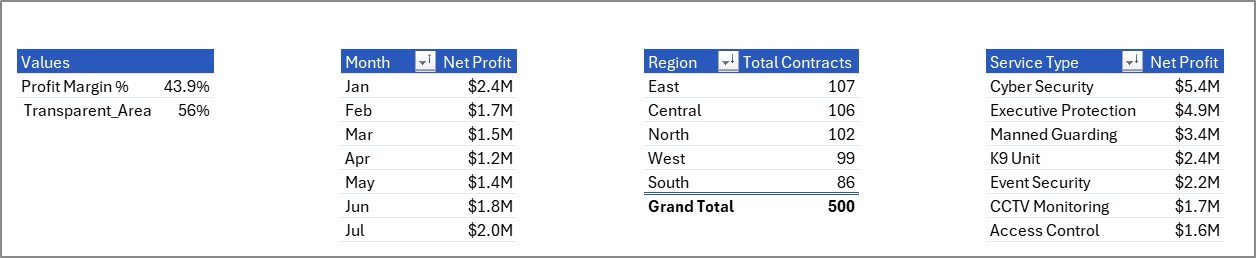
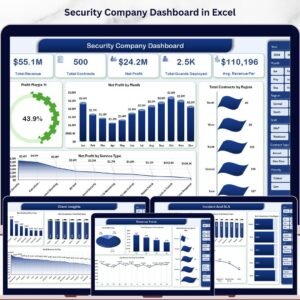
The Overview page surfaces 5 KPI cards alongside 4 charts: Profit Margin %, Net Profit by Month, Total Contracts by Region, and Net Profit by Service Type. Four interactive slicers let you filter the entire dashboard view in seconds.
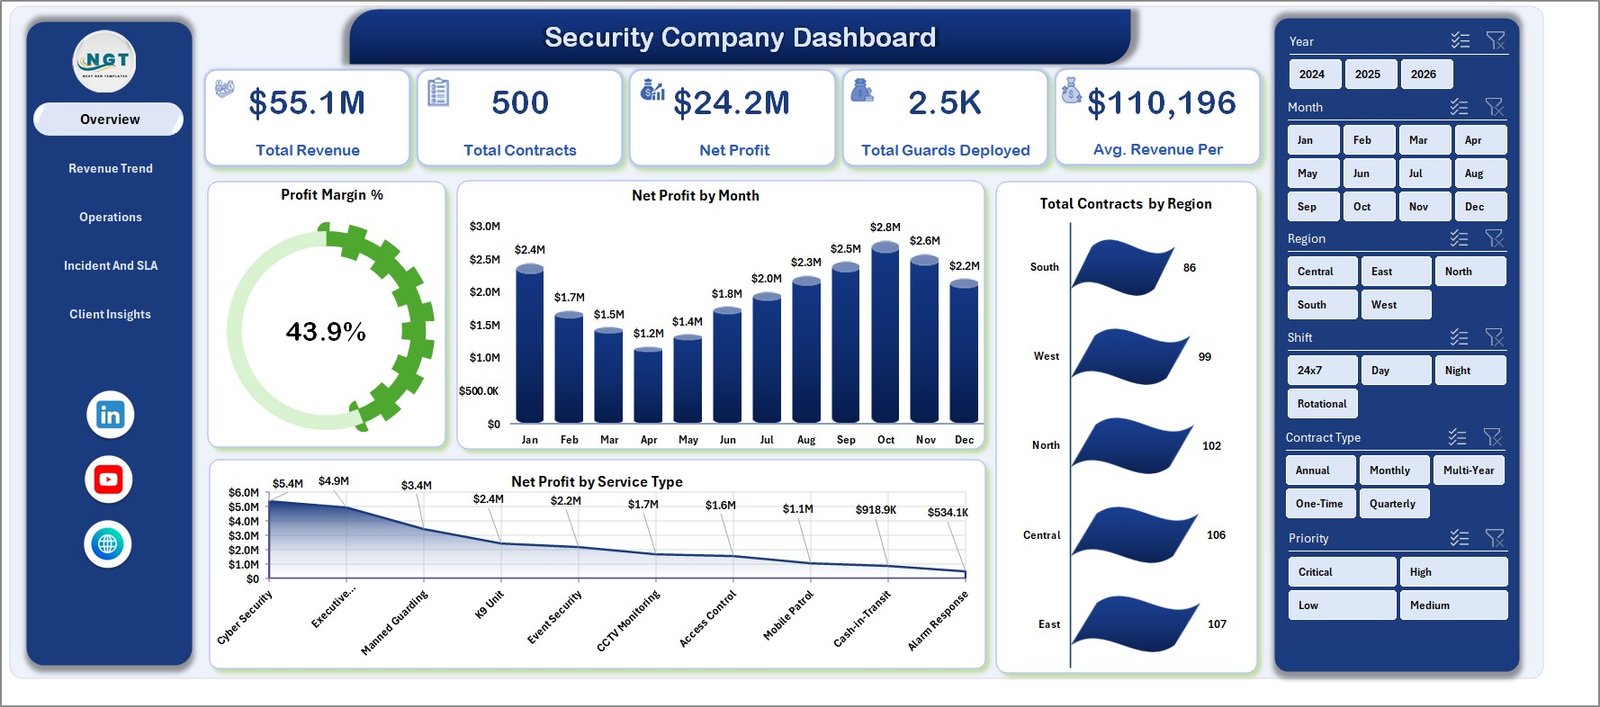
Security Company Dashboard in Excel – Overview Page
2. Revenue Trend
The Revenue Trend page breaks down financial performance over time with 4 analyses: Net Profit by Year, Total Equipment Cost by Quarter, Total Contracts by Contract Type, and Avg. Revenue Per Contract by Month — ideal for spotting seasonal patterns and contract mix shifts.
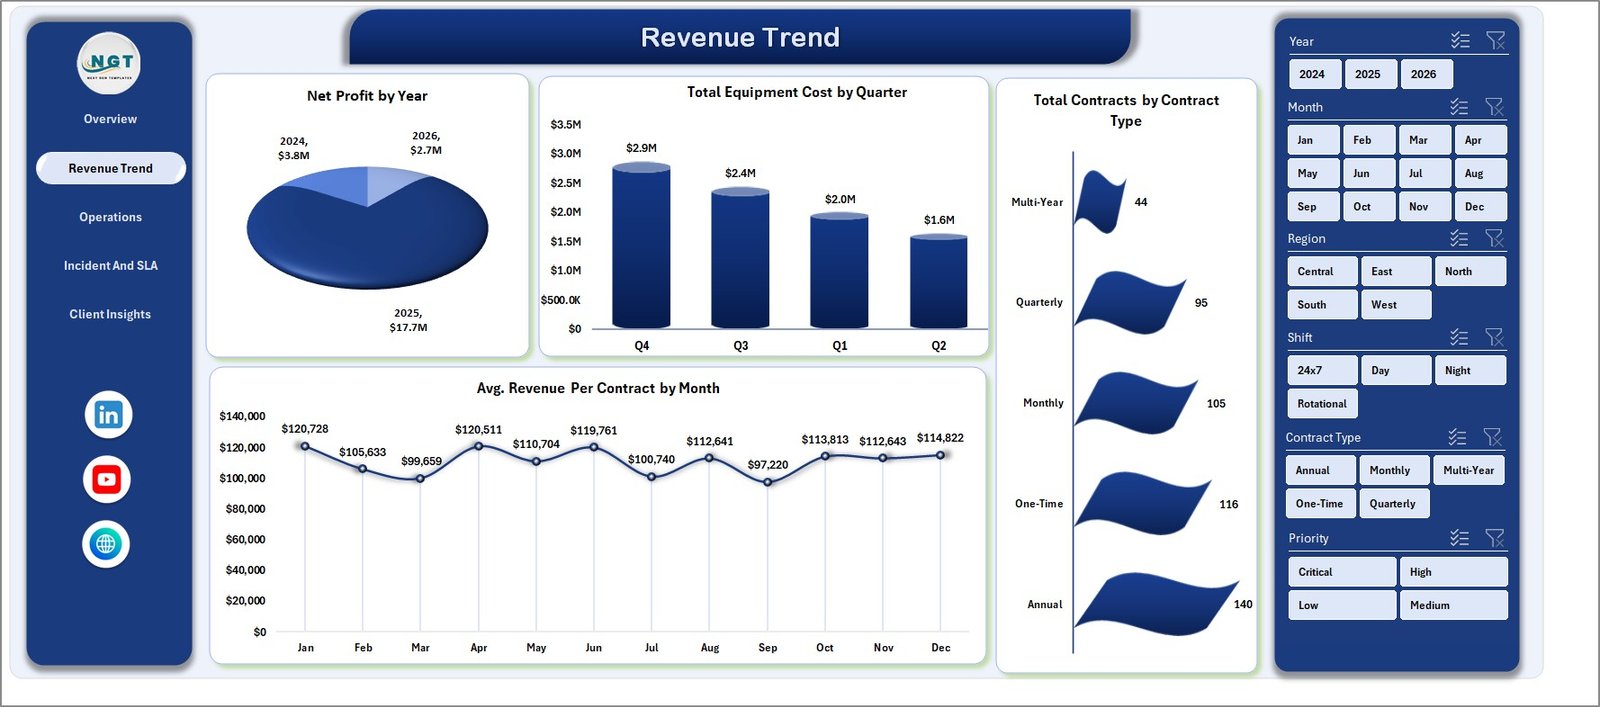
Security Company Dashboard – Revenue Trend Page
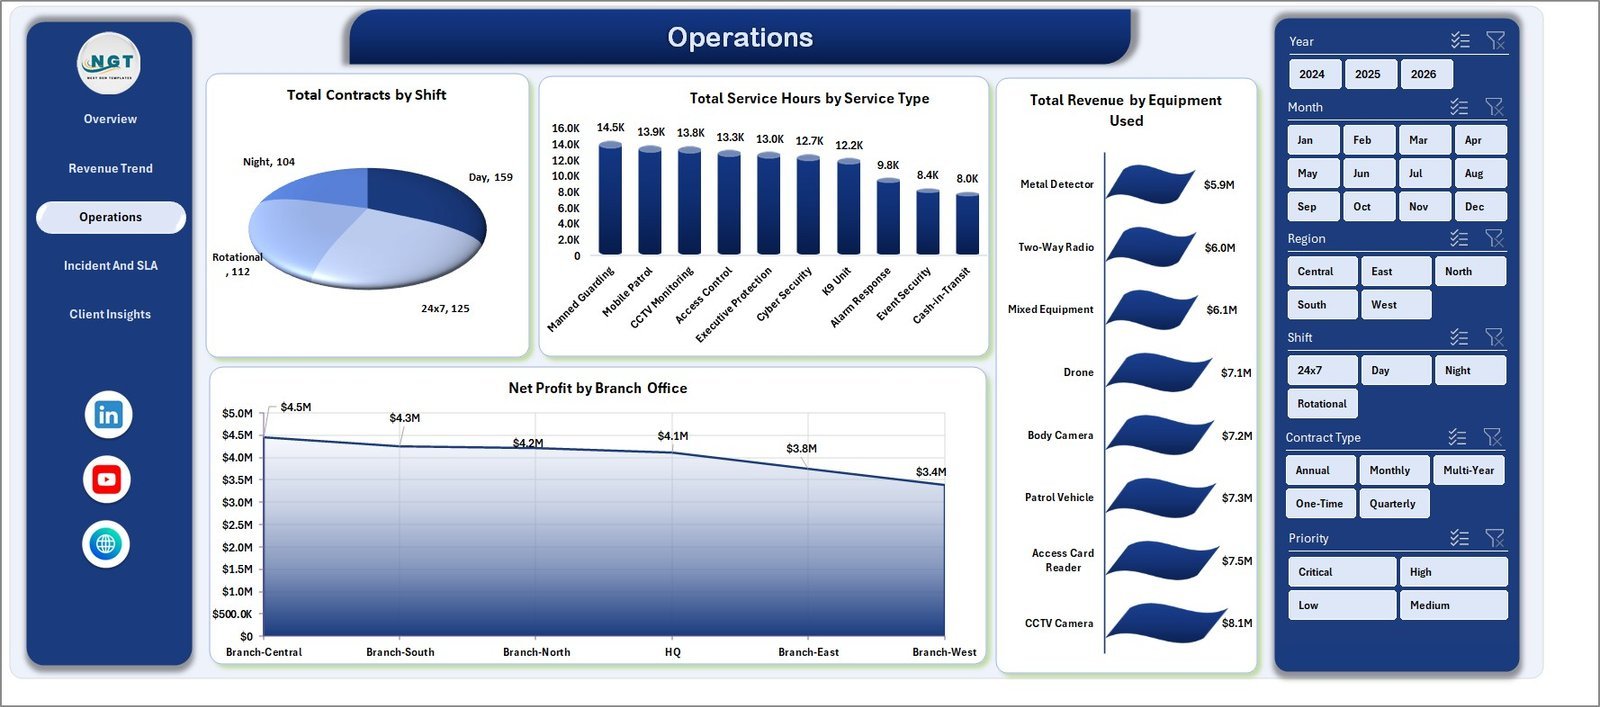
3. Operations
The Operations page tracks deployment and field efficiency with 4 charts: Total Contracts by Shift, Total Service Hours by Service Type, Total Revenue by Equipment Used, and Net Profit by Branch Office — comparing branches and shift profitability at a glance.

Security Company Dashboard – Operations Page
4. Incident & SLA
Four compliance charts cover the full SLA picture: Avg. Response Time by Priority, SLA Compliance % by Service Type, SLA Compliance % by Region, and Avg. Response Time by Incident Type — critical for client retention and contract renewal negotiations.
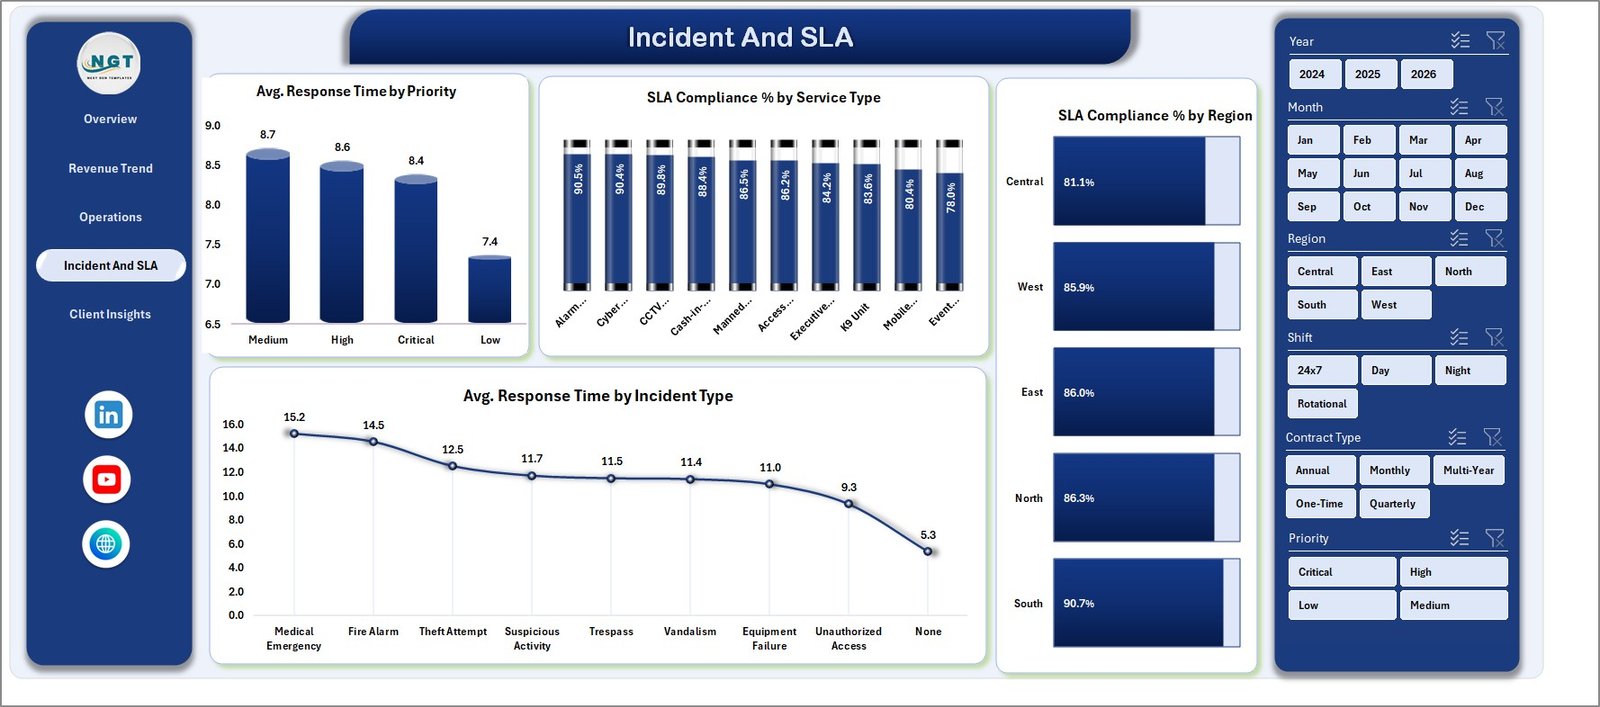
Security Company Dashboard – Incident and SLA Page
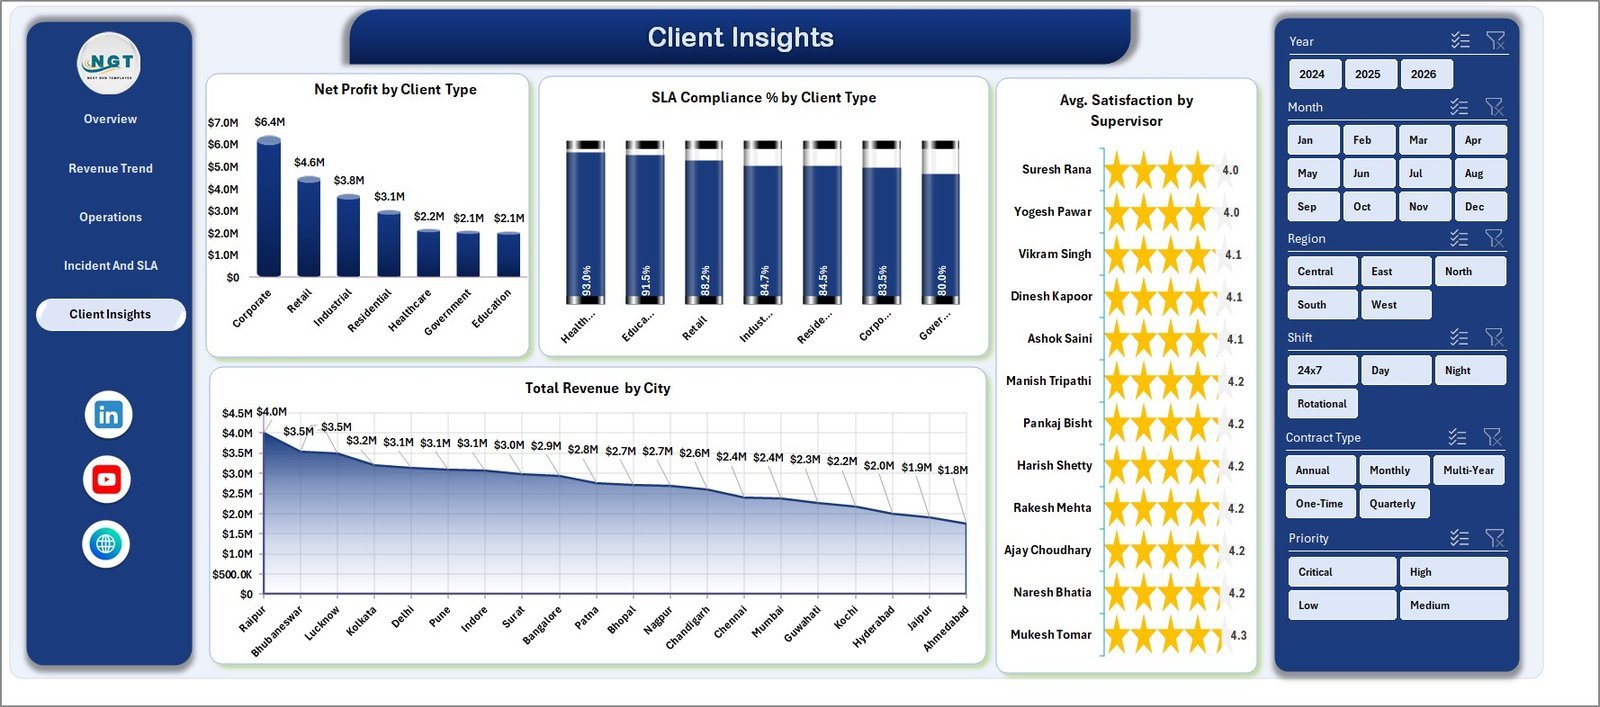
5. Client Insights
The Client Insights page shows Net Profit by Client Type, SLA Compliance % by Client Type, Avg. Satisfaction by Supervisor, and Total Revenue by City — helping account managers identify highest-value clients and underperforming territories.

Security Company Dashboard – Client Insights Page
6. Data Sheet
All raw records go here in a structured table format. Add your own data following the same column layout as the sample records — no formula editing required.

Security Company Dashboard – Data Sheet Tab
7. Support Sheet
The Support Sheet holds all pivot tables that power every chart and KPI card. Keep this sheet hidden during day-to-day use — click Data → Refresh All after updating the Data Sheet and everything recalculates automatically.
Security Company Dashboard – Support Sheet Tab
📊 Security Company Dashboard in Excel vs. Google Sheets vs. GuardTrax — Where This Fits
| Feature | Security Company Dashboard in Excel | Google Sheets Security Template | GuardTrax (SaaS) |
|---|---|---|---|
| Cost | $17.99 one-time ✅ | Free but limited | $35–80 / user / month |
| Platform | Microsoft Excel ✅ | Browser only | Cloud SaaS app |
| Setup time | Under 10 minutes ✅ | 15–30 minutes | 1–3 days onboarding |
| 5 dashboard pages | Yes ✅ | No | Partial |
| SLA compliance tracking | Yes ✅ | Limited | Yes |
| Works offline | Yes ✅ | No | No |
| Customizable fields | Fully ✅ | Limited | Paid add-on |
| Year-1 cost (5 users) | $17.99 total ✅ | $0 (limited) | $2,100–$4,800 |
For security companies that want full KPI and SLA reporting without a monthly SaaS bill, the Security Company Dashboard in Excel sits in the sweet spot.
👥 Who This Template Is For — and Who It’s Not For
✅ This template is built for:
- Security company owners and operations managers tracking 5–500 guards across multiple sites
- Finance leads who need monthly revenue, contract, and profit breakdowns by region and service type
- Account managers monitoring SLA compliance and client satisfaction scores
- Regional managers comparing branch-level performance and shift profitability
❌ This template is NOT for:
- Enterprise security firms requiring live GPS guard tracking or real-time dispatch software
- Teams that need simultaneous multi-user cloud editing (consider Google Sheets version instead)
⚙️ How to Use the Security Company Dashboard in Excel
- Download the ZIP file and open the Excel file in Microsoft Excel 2016 or later.
- Navigate to the Data Sheet tab and replace sample records with your own data, following the existing column structure.
- Click Data → Refresh All in the Excel Ribbon to refresh all pivot tables.
- Use the slicers on the Overview page to filter by region, service type, or time period.
- Review the Incident & SLA page to identify compliance gaps by priority and service type.
- Keep the Support Sheet hidden once set up — it powers all charts automatically.
💼 Real-World Use Cases
Raj manages operations at a 120-guard firm covering retail and commercial sites. He uses the Security Company Dashboard in Excel to review SLA compliance and response time by region every Monday — presenting findings in client review meetings without paying $3,000/month for a SaaS platform.
Diana is the Finance Director at a mid-sized security company. She tracks Total Revenue, Net Profit, and Avg. Revenue Per Contract by month using the Revenue Trend page — identifying which contract types are most profitable and which regions are underdelivering on margins.
Carlos runs three branch offices in different cities. He uses the Operations and Client Insights pages to compare branch-level net profit, supervisor satisfaction scores, and city revenue — then redirects guard allocations each quarter based on the data.
❓ Frequently Asked Questions
What KPIs does the Security Company Dashboard in Excel track?
The Security Company Dashboard in Excel tracks 17+ KPIs including Total Revenue, Net Profit, Total Contracts, Total Guards Deployed, Avg. Revenue Per Contract, Profit Margin %, SLA Compliance % by region and service type, and Avg. Response Time by priority and incident type.
How long does setup take?
Setup takes under 10 minutes. Open the Excel file, replace the sample data in the Data Sheet tab with your own records, click Data → Refresh All in the Excel Ribbon, and every chart and KPI card updates instantly. No formula editing required.
Does this work on Mac?
Yes. The Security Company Dashboard in Excel works on Microsoft Excel for Mac (2016 or later) and Excel for Windows. Slicers and pivot charts are fully compatible on both platforms.
How does this compare to GuardTrax or similar SaaS platforms?
GuardTrax and similar platforms cost $35–$80 per user per month with multi-day onboarding. The Security Company Dashboard in Excel delivers KPI and SLA reporting for a one-time $17.99 — no subscription, no per-user fees, and no internet connection required.
Can I add more data rows?
Yes. The Data Sheet supports unlimited rows. Add records below the existing sample data in the same column format, then click Data → Refresh All. All pivot tables and charts expand automatically to include the new records.
Is Microsoft Excel required?
Yes. This template requires Microsoft Excel 2016 or later for full pivot table, slicer, and chart functionality. It is not recommended for Google Sheets, which does not fully support all pivot and slicer features used in this file.
👤 About the Author
Built by PK — Microsoft Certified Professional with 15+ years of Excel, Google Sheets, and Power BI experience. Founder of NextGenTemplates, reaching 300K+ subscribers across YouTube channels (@PK-AnExcelExpert, @NextGenTemplates, @NeoTechNavigators). Every template is hand-built and tested before release.
🔗 Explore Related Templates
Browse more Excel Dashboard Templates from NextGenTemplates:
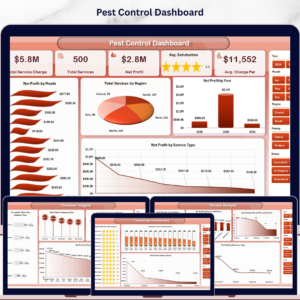
- Pest Control Dashboard in Excel — Field service operations tracking with revenue, jobs, and customer insights
- Cybersecurity Report in Excel — Security incident and vulnerability reporting for IT teams
📖 Click here to read the Detailed Blog Post
🎥 Visit our YouTube channel for step-by-step video tutorials
👉 YouTube.com/@NextGenTemplates
📅 Last updated: May 2026


Reviews
There are no reviews yet.