The Sale Activity Tracker in Google Sheets monitors 500 sales activities across 6 interactive pages, with 12+ pre-built charts, 4 slicer filters per page, and automatic KPI calculations. Setup takes under 10 minutes — just replace the sample data and every dashboard page updates automatically.
🌍 Join 8,400+ teams in 40+ countries using NextGenTemplates to replace paid SaaS tools with one-time-purchase Excel, Google Sheets, Power BI, and HTML templates.
✅ Instant download · One-time payment · No subscription · No per-user fees · Lifetime access
🔑 Key Features of Sale Activity Tracker in Google Sheets
This tracker monitors every sales interaction from first contact through deal close. It tracks pipeline value ($16.8M+ in sample data), won revenue ($4.4M), total activities (500 records), and average won deal size ($63,773) — all updating in real time through native Google Sheets pivot tables and slicers.
📊 Each dashboard page includes 4 interactive slicers — Region, Stage, Product, Month, Year, and Sales Rep — letting you slice data instantly without editing formulas. The Overview page shows Pipeline by Stage as a bar chart, Regional Distribution as a donut chart, Lead Source Performance as a horizontal bar chart, and Product Revenue as a column chart.
📋 The Pipeline page tracks Deals Won (69), Deals Lost (67), Win Rate (50.7%), and Average Probability with a Monthly Deal Value area chart, Stage Value Distribution breakdown, and Activity Mix donut chart. The Search page provides instant activity lookup by Activity ID, pulling all deal details including contact name, company, product, deal value, stage, and probability.
This template uses only native Google Sheets features — no macros, no add-ons, no Apps Script. It works on any device with a Google account, and multiple team members can collaborate simultaneously.
📦 What’s Inside the Sale Activity Tracker in Google Sheets
📌 Overview Page – Four KPI cards (Pipeline Value, Won Revenue, Total Activities, Avg Won Deal) plus Pipeline by Stage bar chart, Regional Distribution donut chart, Lead Source Performance horizontal bars, and Product Revenue column chart. Four slicers filter everything: Region, Stage, Product, and Month.
📌 Pipeline Page – Four KPI cards (Deals Won, Deals Lost, Win Rate, Avg Probability) plus Monthly Deal Value area chart, Stage Value Distribution sidebar, and Activity Mix donut chart. Four slicers: Year, Region, Sales Rep, and Month.
📌 Reps Page – Individual sales rep performance metrics and comparisons with dedicated slicer filters.
📌 Products Page – Product-level revenue analysis across all sales activities and deal stages.
📌 Search Page – Activity Lookup tool where you enter an Activity ID from a dropdown and instantly see all 12 details: Activity ID, Date, Sales Rep, Region, Lead Source, Company, Contact Name, Product, Activity Type, Deal Value, Stage, and Probability %.
📌 Data Sheet – 500 rows of structured sample data with 13 columns: Activity ID, Date, Sales Rep, Region, Lead Source, Company, Contact Name, Product, Activity Type, Deal Value, Stage, Probability %, and Status (Active, Completed, Cancelled). Replace with your own data to auto-update all pages.
📌 Instructions Page – Step-by-step guide on how to customize the tracker with your own sales data.
📊 Sale Activity Tracker vs. Microsoft Excel Dashboard vs. HubSpot CRM — Where This Fits
| Feature | Sale Activity Tracker (Google Sheets) | Excel Sales Dashboard | HubSpot CRM |
|---|---|---|---|
| Cost | $6.99 one-time | $9.99-17.99 one-time | $20-50/user/month |
| Platform | Google Sheets (browser-based) | Microsoft Excel (desktop) | Web application |
| Setup Time | Under 10 minutes | 10-15 minutes | 1-3 days |
| Real-time Team Collaboration | ✅ Yes — simultaneous editing | ❌ No — file sharing only | ✅ Yes |
| Mobile Access | ✅ Google Sheets app | Limited via Excel mobile | ✅ Yes |
| Customizable Fields | ✅ Fully editable | ✅ Fully editable | Limited on free plan |
| Pipeline & Deal Tracking | ✅ Built-in with 7 stages | ✅ With formulas | ✅ Advanced |
| Activity Lookup Search | ✅ Instant ID-based lookup | Requires VBA/manual filter | ✅ Full search |
| Year-1 Cost at 5 Users | $6.99 total | $9.99-17.99 total | $1,200-3,000 |
For sales teams that want pipeline visibility and activity tracking without paying per-user SaaS fees, the Sale Activity Tracker in Google Sheets sits in the sweet spot.
👥 Who This Template Is For — and Who It’s Not For
✅ This template is built for:
- Sales managers at 5-100 person companies tracking rep activities and pipeline health
- Startup founders managing their own sales pipeline without a CRM budget
- Freelance consultants tracking client outreach, demos, and deal stages
- Small business owners monitoring lead sources and regional performance
❌ This template is NOT for:
- Enterprise sales teams needing Salesforce-level automation with workflow triggers and API integrations
- Organizations requiring SOC 2 compliance and role-based access controls
- Teams managing 10,000+ simultaneous deals needing real-time database performance
⚙️ How to Use the Sale Activity Tracker in Google Sheets
1️⃣ Open the PDF guide included in your download and click the Google Sheets copy link to create your own editable copy in Google Drive.
2️⃣ Go to the Data sheet and replace the 500 sample rows with your actual sales activity records — keep the same column headers.
3️⃣ Navigate to the Overview page and use the Region, Stage, Product, and Month slicers to filter your pipeline data.
4️⃣ Check the Pipeline page to review Deals Won, Deals Lost, Win Rate, and Monthly Deal Value trends.
5️⃣ Use the Search page to look up any specific activity by entering its Activity ID in the dropdown.
6️⃣ Share the Google Sheets link with your sales team for real-time collaborative access.
💼 Real-World Use Cases
James runs sales at a 25-person SaaS startup. He uses the Sale Activity Tracker in Google Sheets to monitor his 4 reps’ deal pipelines across Negotiation, Proposal, and Qualification stages. Every Monday morning, he filters by Sales Rep and Month to review who closed deals and who needs coaching — without paying $45/user/month for HubSpot Sales Hub.
Maria is a freelance business development consultant. She tracks her client outreach across 3 regions using the Overview page slicers. The Lead Source Performance chart shows her that LinkedIn generates 30% more revenue than Cold Calls, so she reallocates her prospecting hours accordingly.
David manages a regional insurance brokerage team. He uses the Pipeline page to track monthly deal value trends and the Search page to pull individual activity records for quarterly reviews. The Stage Value Distribution helps him identify bottlenecks — $4.6M stuck in Proposal stage means his team needs better follow-up sequences.
❓ Frequently Asked Questions
How many sales activities can this tracker handle?
The Sale Activity Tracker in Google Sheets comes with 500 pre-loaded sample activities and can handle thousands of additional rows. Google Sheets supports up to 10 million cells, so storage is rarely a concern for sales teams.
Does this template require Google Apps Script or macros?
No. The Sale Activity Tracker in Google Sheets uses only native Google Sheets features — pivot tables, slicers, formulas, and charts. No macros, no Apps Script, no add-ons required.
Can multiple team members use this tracker at the same time?
Yes. Since it runs in Google Sheets, your entire sales team can view and edit simultaneously. Share the link and set editing permissions through Google Drive sharing settings.
How does this compare to HubSpot CRM for small teams?
The Sale Activity Tracker costs $6.99 one-time versus HubSpot CRM at $20-50 per user per month. For teams under 50 people who need pipeline visibility without workflow automation, this tracker delivers 90% of the value at under 1% of the cost.
What deal stages are included in this tracker?
The Sale Activity Tracker in Google Sheets includes 7 pipeline stages: Closed Lost, Closed Won, Needs Analysis, Negotiation, Proposal, Prospecting, and Qualification. You can rename or add stages by editing the Data sheet.
Can I customize the regions and products?
Yes. All regions (Central, East, North, South, West) and products (Data Platform, Cloud Suite, HR Module, Marketing Hub, Analytics Pro, Security Shield, CRM Enterprise) are editable. Change values in the Data sheet and slicers update automatically.
How long does setup take?
Setup takes under 10 minutes. Copy the template to your Google Drive, replace sample data with your own sales records keeping the same column headers, and all 6 pages update automatically.
👤 About the Author
Built by PK — Microsoft Certified Professional with 15+ years of Excel, Google Sheets, and Power BI experience. Founder of NextGenTemplates, reaching 300K+ subscribers across YouTube channels (@PK-AnExcelExpert, @NextGenTemplates, @NeoTechNavigators). Every template is hand-built and tested before release.
🔗 Explore Related Templates
📌 E-Commerce Sales Performance Tracker in Google Sheets – Track online store sales KPIs with automated pivot charts and slicer filters.
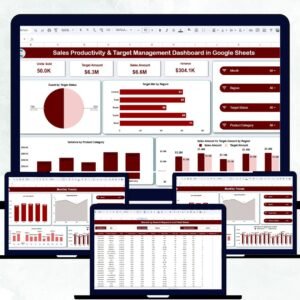
📌 Sales Productivity & Target Management Dashboard in Google Sheets – Monitor sales targets, quotas, and rep productivity with visual dashboards.
📌 Monthly Sales Tracker and Report in Google Sheets – Track monthly revenue, units sold, and sales trends with built-in reports.
📌 Browse all Google Sheets Tracker Templates for more tracking solutions.
📖 Click here to read the Detailed Blog Post
Watch the step-by-step video tutorial:
🎥 Visit our YouTube channel for step-by-step video tutorials
👉 YouTube.com/@NextGenTemplates


Reviews
There are no reviews yet.